. 2024 Jan 12;229(1):161-172.
doi: 10.1093/infdis/jiad315.

Tafenoquine-Atovaquone Combination Achieves Radical Cure and Confers Sterile Immunity in Experimental Models of Human Babesiosis

Affiliations

Tafenoquine-Atovaquone Combination Achieves Radical Cure and Confers Sterile Immunity in Experimental Models of Human Babesiosis

Pratap Vydyam et al. J Infect Dis. .

Abstract

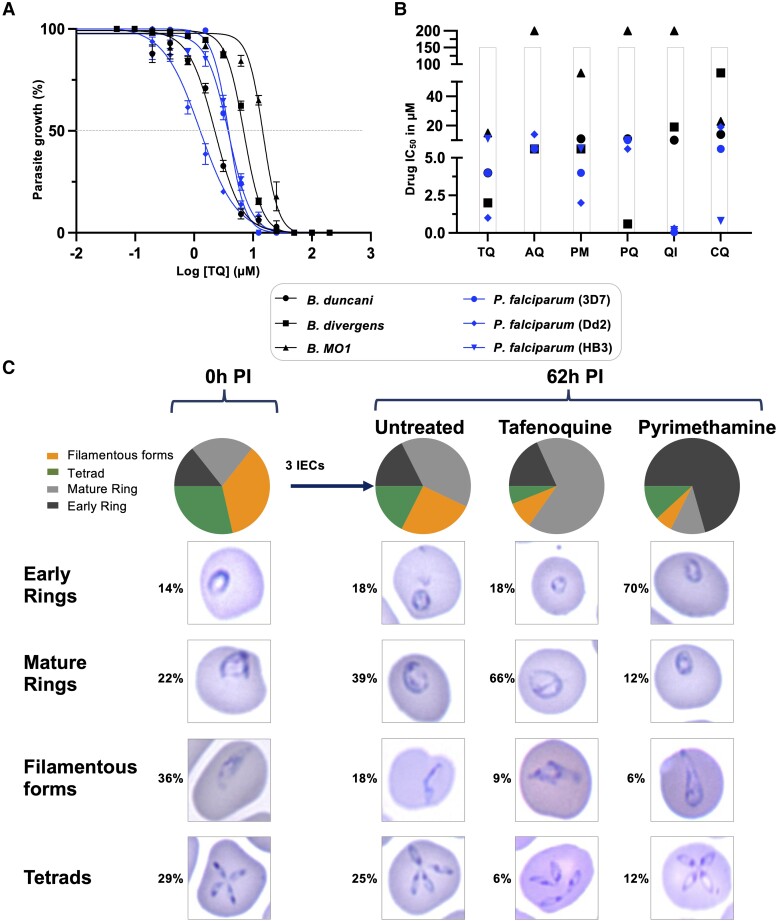
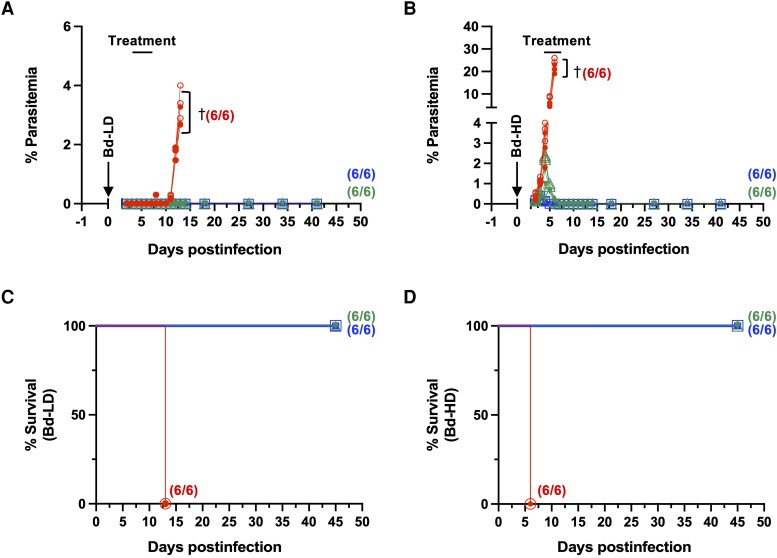
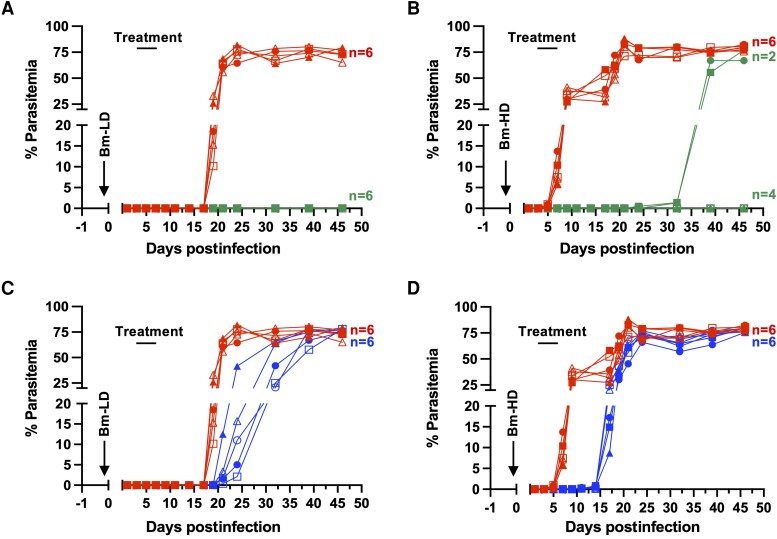
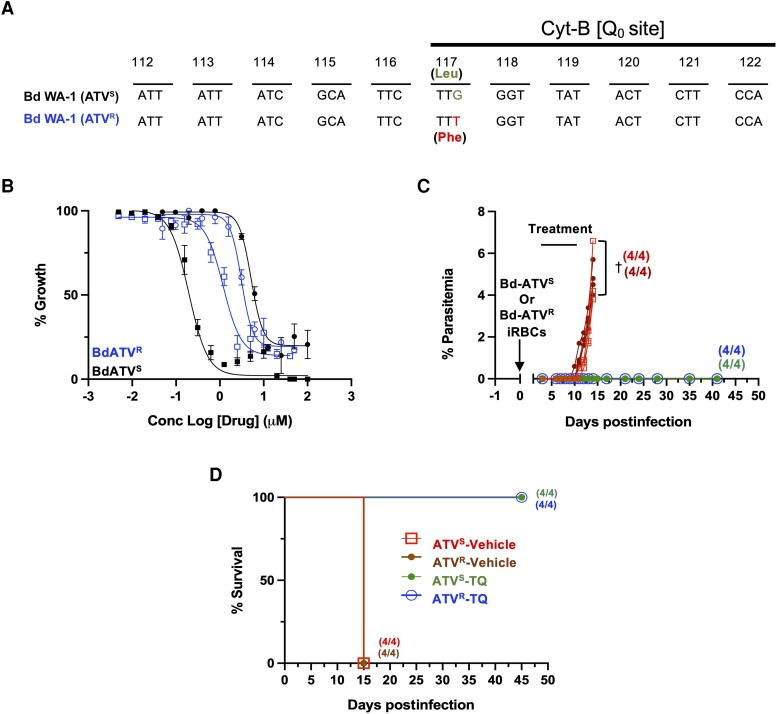
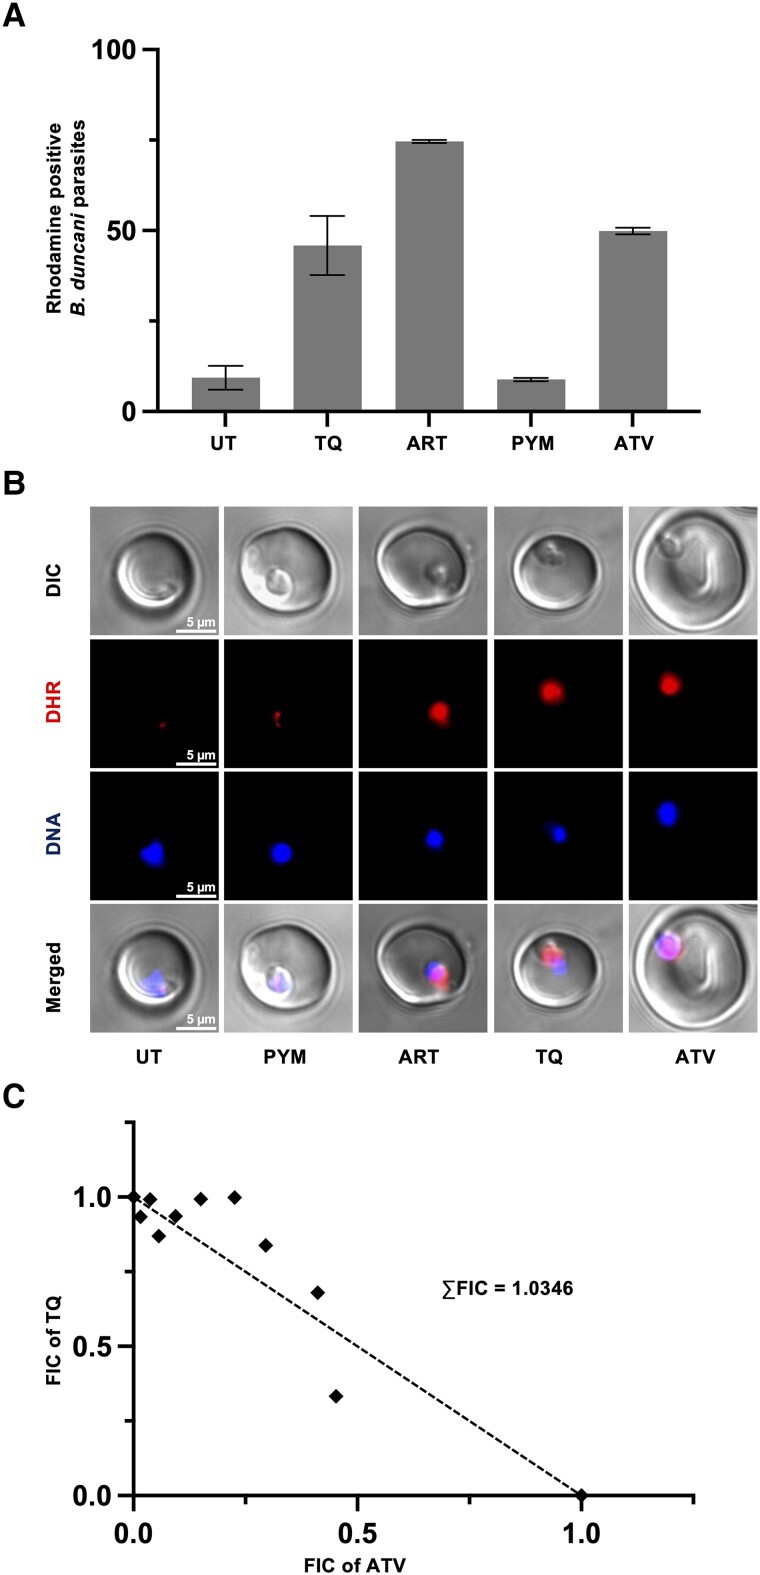
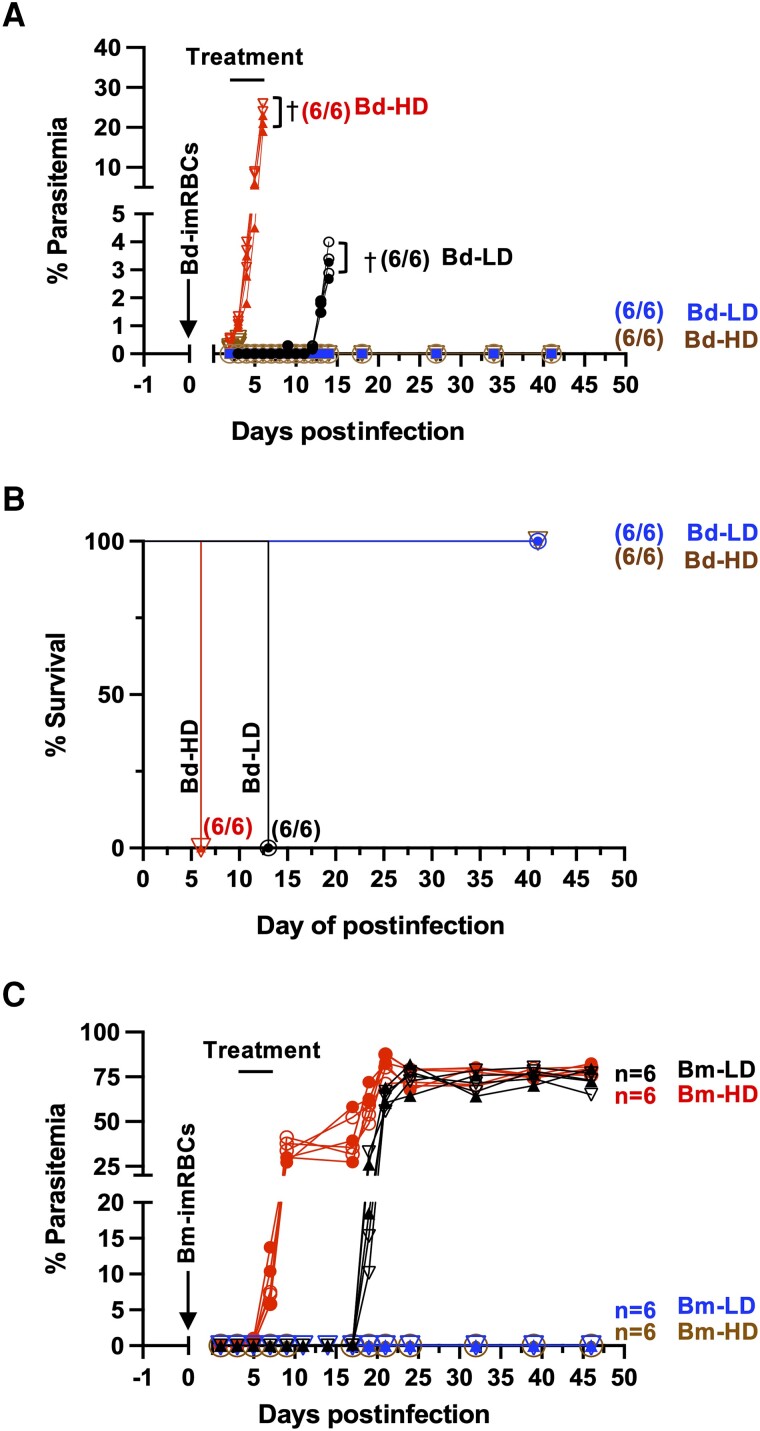
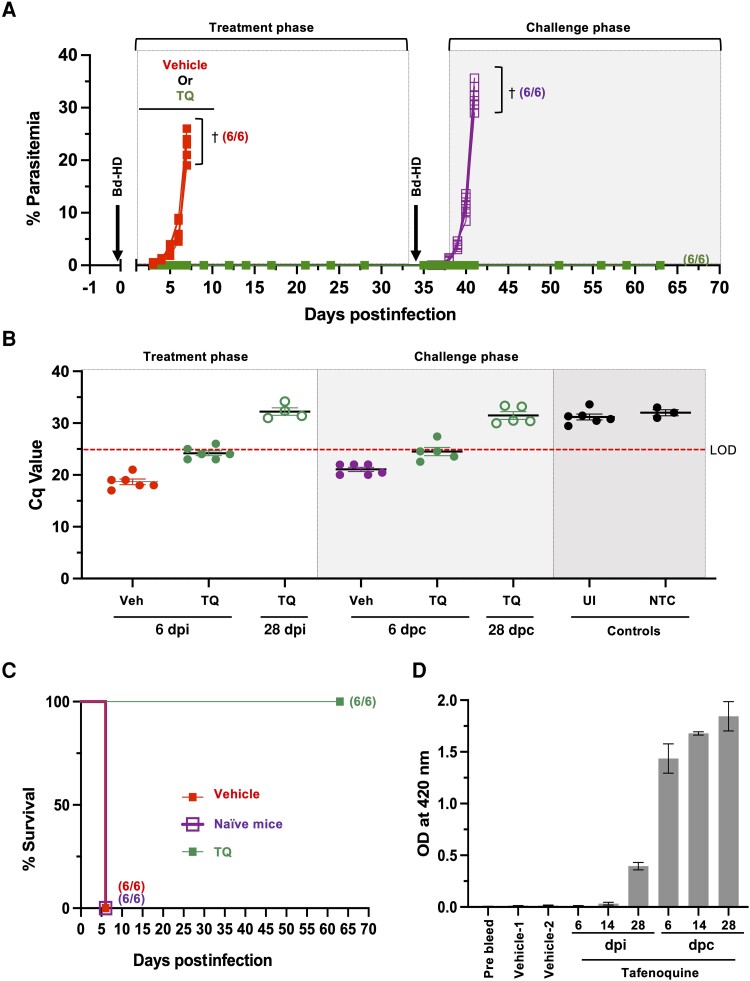
Human babesiosis is a potentially fatal tick-borne disease caused by intraerythrocytic Babesia parasites. The emergence of resistance to recommended therapies highlights the need for new and more effective treatments. Here we demonstrate that the 8-aminoquinoline antimalarial drug tafenoquine inhibits the growth of different Babesia species in vitro, is highly effective against Babesia microti and Babesia duncani in mice and protects animals from lethal infection caused by atovaquone-sensitive and -resistant B. duncani strains. We further show that a combination of tafenoquine and atovaquone achieves cure with no recrudescence in both models of human babesiosis. Interestingly, elimination of B. duncani infection in animals following drug treatment also confers immunity to subsequent challenge. Altogether, the data demonstrate superior efficacy of tafenoquine plus atovaquone combination over current therapies for the treatment of human babesiosis and highlight its potential in providing protective immunity against Babesia following parasite clearance.

Keywords: Babesia MO1; Babesia divergens; Babesia duncani; Babesia microti; Plasmodium falciparum; erythrocyte; human babesiosis; parasite; sterile immunity; tafenoquine.


Conflict of interest statement

Potential conflicts of interest. All authors: No reported conflicts of interest. All authors have submitted the ICMJE Form for Disclosure of Potential Conflicts of Interest. Conflicts that the editors consider relevant to the content of the manuscript have been disclosed.

Figures

Figure 1.
Figure 1.
Efficacy of tafenoquine and other quinoline-containing drugs against a select group of Babesia and Plasmodium falciparum parasites. A, The IC50 curves were generated by measuring the dose-response relationship of tafenoquine against Babesia (B. duncani WA-1 = 4 ± 0.4 µM, B. divergens = 2 ± 0.02 µM, and Babesia MO1 = 15 ± 4.2 µM) and P. falciparum (3D7 = 4 ± 0.09 µM, Dd2 = 1 ± 0.12 µM, and HB3 = 11 ± 0.4 µM) parasites, and used to estimate the IC50 concentration of each drug and for each species. The curves were generated using data obtained from 2 independent experiments, each with biological triplicates. The data represent mean ±SD. B, Scatter plot with symbols depicting the IC50 values in µM (y-axis) for the 6 quinoline drugs (x-axis) chloroquine, amodiaquine, quinine, primaquine, piperaquine, and tafenoquine tested against P. falciparum (3D7, Dd2, and HB3) and Babesia species (B. duncani, B. divergens, and Babesia MO1) in vitro. Each data point represents the average IC50 value of the drug against the depicted parasites. The data were obtained from 2 independent experiments with biological triplicates. C, The effect of tafenoquine and pyrimethamine on parasite growth and morphology was assessed over 3 intraerythrocytic life cycles. The pie charts illustrate the distribution of the four different stages of the parasite life cycle (tetrads, early rings, mature rings, and filamentous forms) for both untreated samples and those treated with IC50 concentrations of either tafenoquine or pyrimethamine. The number of parasites was determined at 0 hours and 62 hours post inoculation. Microscopic images of the predominant forms are shown along with their corresponding percentage abundance. Abbreviations: AQ, amodiaquine; CQ, chloroquine; IC50, half maximal inhibitory concentration; IEC, intraerythrocytic life cycle; PI, postinoculation; PM, primaquine; PQ, piperaquine; QN, quinine; TQ, tafenoquine.
Figure 2.
Figure 2.
In vivo efficacy of tafenoquine and atovaquone in the mouse model of Babesia duncani lethal infection. A–D, In vivo efficacy data for tafenoquine and atovaquone-treated C3H/HeJ mice (3 males + 3 females per group) infected with either 103 (low dose; Bd-LD) (A and C) or 106 (high dose; Bd-HD) (B and D) infected erythrocytes and dosed orally with each drug at 10 mg/kg daily for 5 days. C and D, Mouse survival curves following drug treatment of infected mice previously inoculated with a low dose (C) or a high dose (D) of B. duncani-infected erythrocytes. The Kaplan-Meier method was used to calculate survival rates. Vehicle-treated mice are represented with red lines; tafenoquine-treated mice with green lines, and atovaquone-treated mice with blue lines. † represents when animals were euthanized.
Figure 3.
Figure 3.
In vivo efficacy of tafenoquine and atovaquone in Babesia microti-infected SCID mice. A–D, In vivo efficacy data in B. microti-infected CB17-SCID mice following treatment with vehicle (PEG-400, red lines) alone or tafenoquine (green lines) or atovaquone (blue lines) dosed orally at a concentration of 10 mg/kg daily for 5 days. A and B, tafenoquine treatment in mice infected with 104 (low dose; Bm-LD) or 107 (high dose Bm-HD) inocula of B. microti-infected erythrocytes, respectively. C and D, atovaquone treatment in mice infected with 104 (Bm-LD) or 107 (Bm-HD) inocula of B. microti-infected erythrocytes, respectively. Each experimental group consisted of 6 mice (3 females and 3 males).
Figure 4.
Figure 4.
Efficacy of tafenoquine against atovaquone-resistant Babesia duncani parasites in vitro and in vivo. A, Amino acid sequence of a section of the B. duncani Cytb protein from drug-sensitive (ATVS, parent WA-1 isolate) and atovaquone-resistant (ATVR) parasites. The L117F (TTG to TTT) substitution is shown in red. B, Atovaquone and tafenoquine dose-response curves for atovaquone-resistant (ATVR, blue line) vs atovaquone-sensitive (ATVS, black line) parasites. The ATVR isolate is >7-fold resistant to atovaquone than ATVS (IC50 values 0.167 ± 0.0056 µM for ATVS and 1.197 ± 0.079 µM ATVR, respectively) but <2-fold with tafenoquine (IC50 values 5.21 ± 0.004 µM and 3.01 ± 0.009 µM for ATVS and ATVR parasites, respectively). In both cases, IC50 values were computed using a nonlinear regression curve from assays performed twice with biological triplicates. C, In vivo efficacy of tafenoquine in C3H/HeJ mice infected with 103 ATVS or ATVRB. duncani-infected erythrocytes. Groups of 4 females each were dosed orally with tafenoquine at 10 mg/kg once a day for 10 days. Red and green lines and markers depict parasitemia for mice infected with ATVS parasites and treated with vehicle (PEG-400) and tafenoquine, respectively. Brown and blue lines and markers correspond to vehicle and tafenoquine-treated mice infected with ATVR parasites, respectively. D, Percent survival of B. duncani ATVS- or ATVR-infected C3H/HeJ mice treated with either vehicle or tafenoquine. Line and marker colors are as in (C). Survival rates were calculated using the Kaplan-Meier method. Abbreviations: ATV, atovaquone; Bd, B. duncani; IC50, half maximal inhibitory concentration; TQ, tafenoquine.
Figure 5.
Figure 5.
Tafenoquine and atovaquone mediated ROS production and interaction in Babesia duncani-infected erythrocytes. A, Flow cytometry analysis and quantification of the relative amount of dihydrorhodamine 123 (DHR) converted to its fluorescent product by B. duncani parasites in the absence (UT) or presence of tafenoquine (TQ), artemisinin (ART), atovaquone (ATV), or pyrimethamine (PYM). B, Representative fluorescence images of human erythrocytes infected with B. duncani parasites showing intracellular conversion of DHR123 to rhodamine-123. Differential interference contrast (DIC) brightfield images highlight the parasite and red blood cell boundaries. Parasite DNA is stained with Hoechst and shown in blue, and rhodamine fluorescence is shown in red. Images were processed using ImageJ software. Scale bars represent 5 μm. C, B. duncani parasites cultured in vitro in human red blood cells were treated with various concentrations of each drug using the fixed ratio method. The isobologram represents the fractional inhibitory concentration (FIC) value for each combination as well as the overall ∑FIC approximately 1.04 of TQ and ATV. Each data point represents the average of 2 independent experiments with 3 technical triplicates each. (Error bars represent standard deviation).
Figure 6.
Figure 6.
Efficacy of tafenoquine + atovaquone combination against Babesia parasites in mice. A, In vivo efficacy of tafenoquine + atovaquone (daily oral dose of 10 + 10 mg/kg for 5 days) in C3H/HeJ mice infected with Babesia duncani at a low or a high inoculum (LD = 103; HD = 106). Groups of 6 mice (3 females and 3 males) were used in this study. B, Survival (%) of B. duncani-infected C3H/HeJ mice. Survival rates were calculated using the Kaplan-Meier method. C, In vivo efficacy of tafenoquine + atovaquone (daily oral dose of 10 + 10 mg/kg for 5 days) in SCID mice infected with Babesia microti at a low or a high inoculum (LD = 104; HD = 107). Groups of 6 mice (3 females and 3 males) were used in this study. Parasitemia (%) was calculated by microscopic analysis of Giemsa-stained blood smear samples collected at different times points following infection and treatment (a minimum of 3000 red blood cells were counted per blood smear). Colored lines and markers depict parasitemia for mice treated with tafenoquine + atovaquone in brown (HD) and blue (LD), and vehicle (PEG-400) treated control mice in red (HD) and black (LD).
Figure 7.
Figure 7.
Tafenoquine treatment confers sterile protection from Babesia duncani lethal infection. A, In vivo efficacy of TQ in mice infected with a high-dose (106) of B. duncani-infected erythrocytes in C3H/HeJ mice and subsequent protection from lethal challenge. Lines and markers in the treatment phase, left, depict parasitemia of mice treated with vehicle (red, n = 6) and TQ (green, n = 5). The purple lines and markers in the challenge phase depict the parasitemia of naive age-matched mice that received vehicle treatment (n = 6), while the green line and markers depict parasitemia for mice that cleared the first infection via TQ treatment and then received a repeated treatment upon challenge. B, Graphs representing the qPCR data plotted with the Cq values on days 6 and 28 after the initial infection and respective days following challenge of the vehicle (PEG-400) and TQ-treated mice and uninfected group with the color matched data points. A dotted red line represents the average cutoff Cq value. C, Survival curves for the mice in treatment groups described in (A). D, IgG titers measured in serum collected from C3H/HeJ mice before (prebleed) or after infection and either treated with vehicle alone or TQ. The graph displays the IgG titers at 1:500 serum dilutions (OD450) at days 6, 14, and 28 dpi and dpc, as well as prebleed (3 days before infection), vehicle 1 (6 dpi), and vehicle 2 (naive mice at 6 dpc) sera. Abbreviations: Bd-HD, B. duncani high dose; Cq, quantification cycle; dpc, days postchallenge; dpi, days postinfection; LOD, limit of detection; OD, optical density; qPCR, quantitative polymerase chain reaction; TQ, tafenoquine; UI, uninfected; NTC, no template control. † represents when animals were euthanized.

Similar articles

Cited by

References

    1. Kjemtrup AM, Conrad PA. Human babesiosis: an emerging tick-borne disease. Int J Parasitol 2000; 30:1323–37. - PubMed
    1. Krause PJ. Human babesiosis. Int J Parasitol 2019; 49:165–74. - PubMed
    1. Arsuaga M, Gonzalez LM, Padial ES, et al. . Misdiagnosis of babesiosis as malaria, Equatorial Guinea, 2014. Emerg Infect Dis 2018; 24:1588–9. - PMC - PubMed
    1. Krause PJ, Daily J, Telford SR, Vannier E, Lantos P, Spielman A. Shared features in the pathobiology of babesiosis and malaria. Trends Parasitol 2007; 23:605–10. - PubMed
    1. Swanson M, Pickrel A, Williamson J, Montgomery S. Trends in reported babesiosis cases—United States, 2011–2019. MMWR Morb Mortal Wkly Rep 2023; 72:273–7. - PMC - PubMed

Publication types