. 2024 Aug 16;230(2):e268-e278.
doi: 10.1093/infdis/jiad606.

The Ability of a 3-Gene Host Signature in Blood to Distinguish Tuberculous Meningitis From Other Brain Infections

Affiliations

The Ability of a 3-Gene Host Signature in Blood to Distinguish Tuberculous Meningitis From Other Brain Infections

Julie Huynh et al. J Infect Dis. .

Abstract

Background: Tuberculous meningitis (TBM) is difficult to diagnose. We investigated whether a 3-gene host response signature in blood can distinguish TBM from other brain infections.

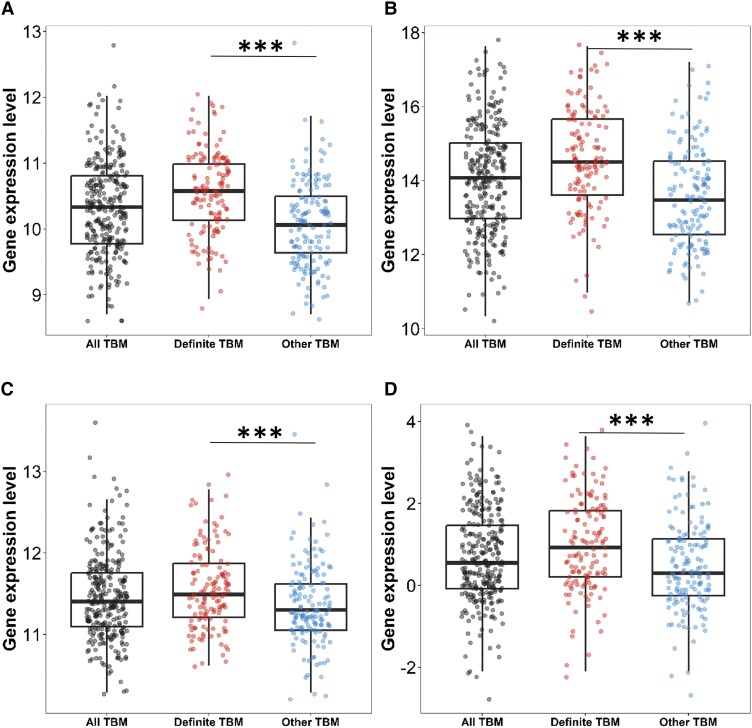
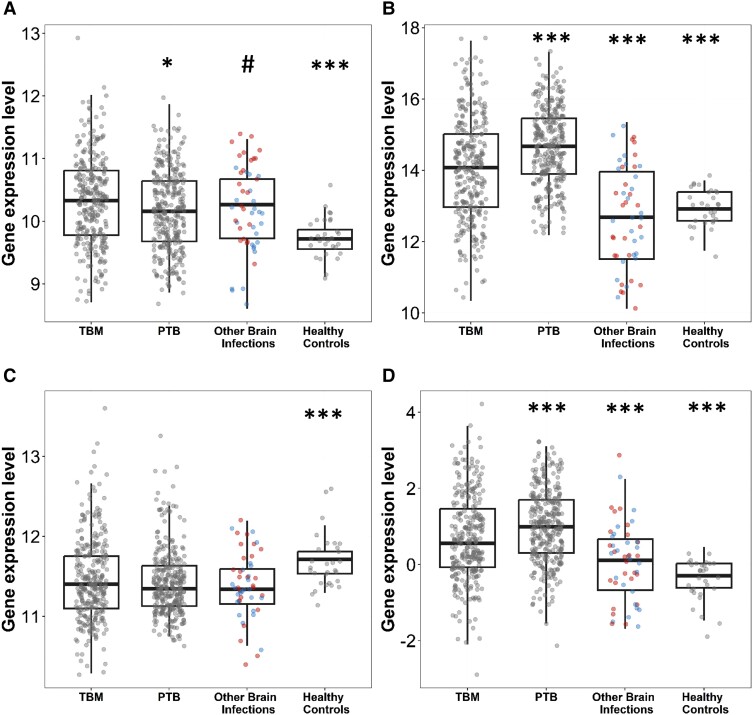
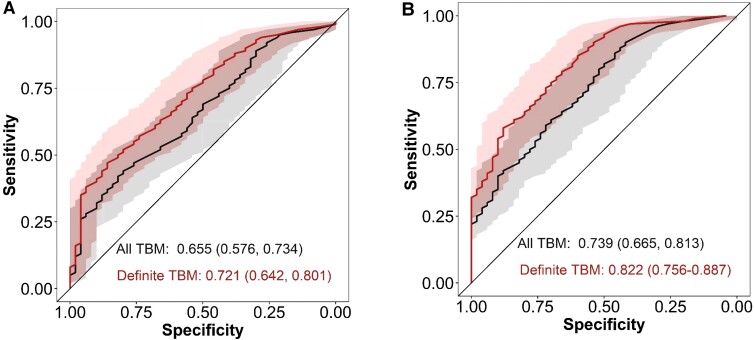
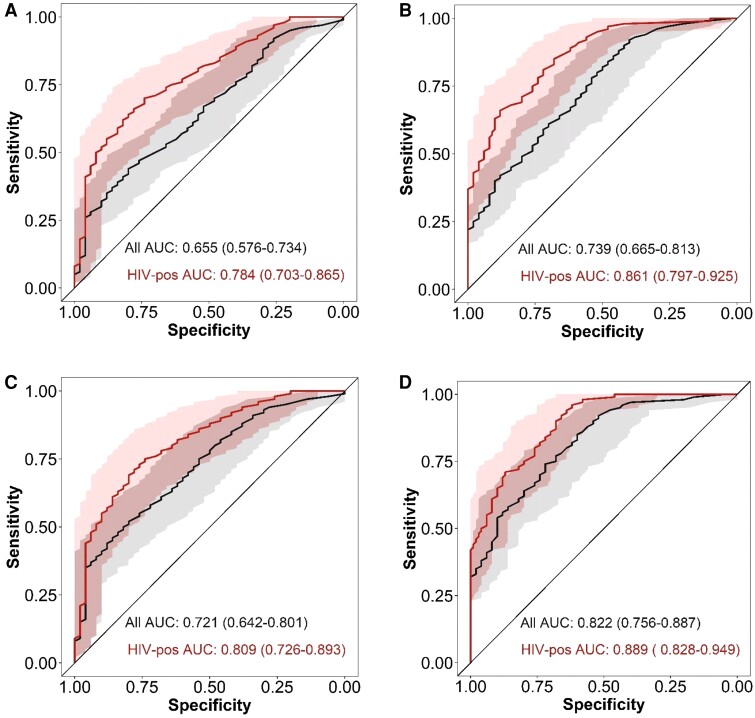
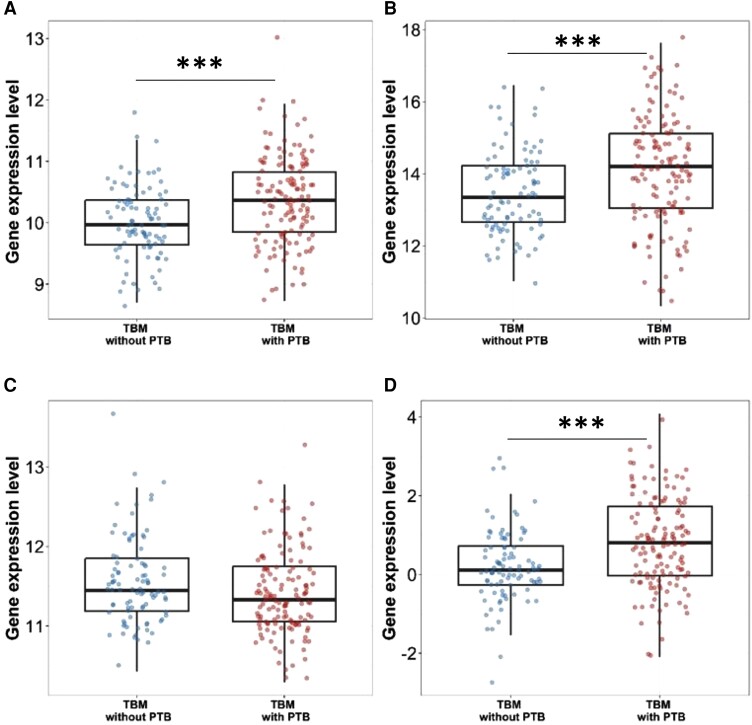
Methods: The expression of 3 genes (dual specificity phosphatase 3 [DUSP3], guanylate-binding protein [GBP5], krupple-like factor 2 [KLF2]) was analyzed by RNA sequencing of archived whole blood from 4 cohorts of Vietnamese adults: 281 with TBM, 279 with pulmonary tuberculosis, 50 with other brain infections, and 30 healthy controls. Tuberculosis scores (combined 3-gene expression) were calculated following published methodology and discriminatory performance compared using area under a receiver operator characteristic curve (AUC).

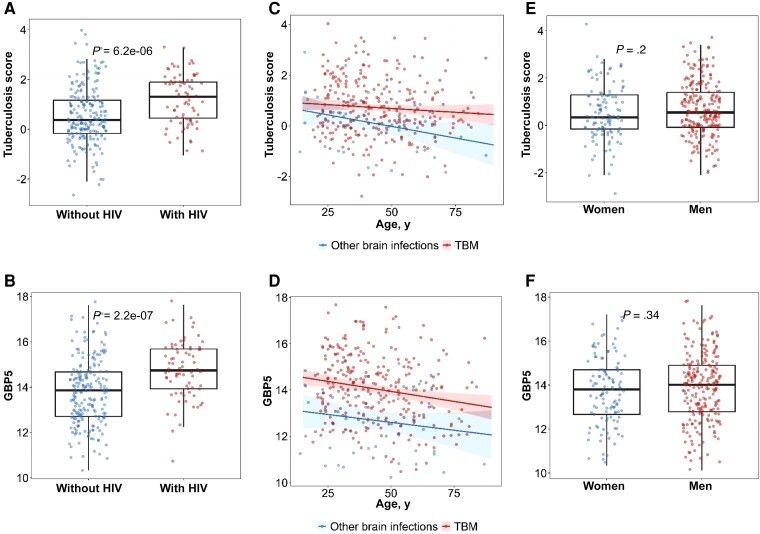
Results: GBP5 was upregulated in TBM compared to other brain infections (P < .001), with no difference in DUSP3 and KLF2 expression. The diagnostic performance of GBP5 alone (AUC, 0.74; 95% confidence interval [CI], .67-.81) was slightly better than the 3-gene tuberculosis score (AUC, 0.66; 95% CI, .58-.73) in TBM. Both GBP5 expression and tuberculosis score were higher in participants with human immunodeficiency virus (HIV; P < .001), with good diagnostic performance of GBP5 alone (AUC, 0.86; 95% CI, .80-.93).

Conclusions: The 3-gene host signature in whole blood has the ability to discriminate TBM from other brain infections, including in individuals with HIV. Validation in large prospective diagnostic study is now required.

Keywords: 3-gene host response; HIV coinfection; brain infections; diagnosis; tuberculous meningitis.


Conflict of interest statement

Potential conflicts of interest. All authors: No reported conflicts. All authors have submitted the ICMJE Form for Disclosure of Potential Conflicts of Interest. Conflicts that the editors consider relevant to the content of the manuscript have been disclosed.

Figures

Figure 1.
Figure 1.
Three-gene expression and tuberculosis score in all tuberculous meningitis (TBM), definite TBM, and other TBM. All TBM comprises of definite, probable, and possible whilst other TBM comprises of probable and possible. A, DUSP3, (B) GBP5, (C) KLF2, and (D) tuberculosis score. Comparisons of gene expression in all TBM (n = 281, black dots), definite TBM, and other TBM group (n = 147, blue dots). Boxes indicate interquartile range, the line indicates the median, and dots indicate data in individuals. Whiskers extend 1.5 times the interquartile range from the 25th and 75th percentiles. Comparisons between definite TBM versus other TBM were performed using Mann-Whitney U test. ***P < .001.
Figure 2.
Figure 2.
Three-gene expression and tuberculosis score in tuberculous meningitis (TBM) compared to other groups: (A) DUSP3, (B) GBP5, (C) KLF2, and (D) tuberculosis score. Comparisons of gene expression in TBM (n = 281) and other groups: pulmonary tuberculosis (PTB; n = 296), other brain infections (n = 50), and healthy controls (n = 30). Other brain infections were classified as bacterial (n = 25, red dots) or viral infection (n = 25, blue dots). Boxes indicate interquartile range, the line indicates the median, and dots indicate data in individuals. Whiskers extend 1.5 times the interquartile range from the 25th and 75th percentiles. Comparisons between TBM versus PTB, TBM versus other brain infections, TBM versus healthy control, and bacterial infection versus viral infection were performed using Mann-Whitney U test. Unadjusted multiple testing was performed for exploratory analysis with *P < .05, ***P < .001. Difference in DUSP3 expression between bacterial versus viral infections, #P = .008.
Figure 3.
Figure 3.
Diagnostic performance of tuberculosis score and GBP5 in tuberculous meningitis (TBM) and definite TBM. Receiver operating characteristics (ROC) curves for distinguishing all TBM (n = 281) and definite TBM (n = 134) against other central nervous system infections (n = 50) using 3-gene tuberculosis scores (A) or GBP5 (B). Shaded areas depict the 95% confidence intervals with values in parentheses.
Figure 4.
Figure 4.
Association of human immunodeficiency virus (HIV) status, gender, and age with tuberculosis score and GBP5 gene expression. Each point represents individual data. A, Distribution of tuberculosis score expression between people with HIV (n = 207) and people without HIV (n = 74) in tuberculous meningitis (TBM) patients. B, Distribution of GPB5 expression between people with and without HIV. C, Regression line and shaded 95% confident interval band modeling linear trend between tuberculosis score and age. The red line corresponds to TBM patients (n = 281) and the blue line corresponds to other brain infections (n = 50). D, Regression line and shaded 95% confident interval band modeling linear trend between GBP5 and age. E, Distribution of tuberculosis score between women (n = 115) and men (n = 216). Boxes indicate interquartile range and the line indicates the median. Whiskers extend 1.5 times the interquartile range from the 25th and 75th percentiles. Comparisons were performed using Mann-Whitney U test. F, Distribution of GBP5 expression between women and men.
Figure 5.
Figure 5.
Diagnostic performance of tuberculosis score and GBP5 stratified by HIV status. ROC curves for distinguishing TBM and other brain infections using tuberculosis scores (A) or GBP5 (B). ROC curves for distinguishing definite TBM and other brain infections using tuberculosis scores (C) or GBP5 (D). Black lines are all participants in each comparison, red lines are participants with HIV only. Shaded areas depict the 95% confidence interval with values in parenthese. Abbreviations: AUC, area under the curve; HIV, human immunodeficiency virus; ROC, receiver operating characteristic; TBM, tuberculous meningitis.
Figure 6.
Figure 6.
Gene expression and tuberculosis score in tuberculous meningitis (TBM) and TBM with pulmonary tuberculosis (PTB): (A) DUSP 3, (B) GBP5, (C) KLF2, and (D) tuberculosis score. Comparisons of gene expression in TBM without PTB (n = 92, blue dots) and TBM with PTB (n = 134, red dots). Boxes indicate interquartile range, horizontal lines the median, and dots indicate individual patient data. Whiskers extend 1.5 times the interquartile range from the 25th and 75th percentiles. Comparisons were performed using Mann-Whitney U test. ***P < .001.

References

    1. World Health Organization . Global tuberculosis report 2022. Geneva, Switzerland: WHO, 2022.
    1. Seddon JA, Tugume L, Solomons R, Prasad K, Bahr NC. Tuberculous meningitis international research consortium. The current global situation for tuberculous meningitis: epidemiology, diagnostics, treatment and outcomes. Wellcome Open Res 2019; 4:167. - PMC - PubMed
    1. Chiang S, Khan F, Milstein M, et al. . Treatment outcomes of childhood tuberculous meningitis: a systematic review and meta-analysis. Lancet Infect Dis 2014; 14:947–57. - PubMed
    1. Stadelman AM, Ellis J, Samuels THA, et al. . Treatment outcomes in adult tuberculous meningitis: a systematic review and meta-analysis. Open Forum Infect Dis 2020; 7:ofaa257. - PMC - PubMed
    1. Thwaites GE, Tran TH. Tuberculous meningitis: many questions, too few answers. Lancet Neurol 2005; 4:160–70. - PubMed