

Changes in the composition of the fecal metabolome and gut microbiota contribute to intervertebral disk degeneration in a rabbit model
- PMID: 38169417
- PMCID: PMC10762942
- DOI: 10.1186/s13018-023-04486-x
Changes in the composition of the fecal metabolome and gut microbiota contribute to intervertebral disk degeneration in a rabbit model
Abstract
Purpose: Lower back pain (LBP), mainly caused by intervertebral disk (IVD) degeneration (IDD), is widely prevalent worldwide and is a serious socioeconomic burden. Numerous factors may trigger this degenerative process, and microbial dysbiosis has recently been implicated as one of the likely causes. However, the exact relationship between IDD and the microbiome remains obscure. In this study, we investigated the gut microbiota composition and fecal metabolic phenotype and discussed the possible influences of microbiome dysbiosis on IDD.
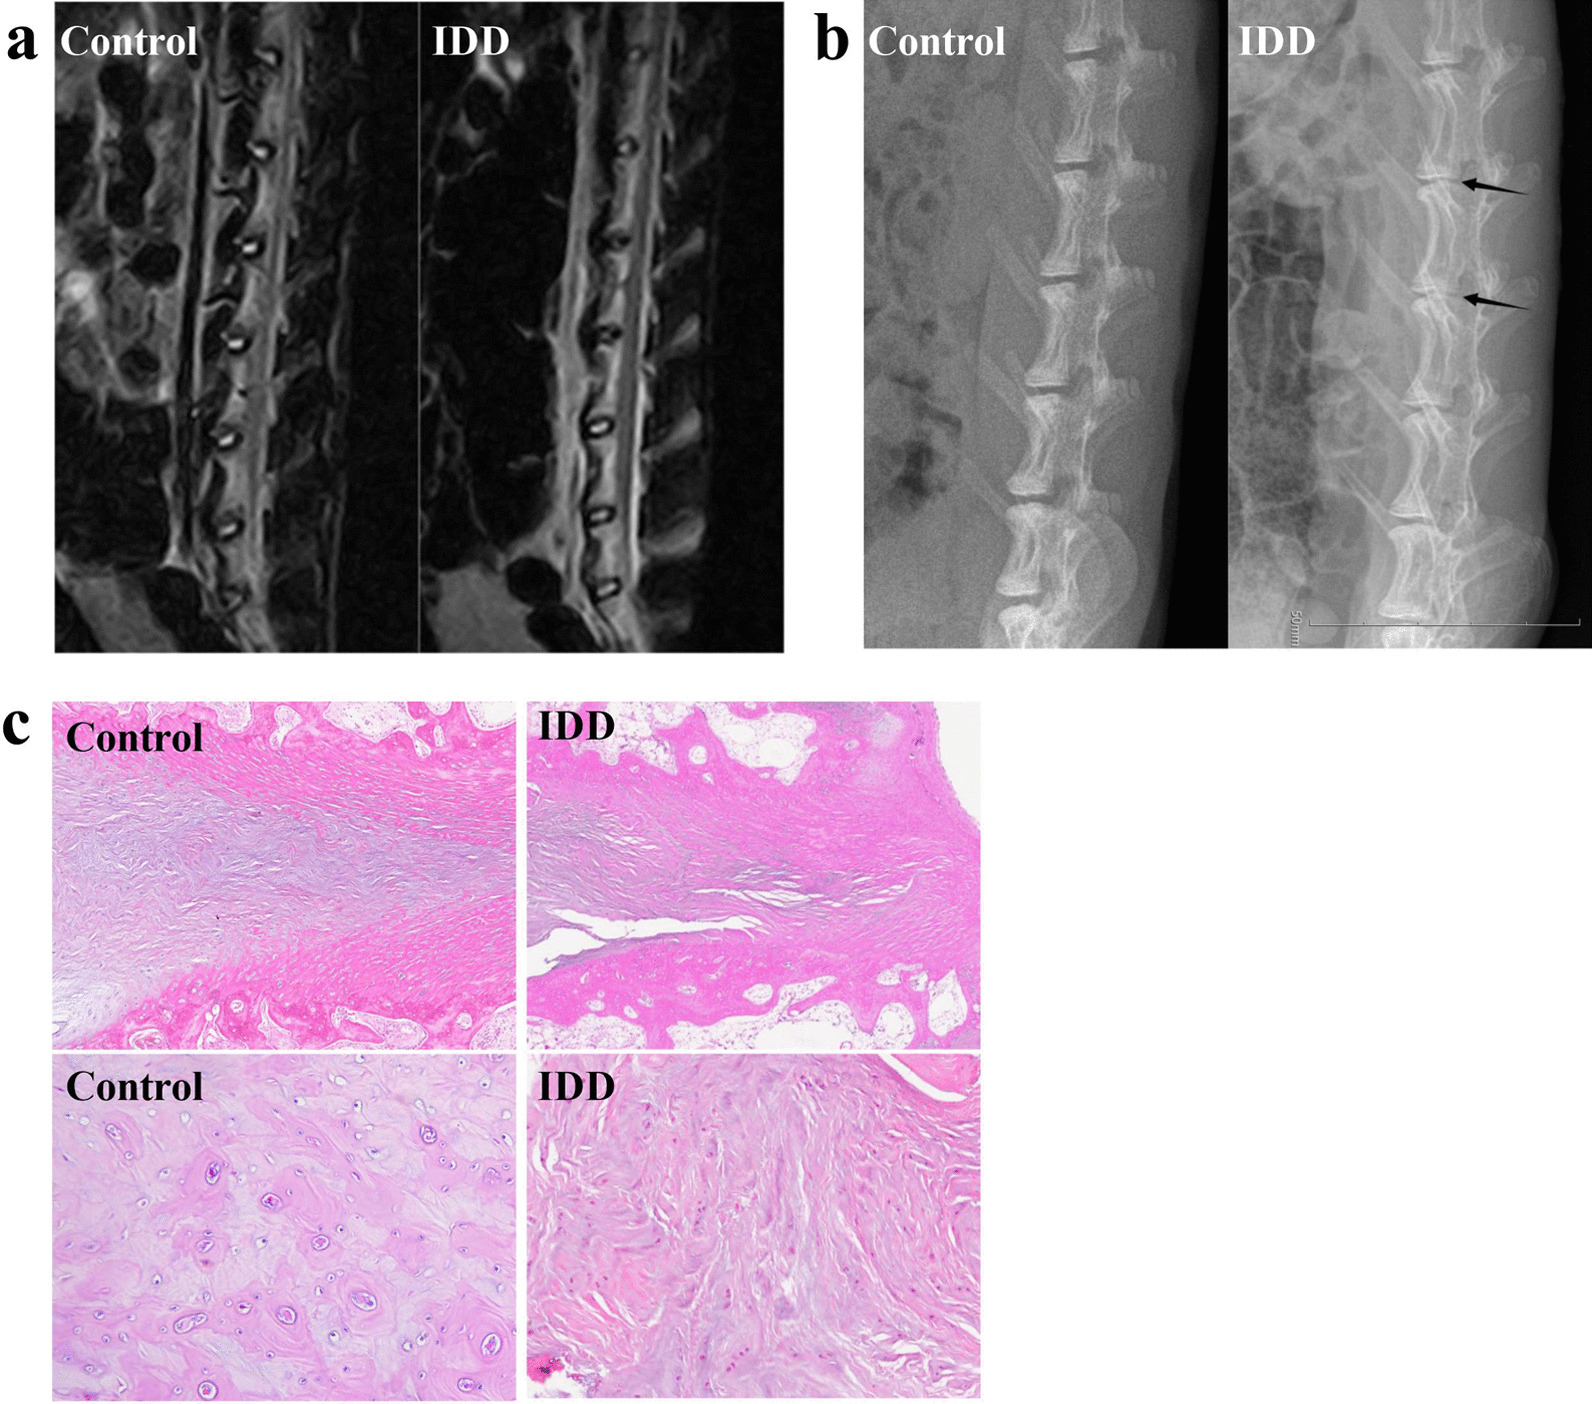
Methods: Fecal DNA was extracted from 16 fecal samples (eight rabbit models with IDD and eight sex- and age-matched healthy controls) and analyzed by high-throughput 16S rDNA sequencing. The fecal samples were also analyzed by liquid chromatography-mass spectrometry-based metabolomics. Multivariate analyses were conducted for the relationship between the omics data and IDD, linear discriminant analysis effect size was employed for biomarker discovery. Moreover, the Kyoto Encyclopedia of Genes and Genomes (KEGG) database was used to annotate the differential metabolites. The potential correlation between differential gut microbiota and metabolites was then assessed.
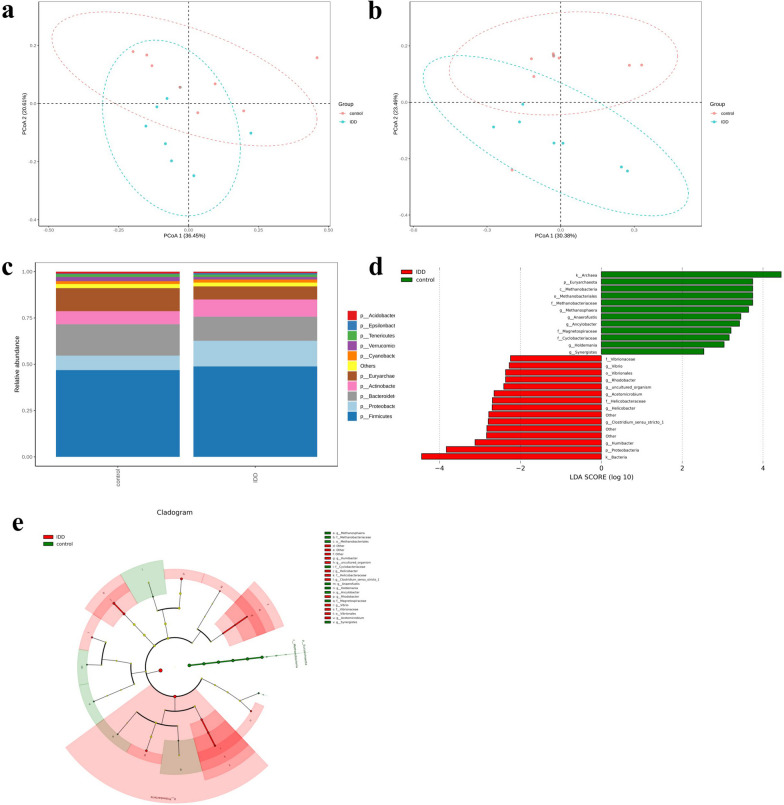
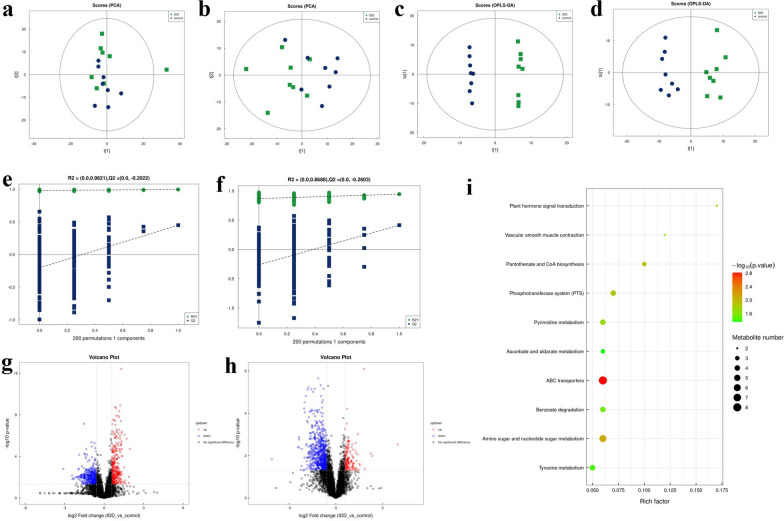
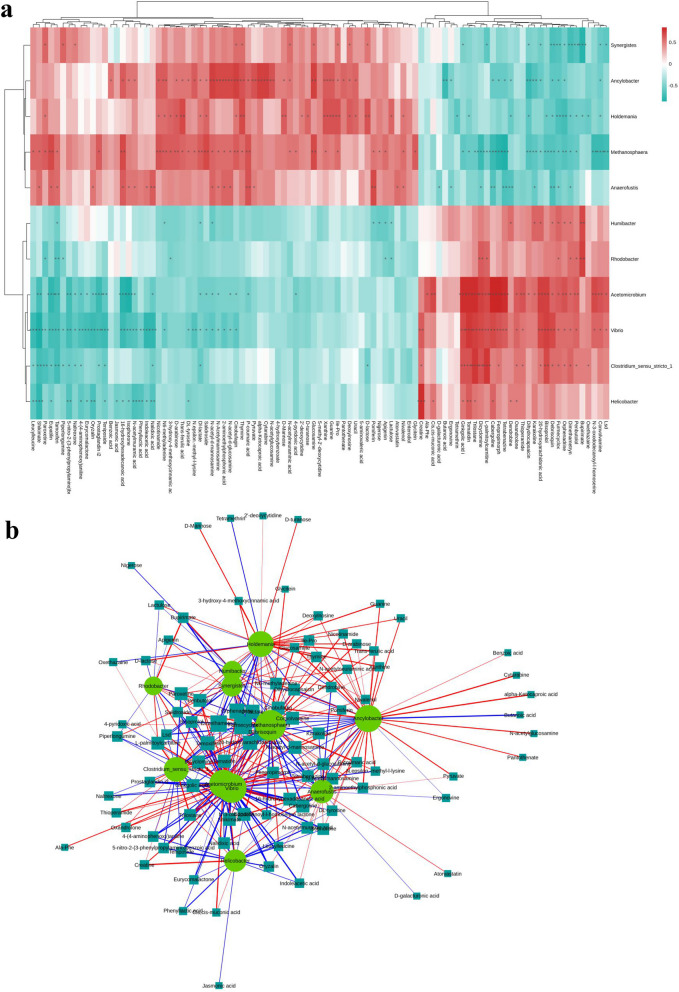
Results: The 16S rDNA sequencing results showed that the β-diversity of the gut microbiota was significantly different between the IDD and control groups, with distinct abundance levels of dominant genera. Moreover, 59 metabolites were significantly upregulated and 91 were downregulated in IDD rabbits versus the controls. The KEGG enrichment analysis revealed that the top pathways remarkably impacted by IDD were tyrosine metabolism, amino sugar and nucleotide sugar metabolism, benzoate degradation, ABC transporters, ascorbate and aldarate metabolism, pantothenate and CoA biosynthesis, and pyrimidine metabolism. The correlation analysis revealed that DL-tyrosine and N-acetylmuramic acid were associated with multiple differential bacterial genera, including Helicobacter and Vibrio, which may play important roles in the process of IVD degeneration.
Conclusion: Our findings revealed that IDD altered gut microbiota and fecal metabolites in a rabbit model. The correlation analysis of microbiota and metabolome provides a deeper understanding of IDD and its possible etiopathogenesis. These results also provide a direction and theoretical basis for the clinical application of fecal transplantation, probiotics, and other methods to regulate gut microbiota in the treatment of LBP caused by IDD.
Keywords: Fecal metabolomics; Gut microbiota; Intervertebral disk degeneration; Lower back pain.
© 2023. The Author(s).
Conflict of interest statement
None declared.
Figures
Similar articles
-
A new target for treating intervertebral disk degeneration: gut microbes.Front Microbiol. 2024 Nov 29;15:1452774. doi: 10.3389/fmicb.2024.1452774. eCollection 2024. Front Microbiol. 2024. PMID: 39678913 Free PMC article. Review.
-
Gut-disc axis: A cause of intervertebral disc degeneration and low back pain?Eur Spine J. 2022 Apr;31(4):917-925. doi: 10.1007/s00586-022-07152-8. Epub 2022 Mar 14. Eur Spine J. 2022. PMID: 35286474 Review.
-
Fecal and serum metabolomic signatures and gut microbiota characteristics of allergic rhinitis mice model.Front Cell Infect Microbiol. 2023 Apr 25;13:1150043. doi: 10.3389/fcimb.2023.1150043. eCollection 2023. Front Cell Infect Microbiol. 2023. PMID: 37180443 Free PMC article.
-
Altered Fecal Microbiome and Correlations of the Metabolome with Plasma Metabolites in Dairy Cows with Left Displaced Abomasum.Microbiol Spectr. 2022 Dec 21;10(6):e0197222. doi: 10.1128/spectrum.01972-22. Epub 2022 Oct 12. Microbiol Spectr. 2022. PMID: 36222683 Free PMC article.
-
The Effect of Gut Microbiota on the Progression of Intervertebral Disc Degeneration.Orthop Surg. 2023 Mar;15(3):858-867. doi: 10.1111/os.13626. Epub 2023 Jan 4. Orthop Surg. 2023. PMID: 36600636 Free PMC article.
Cited by
-
A new target for treating intervertebral disk degeneration: gut microbes.Front Microbiol. 2024 Nov 29;15:1452774. doi: 10.3389/fmicb.2024.1452774. eCollection 2024. Front Microbiol. 2024. PMID: 39678913 Free PMC article. Review.
-
Crosstalk Among Gut Microbiota, Fecal Metabolites, and Amygdala Neuropathology Genes After Ginger Polyphenol Administration in Female Rats with Neuropathic Pain: Evidence for Microbiota-Gut-Brain Connection.Nutrients. 2025 Apr 25;17(9):1444. doi: 10.3390/nu17091444. Nutrients. 2025. PMID: 40362753 Free PMC article.
-
Exploring the role of gut microbiota in intervertebral disc degeneration: insights from bidirectional Mendelian randomization analysis.Eur Spine J. 2025 Jun;34(6):2092-2105. doi: 10.1007/s00586-025-08794-0. Epub 2025 Apr 21. Eur Spine J. 2025. PMID: 40257470
References
-
- Fakhoury J, Dowling TJ. Cervical degenerative disc disease. Treasure Island, FL: StatPearls Publishing; 2022. - PubMed
Publication types
MeSH terms
Substances
LinkOut - more resources
Full Text Sources
Miscellaneous
