. 2024 Jan 1;14(2):460-479.
doi: 10.7150/thno.87329. eCollection 2024.

Differential effect of cancer-associated fibroblast-derived extracellular vesicles on cisplatin resistance in oral squamous cell carcinoma via miR-876-3p

Affiliations

Differential effect of cancer-associated fibroblast-derived extracellular vesicles on cisplatin resistance in oral squamous cell carcinoma via miR-876-3p

Soo Hyun Kang et al. Theranostics. .

Abstract

Rationale: Platinum-based chemotherapy is commonly used for treating solid tumors, but drug resistance often limits its effectiveness. Cancer-associated fibroblast (CAF)-derived extracellular vesicle (EV), which carry various miRNAs, have been implicated in chemotherapy resistance. However, the molecular mechanism through which CAFs modulate cisplatin resistance in oral squamous cell carcinoma (OSCC) is not well understood. We employed two distinct primary CAF types with differential impacts on cancer progression: CAF-P, representing a more aggressive cancer-promoting category, and CAF-D, characterized by properties that moderately delay cancer progression. Consequently, we sought to investigate whether the two CAF types differentially affect cisplatin sensitivity and the underlying molecular mechanism. Methods: The secretion profile was examined by utilizing an antibody microarray with conditioned medium obtained from the co-culture of OSCC cells and two types of primary CAFs. The effect of CAF-dependent factors on cisplatin resistance was investigated by utilizing conditioned media (CM) and extracellular vesicle (EVs) derived from CAFs. The impacts of candidate genes were confirmed using gain- and loss-of-function analyses in spheroids and organoids, and a mouse xenograft. Lastly, we compared the expression pattern of the candidate genes in tissues from OSCC patients exhibiting different responses to cisplatin. Results: When OSCC cells were cultured with conditioned media (CM) from the two different CAF groups, cisplatin resistance increased only under CAF-P CM. OSCC cells specifically expressed insulin-like growth factor binding protein 3 (IGFBP3) after co-culture with CAF-D. Meanwhile, IGFBP3-knockdown OSCC cells acquired cisplatin resistance in CAF-D CM. IGFBP3 expression was promoted by GATA-binding protein 1 (GATA1), a transcription factor targeted by miR-876-3p, which was enriched only in CAF-P-derived EV. Treatment with CAF-P EV carrying miR-876-3p antagomir decreased cisplatin resistance compared to control miRNA-carrying CAF-P EV. On comparing the staining intensity between cisplatin-sensitive and -insensitive tissues from OSCC patients, there was a positive correlation between IGFBP3 and GATA1 expression and cisplatin sensitivity in OSCC tissues from patients. Conclusion: These results provide insights for overcoming cisplatin resistance, especially concerning EVs within the tumor microenvironment. Furthermore, it is anticipated that the expression levels of GATA1 and miR-876-3p, along with IGFBP3, could aid in the prediction of cisplatin resistance.

Keywords: cancer-associated fibroblasts; cisplatin resistance; extracellular vesicles; hsa-miR-876-3p; insulin-like growth factor binding protein 3.


Conflict of interest statement

Competing Interests: The authors have declared that no competing interest exists.

Figures

Figure 1
Figure 1
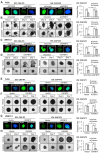
Effect of CAF-P or CAF-D CM on cisplatin efficacy in OSCC cells. (A) Primary fibroblasts were seeded in 6well plates containing cover slides and were immunostained with antibodies specific for fibroblasts (α-SMA), endothelial (CD31), and epithelial (pan-CK) cells. (B) After culturing OSCC cells in 96 well plates, the medium was changed with CM from CAF-D or CAF-P cells. After 16 h, cisplatin was treated for another 24 h, followed by MTT analysis. CMs from FaDu or UMSCC1 was used as controls. The spheroid formation with FaDu (C) and UMSCC1 (D) was observed in 96 well U-bottom ultra-low attachment plate for two days, followed by medium change with each CM. After cisplatin treatment for 14 days, spheroids were imaged using phase-contrast microscopy, and the size (surface area) was measured via Cell3iMager. Each experimental group consisted of eight spheroids, and a representative image is shown. The reduction of spheroid size is indicated by the relative percentage of size with cisplatin treatment compared with the size of vehicle treatment for 14 days. Results were presented as the mean ± standard deviation of three experiments. *p < 0.05; **p < 0.01. Scale bars: A 100 μm; C-D 500 μm.
Figure 2
Figure 2
Secretome antibody array in FaDu-CAF-P CM vs. FaDu-CAF-D CM. (A) Antibody microarray with each CM was performed using a Cytokine profiling antibody array with six replicates per antibody. (B) Heatmap of differentially abundant factors in the secretome among the matched groups (fold change of > 2 and p-value of < 0.05). Array results of each CM derived from FaDu-CAF-P or FaDu-CAF-D were normalized to the FaDu-FaDu CM. (C-D) After co-culture of FaDu and UMSCC1 with each CAF-P and CAF-D cell, at the same condition presented in A, OSCC spheroids and CAF cells were collected from bottom well and Transwell, respectively. mRNA and protein expression of IGFBP3 were compared using qPCR and western blot analysis. Results represent the mean ± standard deviation of three experiments. *p < 0.05; **p < 0.01; ***p < 0.005.
Figure 3
Figure 3
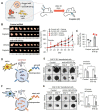
Effect of IGFBP3 on the cisplatin sensitivity in CMs from CAF-D or CAF-P. (A) FaDu and UMSCC1 spheroids were formed for two days. After transfection with siIGFBP3 for 24 h, the medium was replaced with CAF-D CM. After 16 h, cisplatin was added for another 14 days. (B) After transfection with a pCMV3-ORF-IGFBP3 vector in spheroids for 24 h, the medium was replaced with each CM. After 16 h, cisplatin was added for another 14 days. The pCMV3 vector was used as a control. Spheroids were imaged via phase-contrast microscopy, and the size (surface area) was measured with Cell3iMager. Each experimental group comprises eight spheroids, and a representative image is given. Results were presented as the mean ± standard deviation of three experiments. (C) FaDu spheroids (< 400 μm in diameter) were prepared in 96 well plates. Overall, 50 FaDu spheroids (approximately 5 × 10⁵ cells) transfected with the overexpression vector were co-injected with the same number of CAF-P cells into the right and left backs of mice. After 20 days, cisplatin (2.5 mg/kg) or DMSO (0.1% v/v in PBS) vehicle control was intraperitoneally injected 2 times a week and sacrificed on the 19th day after cisplatin administration. Tumor volume was measured using a caliper till sacrifice. The reduction of tumor burden represents the percentage of xenograft size reduction under cisplatin treatment compared with that under the vehicle-treated control vector or IGFBP3-overexpressed group. *p < 0.05; **p < 0.01. Scale bars: A-B 500 μm.
Figure 4
Figure 4
Effect of CAF-derived EV on cisplatin resistance. (A) Characterization of EV derived from CAF-P and CAF-D cells was performed via NTA. TEM images of EV revealed round-shaped vesicles. The mean size of EV and concentrations were presented. (B) EVs were pre-stained with lipid tracer dye DiD (red), followed by incubation with cells for 24 h at 37 °C. Confocal microscopy was used to detect EV internalization into cells. The white arrows indicate EV internalized into cells. (C) EVs (1 ͯ 107 particles/mL, MOI = 100) were incubated with cells for 24 h, followed by cisplatin treatment for another 24 h. MTT assay was performed to compare cell viability. (D) OSCC organoids derived from mouse xenografts formed with FaDu or UMSCC1 cells were stained with an antibody against KRT13, a representative squamous epithelial cell marker. (E) EVs (MOI = 100) were incubated with organoids in 24 well plate for 16 h, followed by cisplatin treatment for another seven days. The organoid size was monitored using a Nikon ECLIPSE Ti microscope. Each experimental group consisted of approximately five organoids per 24 well plate, and a representative image is presented. Results represent the mean ± standard deviation of 2-3 experiments. *p < 0.05; **p < 0.01. Scale bars: D-E 100 μm.
Figure 5
Figure 5
Effect of CAF-derived EV on IGFBP3-dependent cisplatin sensitivity in OSCC organoids. (A, C) Organoids derived from FaDu or UMSCC1 xenografts were transfected with siIGFBP3 for 24 h, followed by CAF-D EV treatments (MOI = 100) for another 16 h. After seven days of cisplatin treatment, IGFBP3 protein expression was compared via IF staining. (B, D) The organoid size was monitored at the same condition using a Nikon ECLIPSE Ti microscope. (E, G) Organoids were transfected with an IGFBP3 overexpression vector for 24 h, followed by CAF-P EV treatments (MOI = 100) for another 16 h. After seven days of cisplatin treatment, IGFBP3 protein expression was compared via IF staining. (F, H) The organoid size was monitored at the same condition. Results were presented as the mean ± standard deviation of three independent experiments. *p < 0.05; **p < 0.01. Scale bars: A-H 100 μm.
Figure 6
Figure 6
CAF-P EV-dependent decrease of IGFBP3 via GATA1 downregulation. (A) mRNA and protein expression of IGFBP3 and GATA1 was evaluated following treatment with EV (MOI = 100) from CAF-P or CAF-D in OSCC cells for two days. (B) Schematic presentation of promoter regions for the IGFBP3 gene showing the consensus GATA1 binding sites, as determined via ChIP analysis (black arrowheads). (C) The chromatin of FaDu cells was immunoprecipitated using a GATA1 antibody, and the resulting immunoprecipitants were analyzed using PCR to detect the consensus sequence of the IGFBP3 promoter. PCR products were compared using gel electrophoresis, and a representative image is shown. Input and IgG were used as controls. (D) Luciferase activity was measured in OSCC cells pretreated with EV from two different CAF-Ps (1, 2) or CAF-Ds (1, 2) for 16 h, followed by transfection with each target plasmid. After 24 h, a dual luciferase assay was performed. (E) Organoids derived from OSCC xenografts were transfected with siGATA1 for 24 h, followed by two different CAF-D EV treatment (MOI = 100) for another 16 h. After seven days of cisplatin treatment, the organoid size was monitored using a Nikon ECLIPSE Ti microscope. Results were presented as the mean ± standard deviation of three experiments. *p < 0.05; **p < 0.01. Scale bars: E 100 μm.
Figure 7
Figure 7
Effect of hsa-miR-876-3p derived from CAF-P EV on cisplatin sensitivity. (A-B) hsa-miR-876-3p mRNA level in OSCC cells, CAFs, and EVs, were compared. (C) Predicted miRNA binding site within the 3′-UTR of GATA1 mRNA is shown. Mutations in the GATA1 3′-UTR are shown in red. Luciferase reporter constructs were generated with the wild-type (WT) and mutant (MT) 3′-UTRs of GATA1. (D) Dual luciferase reporter activity demonstrating the target relationship between miR-876-3p and GATA1 mRNA. The activity was normalized to that of Renilla luciferase. The activity was measured in FaDu and UMSCC1 cells transfected with the WT and MT 3′-UTR GATA1 luciferase constructs. (E) OSCC cells were transfected with anti-miR-876-3p and treated with CAF-P EV (1 ͯ 107 particles/mL, MOI = 100) for 24 h. mRNA and protein expression of IGFBP3 and GATA1 in OSCC cells was analyzed via qPCR and western blot analysis. (F) FaDu organoids were transfected with anti-miR-876-3p and treated with CAF-P EV for 24 h, followed by cisplatin treatment for another seven days. (G) OSCC cells were transfected with mimic miR-876-3p and treated with CAF-D EV (1 ͯ 107 particles/mL, MOI = 100) for 24 h. mRNA and protein expression of IGFBP3 and GATA1 in OSCC cells was analyzed via qPCR and western blot analysis. (H) FaDu organoids were transfected with mimic miR-876-3p and treated with CAF-D EV for 24 h, followed by cisplatin treatment for another seven days. The organoid size was monitored using a Nikon ECLIPSE Ti microscope. Results were presented as the mean ± standard deviation of three experiments. * p < 0.05; **p < 0.01. Scale bars: F, H 100 μm.
Figure 8
Figure 8
Effect of antagomir or mimic miRNA for miR-876-3p on cisplatin sensitivity in OSCC. (A) FaDu spheroids (< 300 μm in diameter) were prepared in 96 well plates, and transfected with anti-miR-876-3p for 16 h. Overall, 50 spheroids (approximately 5×10⁵ cells) were co-injected with the same number of CAF-P cells into the right and left backs of mice. After 20 days, cisplatin (2.5 mg/kg) or DMSO (0.1% v/v in PBS) vehicle control was intraperitoneally injected 2 times a week and sacrificed on the 19th day after cisplatin administration. (B) Tumor volume was measured using a caliper till sacrifice. (C) The reduction of tumor burden represents the percentage of xenograft size reduction under cisplatin treatment compared with that under the control miRNA-transfected or anti-miR-876-3p-transfected group. (D) CAF-P-derived EVs were loaded with anti-miR-876-3p via electroporation, followed by RNase treatment and re-purification. (E) CAF-P EVs carrying anti-miR-876-3p were transfected in organoids (MOI = 100) for 16 h, followed by cisplatin treatment for seven days. (F) CAF-D-derived EVs were loaded with mimic miR-876-3p via electroporation, followed by RNase treatment and re-purification. (G) These EVs were treated in organoids (MOI = 100) for 16 h, followed by cisplatin treatment for seven days. The organoid size was monitored using a Nikon ECLIPSE Ti microscope. Results were presented as the mean ± standard deviation of three independent experiments. *p < 0.05; **p < 0.01. Scale bars: E, G 100 μm.
Figure 9
Figure 9
IHC analysis of OSCC tissues form patients. Tissues from patients with OSCC showing (A) cisplatin-sensitive and (B) cisplatin-insensitive tissues were stained with anti-IGFBP3 and anti-GATA1 antibodies. (C) The level of IGFBP3 on each specimen was scored as 0, 1, 2, and 3 (0 = negative, 1 = weak, 2 = intermediate, and 3 = strong) according to its staining intensity. *p < 0.05.

References

    1. Bugshan A, Farooq I. Oral squamous cell carcinoma: metastasis, potentially associated malignant disorders, etiology and recent advancements in diagnosis. F1000Res. 2020;9:229–33. - PMC - PubMed
    1. Leemans CR, Braakhuis BJ, Brakenhoff RH. The molecular biology of head and neck cancer. Nat Rev Cancer. 2011;11:9–22. - PubMed
    1. Pendleton KP, Grandis JR. Cisplatin-Based Chemotherapy Options for Recurrent and/or Metastatic Squamous Cell Cancer of the Head and Neck. Clin Med Insights Ther. 2013;5:103–16. - PMC - PubMed
    1. Rabik CA, Dolan ME. Molecular mechanisms of resistance and toxicity associated with platinating agents. Cancer Treat Rev. 2007;33:9–23. - PMC - PubMed
    1. Cepeda V, Fuertes MA, Castilla J, Alonso C, Quevedo C, Perez JM. Biochemical mechanisms of cisplatin cytotoxicity. Anticancer Agents Med Chem. 2007;7:3–18. - PubMed

MeSH terms