

Reciprocal interactions between malignant cells and macrophages enhance cancer stemness and M2 polarization in HBV-associated hepatocellular carcinoma
- PMID: 38169544
- PMCID: PMC10758064
- DOI: 10.7150/thno.87962
Reciprocal interactions between malignant cells and macrophages enhance cancer stemness and M2 polarization in HBV-associated hepatocellular carcinoma
Abstract
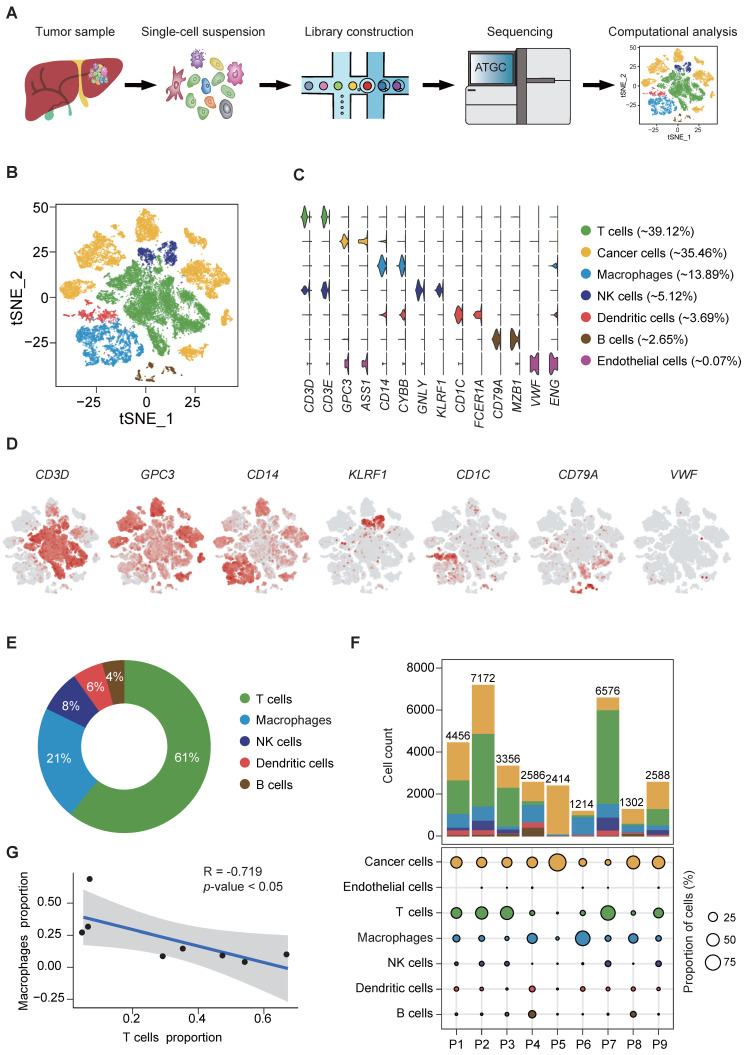
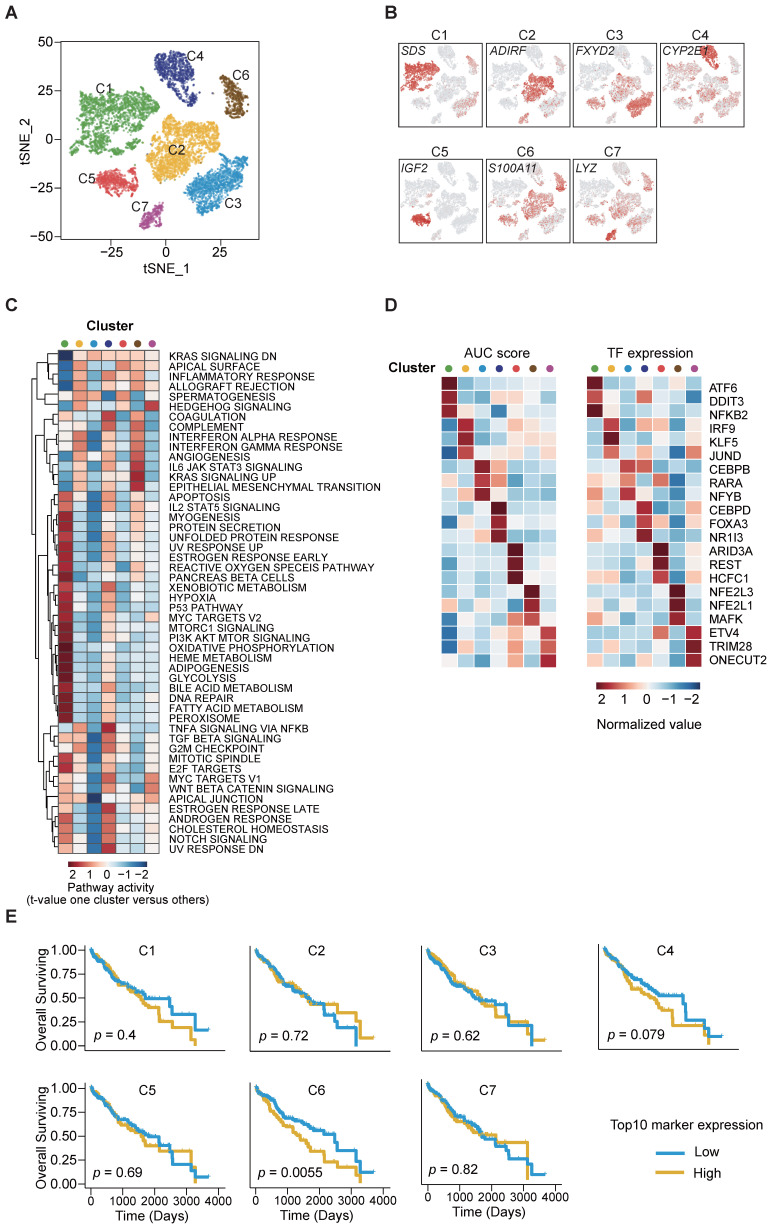
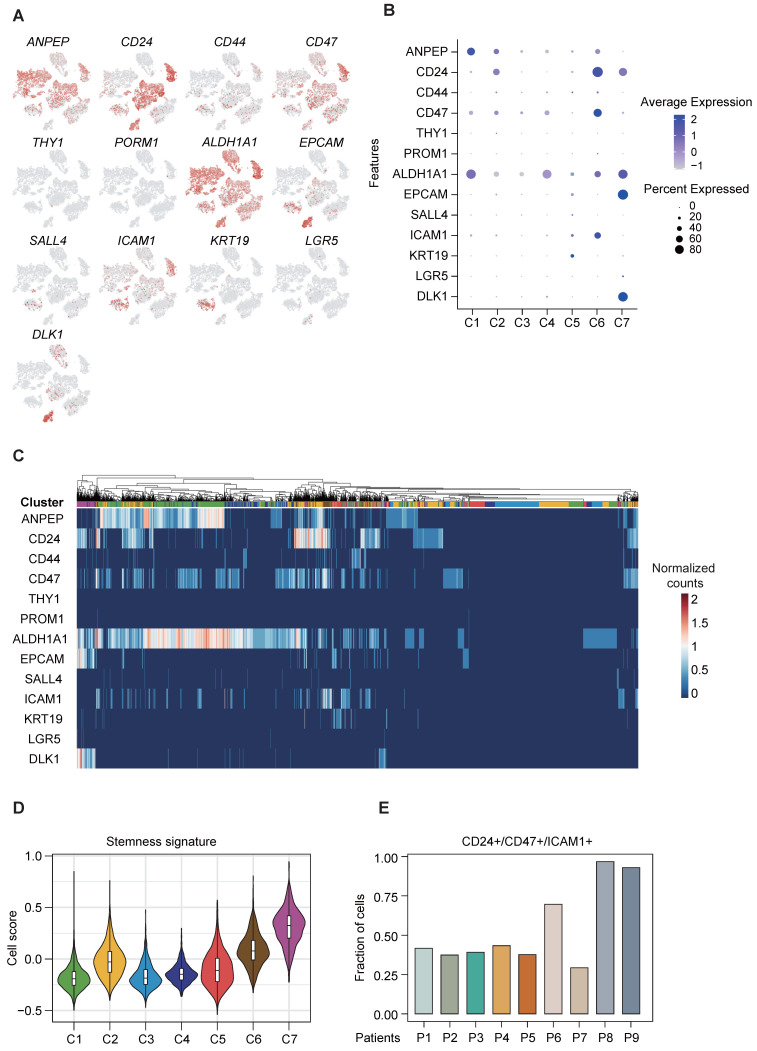
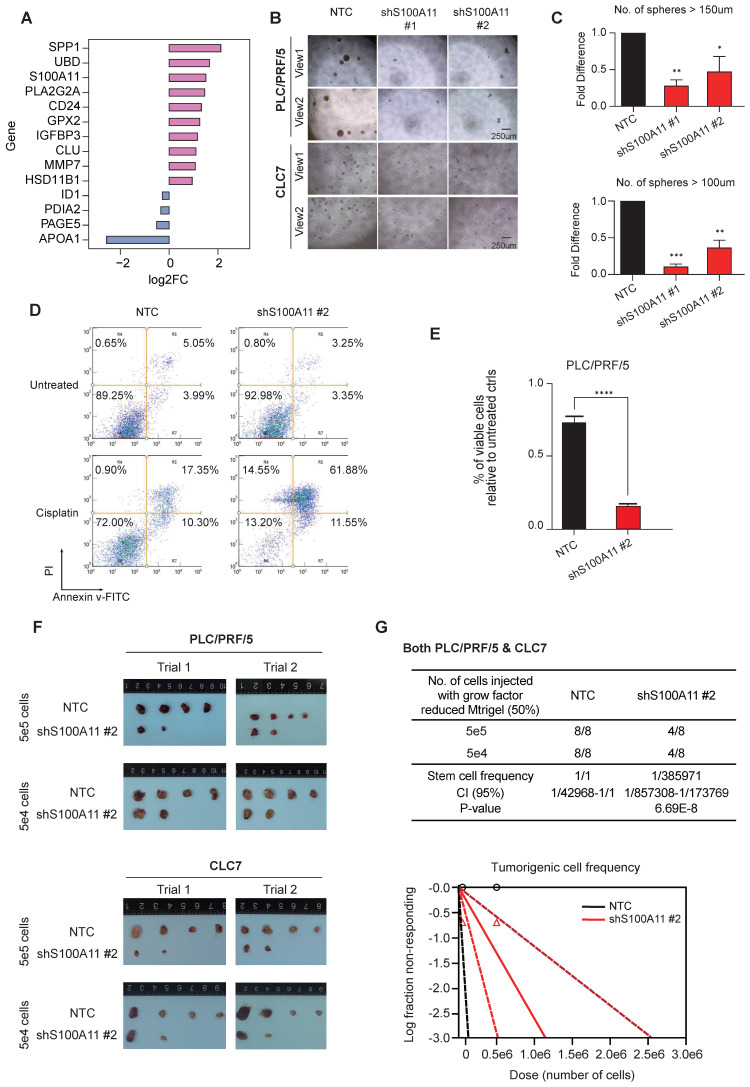
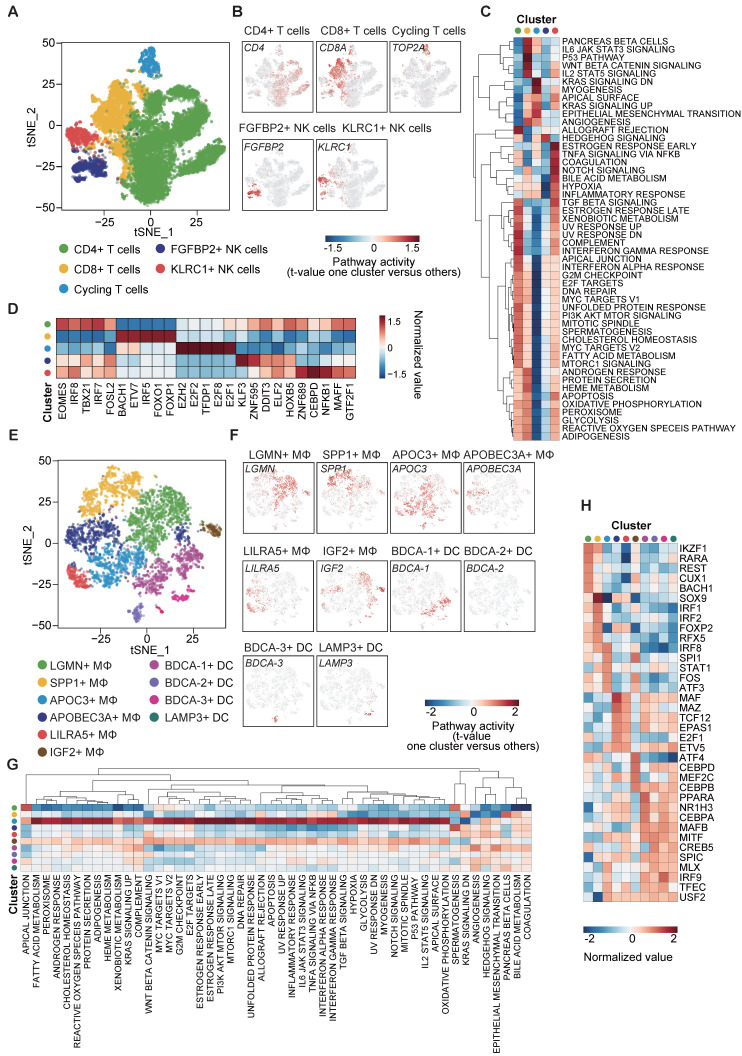
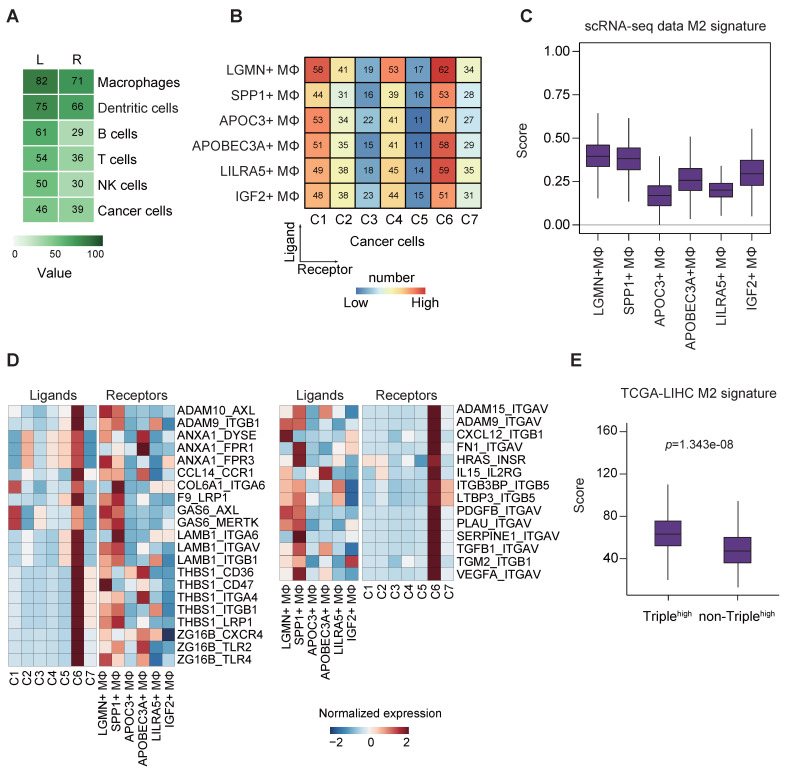
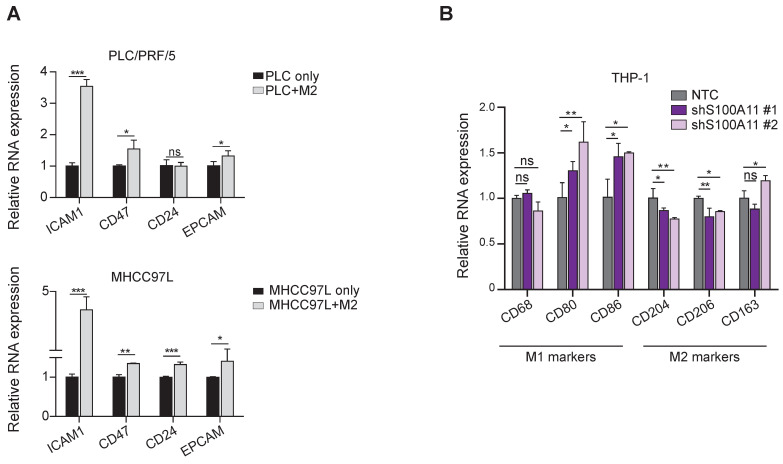
Background: The tumor microenvironment of cancers has emerged as a crucial component in regulating cancer stemness and plays a pivotal role in cell-cell communication. However, the specific mechanisms underlying these phenomena remain poorly understood. Methods: We performed the single-cell RNA sequencing (scRNA-seq) on nine HBV-associated hepatocellular carcinoma (HCC) patients. The heterogeneity of the malignant cells in pathway functions, transcription factors (TFs) regulation, overall survival, stemness, as well as ligand-receptor-based intercellular communication with macrophages were characterized. The aggressive and stemness feature for the target tumor subclone was validated by the conduction of in vitro assays including sphere formation, proliferation, Annexin V apoptosis, flow cytometry, siRNA library screening assays, and multiple in vivo preclinical mouse models including mouse hepatoma cell and human HCC cell xenograft models with subcutaneous or orthotopic injection. Results: Our analysis yielded a comprehensive atlas of 31,664 cells, revealing a diverse array of malignant cell subpopulations. Notably, we identified a stemness-related subclone of HCC cells with concurrent upregulation of CD24, CD47, and ICAM1 expression that correlated with poorer overall survival. Functional characterization both in vitro and in vivo validated S100A11 as one of the top downstream mediators for tumor initiation and stemness maintenance of this subclone. Further investigation of cell-cell communication within the tumor microenvironment revealed a propensity for bi-directional crosstalk between this stemness-related subclone and tumor-associated macrophages (TAMs). Co-culture study showed that this interaction resulted in the maintenance of the expression of cancer stem cell markers and driving M2-like TAM polarization towards a pro-tumorigenic niche. We also consolidated an inverse relationship between the proportions of TAMs and tumor-infiltrating T cells. Conclusions: Our study highlighted the critical role of stemness-related cancer cell populations in driving an immunosuppressive tumor microenvironment and identified the S100A11 gene as a key mediator for stemness maintenance in HCC. Moreover, our study provides support that the maintenance of cancer stemness is more attributed to M2 polarization than the recruitment of the TAMs.
Keywords: Cancer stem cell; Hepatocellular carcinoma; Macrophage polarization; Single-cell RNA sequencing; Tumor heterogeneity.
© The author(s).
Conflict of interest statement
Competing Interests: The authors have declared that no competing interest exists.
Figures
Similar articles
-
TNF-α derived from M2 tumor-associated macrophages promotes epithelial-mesenchymal transition and cancer stemness through the Wnt/β-catenin pathway in SMMC-7721 hepatocellular carcinoma cells.Exp Cell Res. 2019 May 1;378(1):41-50. doi: 10.1016/j.yexcr.2019.03.005. Epub 2019 Mar 4. Exp Cell Res. 2019. PMID: 30844387
-
Integrating single-cell and bulk RNA sequencing reveals CK19 + cancer stem cells and their specific SPP1 + tumor-associated macrophage niche in HBV-related hepatocellular carcinoma.Hepatol Int. 2024 Feb;18(1):73-90. doi: 10.1007/s12072-023-10615-9. Epub 2023 Dec 30. Hepatol Int. 2024. PMID: 38159218
-
Crosstalk between hepatic tumor cells and macrophages via Wnt/β-catenin signaling promotes M2-like macrophage polarization and reinforces tumor malignant behaviors.Cell Death Dis. 2018 Jul 18;9(8):793. doi: 10.1038/s41419-018-0818-0. Cell Death Dis. 2018. PMID: 30022048 Free PMC article.
-
Tumor‑associated macrophages activated in the tumor environment of hepatocellular carcinoma: Characterization and treatment (Review).Int J Oncol. 2024 Oct;65(4):100. doi: 10.3892/ijo.2024.5688. Epub 2024 Sep 6. Int J Oncol. 2024. PMID: 39239752 Free PMC article. Review.
-
Tumor-associated macrophages in liver cancer: From mechanisms to therapy.Cancer Commun (Lond). 2022 Nov;42(11):1112-1140. doi: 10.1002/cac2.12345. Epub 2022 Sep 7. Cancer Commun (Lond). 2022. PMID: 36069342 Free PMC article. Review.
Cited by
-
Metabolic interplay between endometrial cancer and tumor-associated macrophages: lactate-induced M2 polarization enhances tumor progression.J Transl Med. 2025 Aug 18;23(1):923. doi: 10.1186/s12967-025-06235-6. J Transl Med. 2025. PMID: 40826409 Free PMC article.
-
Gold and Silver Nanoparticles Efficiently Modulate the Crosstalk Between Macrophages and Cancer Cells.Int J Nanomedicine. 2025 Apr 15;20:4777-4802. doi: 10.2147/IJN.S508171. eCollection 2025. Int J Nanomedicine. 2025. PMID: 40255669 Free PMC article.
-
Targeting stemness pathways modulates macrophage polarization and reprograms the tumor microenvironment.Front Immunol. 2025 Mar 14;16:1513404. doi: 10.3389/fimmu.2025.1513404. eCollection 2025. Front Immunol. 2025. PMID: 40160820 Free PMC article.
-
Cancer stem cells: advances in knowledge and implications for cancer therapy.Signal Transduct Target Ther. 2024 Jul 5;9(1):170. doi: 10.1038/s41392-024-01851-y. Signal Transduct Target Ther. 2024. PMID: 38965243 Free PMC article. Review.
-
Multimodal sequencing of neoadjuvant nivolumab treatment in hepatocellular carcinoma reveals cellular and molecular immune landscape for drug response.Mol Cancer. 2025 Apr 9;24(1):110. doi: 10.1186/s12943-025-02314-w. Mol Cancer. 2025. PMID: 40205519 Free PMC article.
References
-
- Llovet JM, Kelley RK, Villanueva A, Singal AG, Pikarsky E, Roayaie S. et al. Hepatocellular carcinoma. Nature reviews Disease primers. 2021;7:6. - PubMed
-
- Villanueva A. Hepatocellular Carcinoma. N Engl J Med. 2019;380:1450–62. - PubMed
-
- Lee J, Ng K, Wong L, Ang A, Tan SH, Tai D. et al. Immune checkpoint inhibitors and tyrosine kinase inhibitors in patients with advanced hepatocellular carcinoma: Does the sequence matter? Ann Oncol. 2019;30:23. - PubMed
-
- Tirino V, Desiderio V, Paino F, De Rosa A, Papaccio F, La Noce M. et al. Cancer stem cells in solid tumors: an overview and new approaches for their isolation and characterization. FASEB J. 2013;27:13–24. - PubMed
-
- Lee TK, Guan XY, Ma S. Cancer stem cells in hepatocellular carcinoma - from origin to clinical implications. Nat Rev Gastroenterol Hepatol. 2022;19:26–44. - PubMed
MeSH terms
LinkOut - more resources
Full Text Sources
Medical
Research Materials
Miscellaneous
