. 2024 Jan 1;14(2):861-878.
doi: 10.7150/thno.87317. eCollection 2024.

SGK3 promotes vascular calcification via Pit-1 in chronic kidney disease

Affiliations

SGK3 promotes vascular calcification via Pit-1 in chronic kidney disease

Qing-Qing Dong et al. Theranostics. .

Abstract

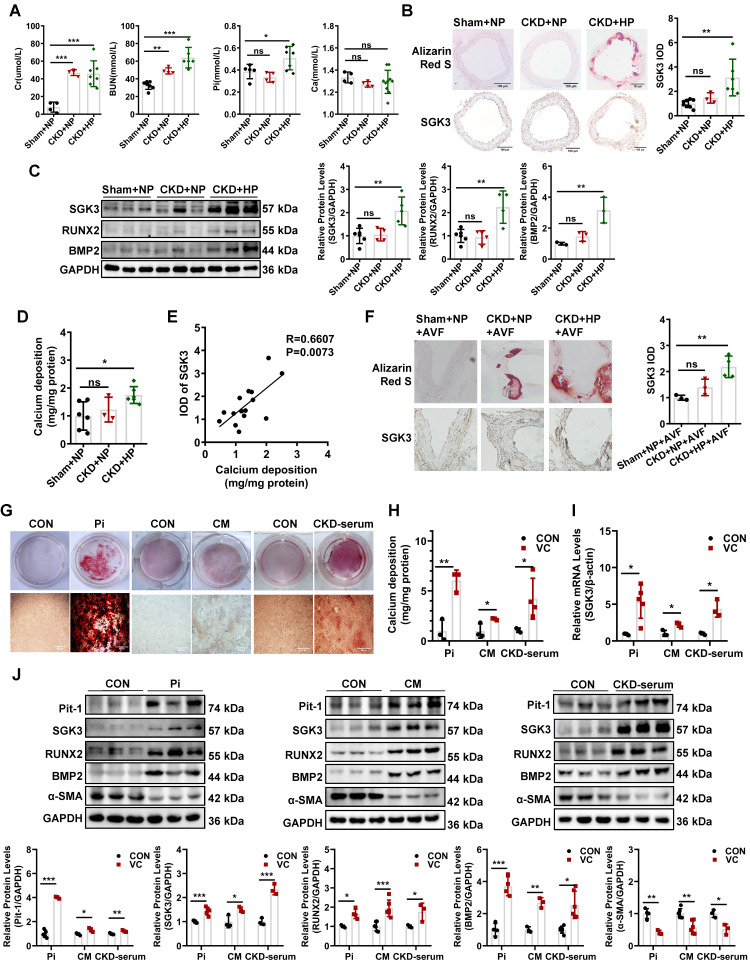
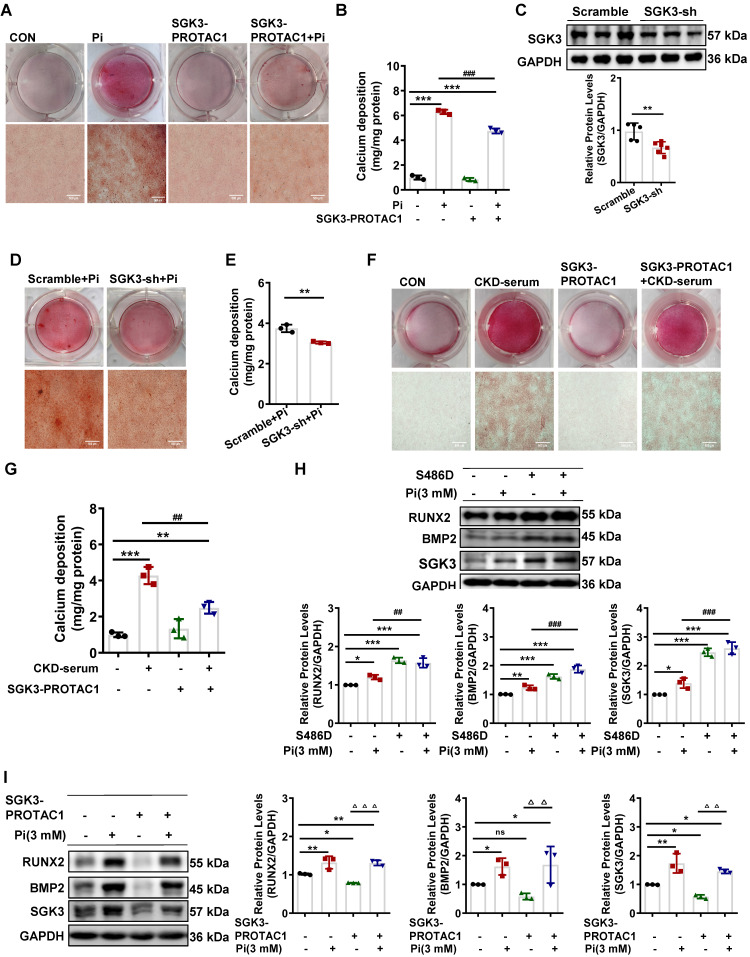
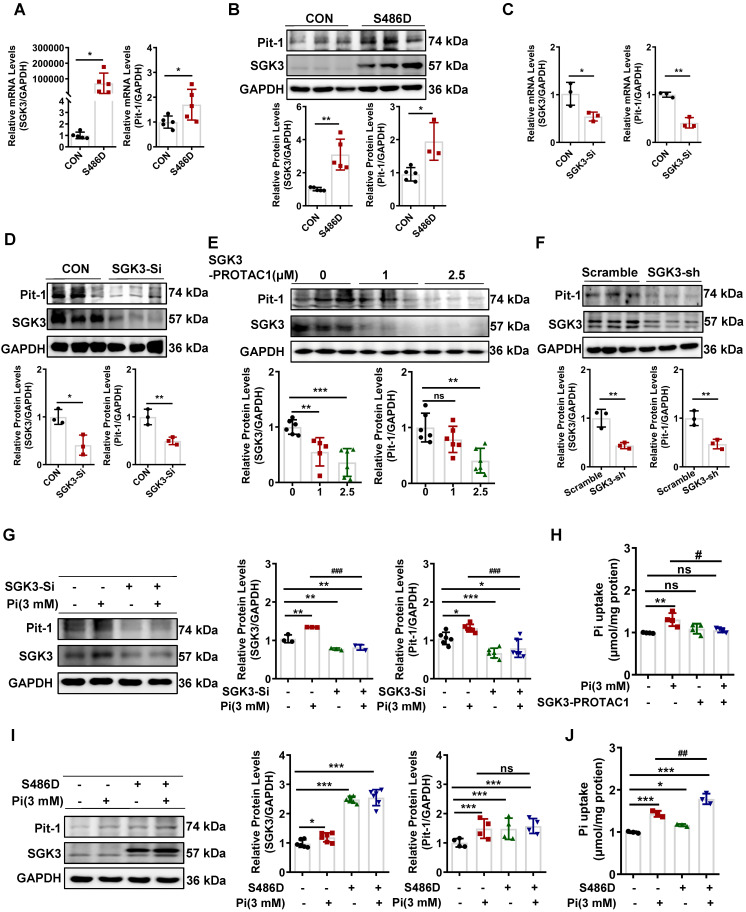
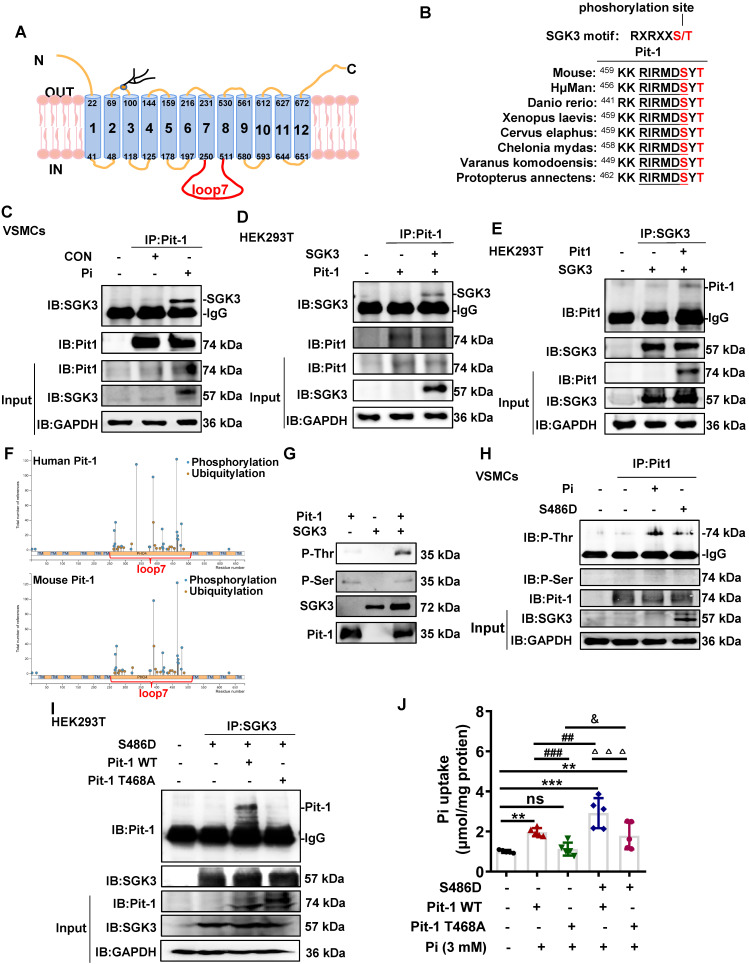
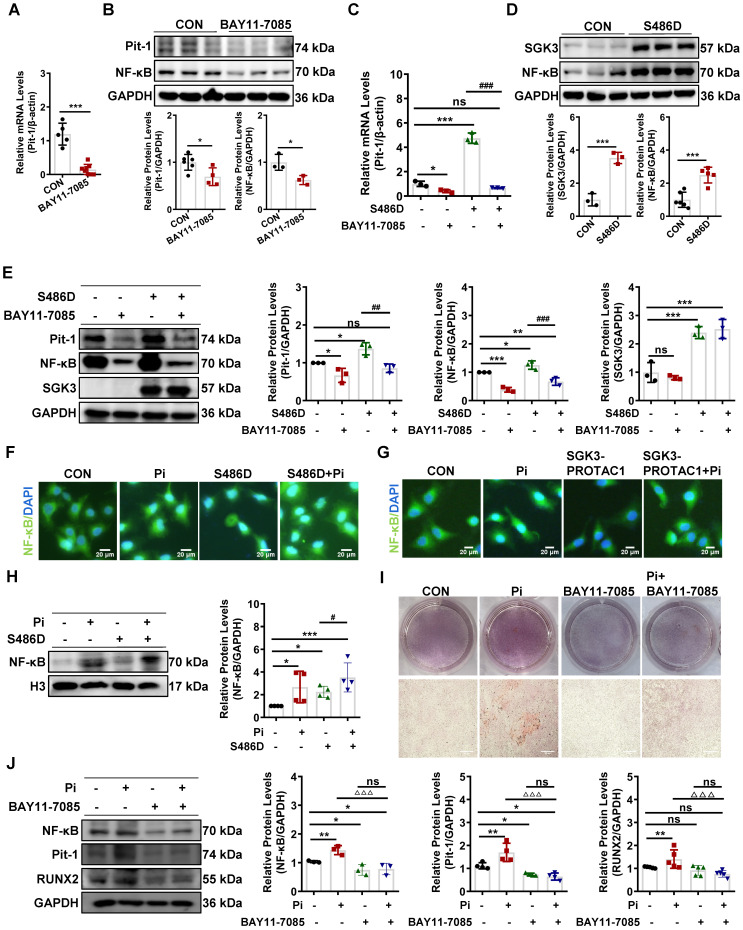
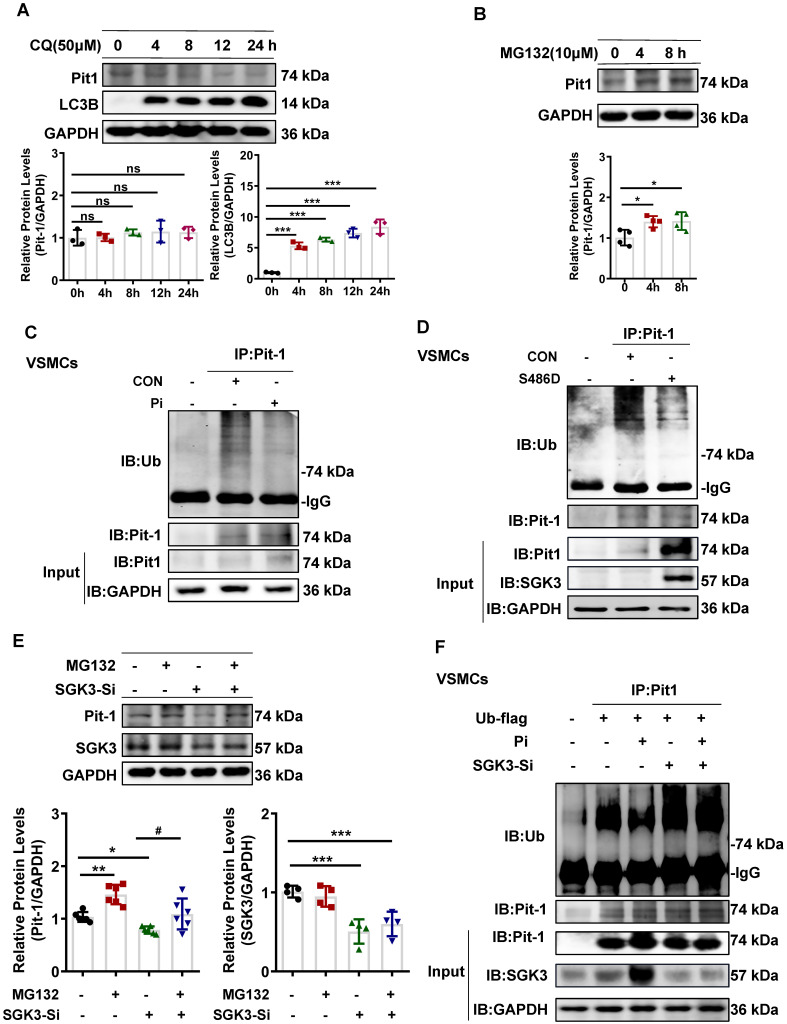
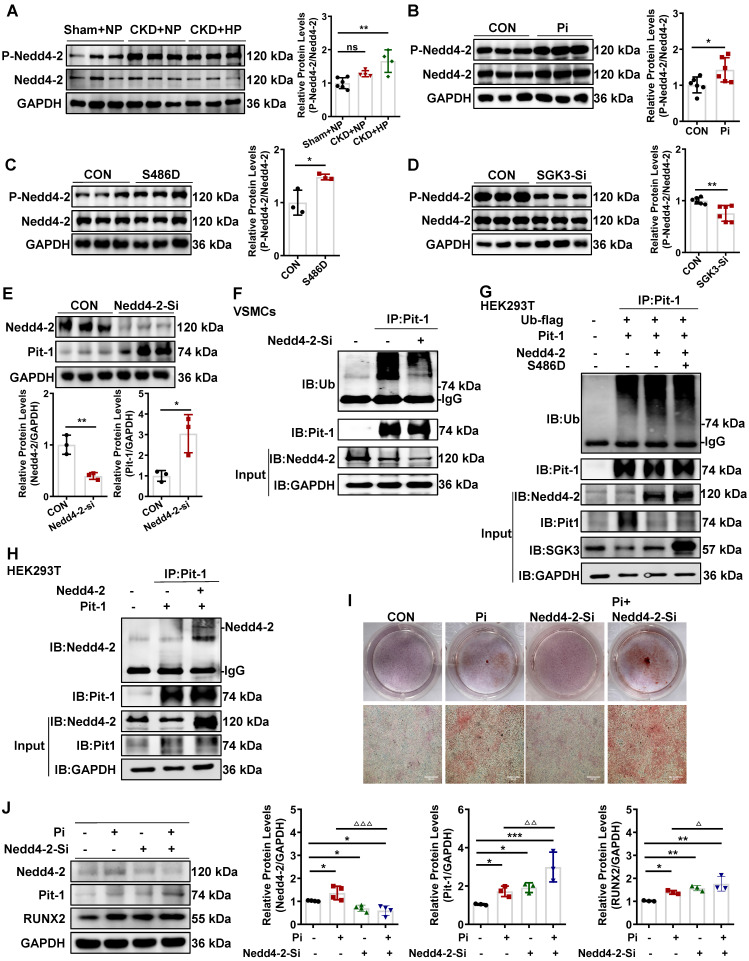
Rationale: Vascular calcification (VC) is a life-threatening complication in patients with chronic kidney disease (CKD) caused mainly by hyperphosphatemia. However, the regulation of VC remains unclear despite extensive research. Although serum- and glucocorticoid-induced kinase 3 (SGK3) regulate the sodium-dependent phosphate cotransporters in the intestine and kidney, its effect on VC in CKD remains unknown. Additionally, type III sodium-dependent phosphate cotransporter-1 (Pit-1) plays a significant role in VC development induced by high phosphate in vascular smooth muscle cells (VSMCs). However, it remains unclear whether SGK3 regulates Pit-1 and how exactly SGK3 promotes VC in CKD via Pit-1 at the molecular level. Thus, we investigated the role of SGK3 in the certified outflow vein of arteriovenous fistulas (AVF) and aortas of uremic mice. Methods and Results: In our study, using uremic mice, we observed a significant upregulation of SGK3 and calcium deposition in certified outflow veins of the AVF and aortas, and the increase expression of SGK3 was positively correlated with calcium deposition in uremic aortas. In vitro, the downregulation of SGK3 reversed VSMCs calcification and phenotype switching induced by high phosphate. Mechanistically, SGK3 activation enhanced the mRNA transcription of Pit-1 through NF-κB, downregulated the ubiquitin-proteasome mediated degradation of Pit-1 via inhibiting the activity of neural precursor cells expressing developmentally downregulated protein 4 subtype 2 (Nedd4-2), an E3 ubiquitin ligase. Moreover, under high phosphate stimulation, the enhanced phosphate uptake induced by SGK3 activation was independent of the increased protein expression of Pit-1. Our co-immunoprecipitation and in vitro kinase assays confirmed that SGK3 interacts with Pit-1 through Thr468 in loop7, leading to enhanced phosphate uptake. Conclusion: Thus, it is justifiable to conclude that SGK3 promotes VC in CKD by enhancing the expression and activities of Pit-1, which indicate that SGK3 could be a therapeutic target for VC in CKD.

Keywords: Pit-1; SGK3; chronic kidney disease; ubiquitin-proteasome pathway; vascular calcification.


Conflict of interest statement

Competing Interests: The authors have declared that no competing interest exists.

Figures

Figure 1
Figure 1
Elevated protein expression of SGK3 in calcified VSMCs in vivo and in vitro. Female DBA2 mice modeled with CKD by 5/6 nephrectomy and fed with a high-phosphate diet for 8 weeks after surgery. A. At the experimental end point, blood urea nitrogen (BUN), serum creatinine (Cr), calcium (Ca), and phosphate (Pi) were detected. B. Alizarin red S staining and representative immunohistochemical staining of SGK3 were detected in the aorta of CKD mice. C. The protein expression levels of SGK3, RUNX2 and BMP2 in the aorta of CKD mice, as assayed by immunoblotting. D. The total calcium content was detected in the aorta of CKD mice. E. There was a significantly positive correlation between SGK3 expression and calcium deposition in mice aorta. n=4-6 for each group. F. Alizarin red S staining and representative immunohistochemical staining of SGK3 in the AVF outflow vein of CKD mice. n=3 for each group. *P < 0.05, **P < 0.01, ***P < 0.001 vs. Sham+NP group. Mouse or human VSMCs treated with 3 mM Pi, calcification medium (CM), or 20% CKD-serum for 7 days. G. The calcium deposits in VSMCs was detected by Alizarin Red S staining. H. The calcium content in VSMCs was quantified by calcium assay kit. I. After 3 mM Pi, CM or 20% CKD-serum treatment for 24 h, the mRNA levels of SGK3 were detected with quantitative RT-PCR. J. Western blot and related semi-quantificated analysis of Pit-1, SGK3, BMP2, Runx2 and α-SMA in VSMCs with 3 mM Pi, CM or 20% CKD-serum for 7 days. *P < 0.05, **P < 0.01, ***P < 0.001 vs. control group.
Figure 2
Figure 2
Inhibition of SGK3 attenuated high phosphate-induced VSMCs calcification and phenotype switching in vitro. A-B. Mouse VSMCs treated with 3 mM Pi and without or with additional treatment with 2.5 μmol/L SGK3 inhibitor (SGK3-PROTAC1) for 7 days. Representative original images showing Alizarin Red S staining (A). The cellular calcium content was evaluated quantitatively (B). ***P < 0.001 vs. control group; ###P < 0.001 vs. Pi group. C. Mouse VSMCs were infected with scramble or SGK3 shRNA (SGK3-sh) for 72 h. Western blot analysis of SGK3. **P < 0.01 vs. scramble group. D-E. High Pi treated mouse VSMCs were infected with scramble or SGK3 shRNA (SGK3-sh). Alizarin Red S staining (D), and calcium content (E) was used to detect calcium deposits in VSMCs. **P < 0.01 vs. scrambled+Pi group. F-G. Human VSMCs treated with 20% human serum (CON) or 20% CKD-serum and SGK3-PROTAC1 for 7 days. Representative images of the Alizarin Red S staining showed the mineral deposition in matrix (F). Calcium content of the extracellular matrix was given as Mean ± SD (G). **P < 0.01, ***P < 0.001 vs. control group; ##P < 0.01 vs. CKD-serum group. H-I. Mouse VSMCs transiently transfected with SGK3-S486D plasmid (H) or treated with SGK3-PROTAC1 (I), in presence or absence of 3 mM Pi. The protein levels of SGK3, RUNX2 and BMP2 were measured by western blot. *P < 0.05, **P < 0.01, ***P < 0.001 vs. control group; ##P < 0.01, ###P < 0.001 vs. Pi group; △△P < 0.01, △△△P < 0.001 vs. SGK3-PROTAC1 group.
Figure 3
Figure 3
SGK3 enhanced high phosphate-induced expression of Pit-1 in cultured VSMCs. A-D. Mouse VSMCs transiently transfected with SGK3-S486D plasmid or SGK3 siRNA. The transcription levels of Pit-1 and SGK3 measured by qPCR (A, C). The protein levels of Pit-1 and SGK3 were measured by western blot (B, D). E. Mouse VSMCs treated with SGK3-PROTAC1 for 24 h. Immunoblot of Pit-1 and SGK3 cleavage of cell lysates. F. Mouse VSMCs were transfected with scramble or SGK3 shRNA for 72 h. The protein levels of Pit-1 and SGK3 were measured by western blot. *P < 0.05, **P < 0.01, ***P < 0.001 vs. control group. G-J. Mouse VSMCs transiently transfected with SGK3 siRNA or SGK3-S486D plasmid, in presence or absence of 3 mM Pi. The protein levels of Pit-1 and SGK3 were measured by western blot (G, I). Pi uptake levels were determined from cell lysates by Pi Assay Kit (H, J). *P < 0.05, **P < 0.01, ***P < 0.001 vs. control group; #P < 0.05, ##P < 0.01, ###P < 0.001 vs. Pi group.
Figure 4
Figure 4
SGK3 phosphorylates Pit-1 at Thr in loop7. A. Schematic representation of Pit-1 loop7 domain (residues 251-510). B. The putative SGK3 phosphorylation site present in Pit-1 is conserved across different species. C. In mouse VSMCs treated with high Pi, whole-cell lysates (WCLs) were precipitated with an anti-Pit-1 antibody as input. The immunoprecipitates were analyzed with a western blot using anti-Pit-1 and anti-SGK3 antibodies. D-E. HEK293T cells co-transfected of WT SGK3 and Pit-1 plasmids for 48 h. WCLs were precipitated with the anti-Pit-1 antibody (D) or anti-SGK3 antibody (E) as input, and the immunoprecipitates obtained with anti-Pit-1 and anti-SGK3 antibodies. F. Phosphorylation sites of mouse and human Pit-1 were predicted using phosphosite databases (www.phosphosite.org). G. Active SGK3 kinase phosphorylated inactive Pit-1 substrate in vitro, visualized by western blot showing SGK3, Pit-1, Phosphothreonine (P-Thr) and Phosphoserine (P-Ser). H. Mouse VSMCs transiently transfected with SGK3-S486D plasmid or 3 mM Pi. WCLs were precipitated with an anti-Pit-1 antibody, and the immunoprecipitates were analyzed with western blot using SGK3, Pit-1, anti-P-Thr and anti-P-Ser antibodies. I. HEK293T cells co-transfected with the S686D, Pit-1 wild type or Pit-1 T468A plasmid. A portion of the whole-cell lysate was also subjected to WB analysis as input. J. HEK293T cells co-transfected with S686D, Pit-1 wild type or Pit-1 T468A plasmid. Pi uptake levels were determined from cell lysates by Pi Assay Kit. **P < 0.01, ***P < 0.001 vs. control group; ##P < 0.01, ###P < 0.001 vs. Pit-1 WT group; △△△P < 0.001 vs. S486D+Pit-1 WT group; &P < 0.05 vs. Pit-1 T468A group.
Figure 5
Figure 5
SGK3/NF-κB signaling pathway regulated the nuclear transcription of Pit-1 in mouse VSMCs. Mouse VSMCs treated with 20 µmol/L NF-κB inhibitor BAY11-7085. A. The mRNA levels of Pit-1 measured by qPCR. B. The protein levels of Pit-1 and NF-κB were measured by western blot. C. Mouse VSMCs transiently transfected with SGK3-S486D plasmid and then treated with or without 20 µmol/L BAY11-7085. The mRNA levels of Pit-1 measured by qPCR. D-E. Mouse VSMCs transiently transfected with SGK3-S486D plasmid (D) for 48 h, in presence or absence of BAY11-7085 (E). The protein levels of NF-κB, Pit-1 and SGK3 were measured by western blot. *P < 0.05, **P < 0.01, ***P < 0.001 vs. control group; ##P < 0.01, ###P < 0.001 vs. S486D group. F-G. Mouse VSMCs transiently transfected with SGK3-S486D plasmid (F), or treated with SGK3-PROTAC1 (G), in presence or absence of high Pi for 24 h. Representative immunofluorescence microscopy images showed NF-κB protein expression and localization in mouse VSMCs. Green labeling, NF-κB expression; blue labeling, nuclei. Scale bars: 20 μm. H. Mouse VSMCs transiently transfected with SGK3-S486D plasmid, in presence or absence of Pi for 48 h. The nuclear protein levels of NF-κB was measured by western blot. *P < 0.05, ***P < 0.001 vs. control group; #P < 0.05 vs. S486D group. I. Mouse VSMCs treated with 3 mM Pi and without or with additional treatment with 20 µmol/L NF-κB inhibitor BAY11-7085 for 7 days. Representative original images showing Alizarin Red S staining. J. Mouse VSMCs were treated with BAY11-7085 for 24 h, in presence or absence of high Pi. The protein levels of NF-κB, Pit-1 and RUNX2 were measured by western blot. *P < 0.05, **P < 0.01 vs. control group; △△△P < 0.001 vs. Pi group.
Figure 6
Figure 6
SGK3 inhibiton partially reversed high phosphate-induced decrease in Pit-1 degradation triggered by the proteasome pathway. A. Mouse VSMCs treated with 50 μM chloroquine (CQ) for 4 h, 8 h, 12 h, 24 h. The protein levels of Pit-1 and LC3B were measured by western blot. B. Mouse VSMCs treated with 10 μM MG132 for 4 h and 8 h. The protein levels of Pit-1 were measured by western blot. *P < 0.05, ***P < 0.001 vs. the control group. C-D. Mouse VSMCs treated with 3 mM Pi (C) or transfected with SGK3-S486D plasmid (D) for 48 h, and MG132 was added for the last 8 h. A portion of the whole-cell lysate was also subjected to WB analysis as input. E. Mouse VSMCs transiently transfected with SGK3 siRNA for 48 h and then treated with or without MG132 for the last 8 h. The protein levels of Pit-1 and SGK3 were measured by western blot. *P < 0.05, **P < 0.01, ***P < 0.001 vs. SGK3-Si-/MG132- group; #P < 0.05 vs. SGK3-Si+/MG132- group. F. Mouse VSMCs transiently transfected with SGK3 siRNA in presence or absence of 3 mM for 48 h. A portion of the whole-cell lysate was also subjected to WB analysis as input.
Figure 7
Figure 7
SGK3/Nedd4-2 signaling pathway prevents ubiquitin-mediated degradation of Pit-1. Mice were modeled with CKD by 5/6 nephrectomy and fed high phosphate diet. A. The protein levels of phospho-Nedd4-2 (P-Nedd4-2) and Nedd4-2 in the aorta were measured by western blot. **P < 0.01, vs. Sham+NP group. B-D. Mouse VSMCs treated with 3 mM Pi (B), or transfected with SGK3-S486D plasmid (C) and SGK3 siRNA (D) for 48 h. The protein levels of P-Nedd4-2 and Nedd4-2 were measured by western blot. E. Mouse VSMCs transiently transfected with Nedd4-2 siRNA for 48 h. The protein levels of Pit-1 and Nedd4-2 were measured by western blot. *P < 0.05, **P < 0.01 vs. the control group. F. Mouse VSMCs transiently transfected with Nedd4-2 siRNA for 48 h and followed by MG132 treatment for the last 8 h. Ubiquitination assay were precipitated with an anti-Pit-1 antibody, and the immunoprecipitates were analyzed with western blot using anti-Pit-1 and anti-ubiquitin (Ub) antibodies. G-H. The HEK293T cells were transfected with the indicated plasmids for 48 h. Ubiquitination assay (G) and Co-IP analysis (H) were precipitated with an anti-Pit-1 antibody and the immunoprecipitates were blotted with anti-Nedd4-2, anti-Pit-1, anti-ubiquitin (Ub), anti-SGK3 and anti-GAPDH antibodies. I. Mouse VSMCs were transfected with Nedd4-2 siRNA and without or with additional treatment 3 mM Pi for 7 days. Representative original images showing Alizarin Red S staining. J. Mouse VSMCs transiently transfected with Nedd4-2 siRNA for 48 h, in presence or absence of high Pi. The protein levels of Nedd4-2, Pit-1 and RUNX2 were measured by western blot. *P < 0.05, **P < 0.01, ***P < 0.001 vs. control group; P < 0.05, △△P < 0.01, △△△P < 0.001 vs. Pi group.

Similar articles

Cited by

References

    1. Lee SJ, Lee IK, Jeon JH. Vascular calcification-new insights into its mechanism. Int J Mol Sci. 2020. 21(8) - PMC - PubMed
    1. Li W, Feng W, Su X, Luo D, Li Z, Zhou Y, SIRT6 protects vascular smooth muscle cells from osteogenic transdifferentiation via Runx2 in chronic kidney disease. J Clin Invest. 2022. 132(1) - PMC - PubMed
    1. Yuan J, Zou XR, Han SP, Cheng H, Wang L, Wang JW. et al. Prevalence and risk factors for cardiovascular disease among chronic kidney disease patients: results from the Chinese cohort study of chronic kidney disease (C-STRIDE) BMC Nephrol. 2017;18(1):p.. 23. - PMC - PubMed
    1. Daniel WT, Weber C, Bailey JA, Raggi P, Sharma J. Prospective analysis of coronary calcium in patients on dialysis undergoing a near-total parathyroidectomy. Surgery. 2013;154(6):p.. 1315-21; discussion 1321-2. - PubMed
    1. Dong K, He X, Hu G, Yao Y, Zhou J. Coronary artery disease risk gene PRDM16 is preferentially expressed in vascular smooth muscle cells and a potential novel regulator of smooth muscle homeostasis. bioRxiv. 2023. 2023. 04. 03.535461.

MeSH terms