. 2024 Jan 1;14(2):593-607.
doi: 10.7150/thno.85437. eCollection 2024.

Combined BET and MEK Inhibition synergistically suppresses melanoma by targeting YAP1

Affiliations

Combined BET and MEK Inhibition synergistically suppresses melanoma by targeting YAP1

Rui Hu et al. Theranostics. .

Abstract

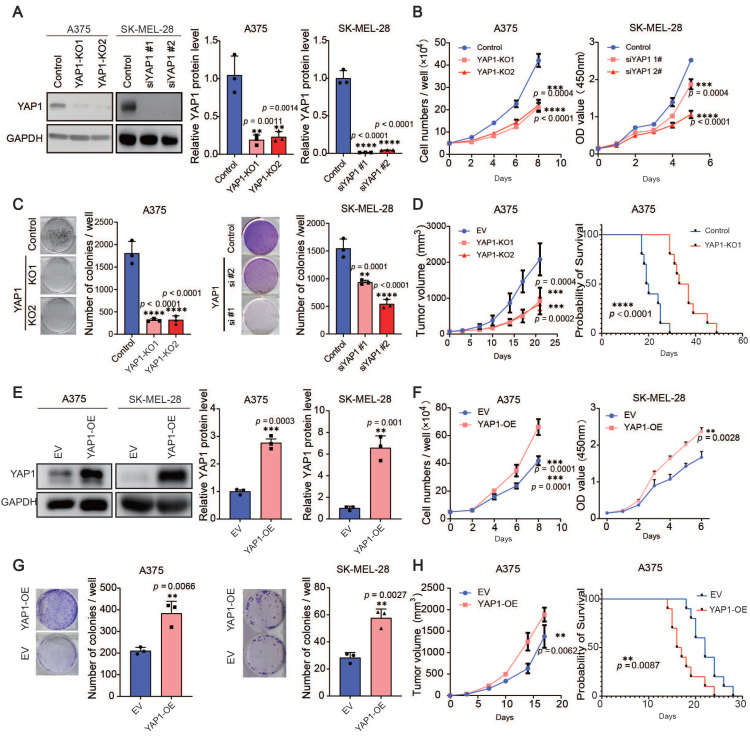
Rationale: The response rate to the MEK inhibitor trametinib in BRAF-mutated melanoma patients is less than 30%, and drug resistance develops rapidly, but the mechanism is still unclear. Yes1-associated transcriptional regulator (YAP1) is highly expressed in melanoma and may be related to MEK inhibitor resistance. The purpose of this study was to investigate the mechanism of YAP1 in MEK inhibitor resistance in melanoma and to screen YAP1 inhibitors to further determine whether YAP1 inhibition reverses MEK inhibitor resistance. Methods: On the one hand, we analyzed paired melanoma and adjacent tissue samples using RNA-seq and found that the Hippo-YAP1 signaling pathway was the top upregulated pathway. On the other hand, we evaluated the transcriptomes of melanoma samples from patients before and after trametinib treatment and investigated the correlation between YAP1 expression and trametinib resistance. Then, we screened for inhibitors that repress YAP1 expression and investigated the mechanisms. Finally, we investigated the antitumor effect of YAP1 inhibition combined with MEK inhibition both in vitro and in vivo. Results: We found that YAP1 expression levels upon trametinib treatment in melanoma patients were correlated with resistance to trametinib. YAP1 was translocated into the nucleus after trametinib treatment in melanoma cells, which could render resistance to MEK inhibition. Thus, we screened for inhibitors that repress YAP1 expression and identified multiple bromodomain and extra-terminal (BET) inhibitors, including NHWD-870, as hits. BET inhibition repressed YAP1 expression by decreasing BRD4 binding to the YAP1 promoter. Consistently, YAP1 overexpression was sufficient to reverse the proliferation defect caused by BRD4 depletion. In addition, the BET inhibitor NHWD-870 acted synergistically with trametinib to suppress melanoma growth in vitro and in vivo. Conclusions: We identified a new vulnerability for MEK inhibitor-resistant melanomas, which activated Hippo pathway due to elevated YAP1 activity. Inhibition of BRD4 using BET inhibitors suppressed YAP1 expression and led to blunted melanoma growth when combined with treatment with the MEK inhibitor trametinib.

Keywords: BET inhibitor; BRD4; MEK inhibitor; Melanoma; YAP1.


Conflict of interest statement

Competing Interests: The authors have declared that no competing interest exists.

Figures

Figure 1
Figure 1
YAP1 expression is correlated with poor response to trametinib and survival of patients with melanoma. (A) Paired primary tumors and adjacent tissues from 23 melanoma patients were compared by using RNA-sequencing (RNA-seq) analysis. Shown are the pathways that were upregulated in the tumors. (B) Kaplan-Meier survival curve of two sub-groups that divided by YAP1 expression in TCGA-SKCM dataset. (C) YAP1 immunofluorescence (IF) staining of tumor tissues from responders and nonresponders before and after trametinib treatment. YAP1 (green) and DAPI (blue). (D) Fluorescence intensity of nuclear YAP1 expression in tumor tissue from responders and nonresponders before and after trametinib treatment. (E) Changes in YAP1 expression in tumor tissue from responders and nonresponders before and after trametinib treatment (YAP1post-YAP1prior). (F) Kaplan‒Meier analysis of the overall survival of melanoma patients treated with trametinib. The YAP1post-YAP1prior high group had a worse prognosis than the YAP1post-YAP1prior low group. (G-H) Representative images of YAP1 immunofluorescence (IF) staining in A375 cells (G) or SK-MEL-28 cells (H) before and after trametinib treatment. YAP1, green; DAPI, blue. * p < 0.05, ** p < 0.01, *** p < 0.001. The error bars represent the SEMs.
Figure 2
Figure 2
YAP1 plays an important role in melanoma growth. (A) Representative images (left) and quantification of western blot analysis (right) of control or YAP1-polyclonal knockout (KO1 or KO2) A375 and knockdown (siYAP1#1 or siYAP1#2) SK-MEL-28 cells. GAPDH served as the loading control. The data were selected from three independent experiments. (B-C) Cell counting assays (B) and colony formation assays (C) of control or YAP1-knockout (KO1 or KO2) A375 (left) and knockdown (siYAP1#1 or siYAP1#2) SK-MEL-28 (right) cells. (D) Tumor growth curves of nude mice implanted with control or YAP1-knockout (KO1 or KO2) A375 cells (n = 5/group) and Survival of mice after subcutaneous implantation of control or YAP1-knockout (KO1) A375 cells (n = 10/group). (E) Representative images (left) and quantification of western blot analysis (right) of control (EV) or YAP1 overexpression (OE) A375 and SK-MEL-28 cells. GAPDH served as the loading control. The data were selected from three independent experiments. (F-G) Cell counting assays (F) and colony formation assays (G) of control (EV) or YAP1 overexpression (OE) A375 and SK-MEL-28 cells. (H) Tumor growth curves of nude mice implanted with control (EV) or YAP1 overexpression (OE) A375 cells (n = 5/group) and Survival of mice after subcutaneous implantation of control or YAP1- overexpression (OE) A375 cells (n = 10/group). * p < 0.05, ** p < 0.01, *** p < 0.001. The error bars represent the SEMs.
Figure 3
Figure 3
BET inhibitors inhibit YAP1 expression. (A) Flowchart of RT‒qPCR-based drug screening. (B) Results of drug screening for inhibitors of YAP1 expression in A375 cells. Screening with a concentration of 1 μM for 3 days identified 4 out of 102 small molecule compounds that decreased YAP1 expression by 50%. (C) Relative YAP1 mRNA levels in A375 cells treated with JQ1 and NHWD-870 at the indicated concentrations for 3 days. (D-E) Representative images (left) and quantification (right) of western blot analysis of A375 (D) and SK-MEL-28 (E) cells treated with JQ1 or NHWD-870 at the indicated concentrations for 3 days. (F) Relative YAP1 protein expression levels in YUSOC, YUGASP, YUAME, YUMAC and SK-MEL-28 melanoma cells treated with DMSO or 10 nM NHWD-870 for 3 days. (G) Cell counting assays of A375 (left) and SK-MEL-28 (right) cells cultured in DMSO or in 10 nM or 20 nM NHWD-870. (H-I) Representative images (left) and quantification (right) of colony formation assays of A375 (H) and SK-MEL-28 (I) cells treated with DMSO or with 10 nM or 20 nM NHWD-870. (J) Tumor growth curves for A375 tumor-bearing mice (n = 8/group) treated with vehicle or with 1 mg/kg NHWD-870 for 21 days. (K) Representative immunofluorescence images (left) and quantification (right) of Ki67+ cells in A375 tumors from mice treated with vehicle or with 1 mg/kg NHWD-870. Ki67, red; Melan A, green; and DAPI, blue. The scale bars are 200 μm and 10 μm. (L) Representative YAP1 staining (left) and IHC scoring (right) of A375 tumors from mice treated with vehicle or 1 mg/kg NHWD-870 (n = 8/group). The scale bars are 200 μm and 20 μm. * p < 0.05, ** p < 0.01, *** p < 0.001. The error bars represent the SEMs.
Figure 4
Figure 4
BRD4 promotes melanoma progression through direct regulation of YAP1. (A) The results of the association between overall survival time of patients and the expression of BRD2/BRD3/BRD4/YAP1 derived from Cox proportional-hazards model across pan-cancer datasets. (B) Spearman correlation coefficient (R, X axis) and P value (Y axis) of the association between YAP1 and BRD4 across pan-cancer datasets, each point represents a cancer type. (C) Relative YAP1 mRNA levels in A375 (top) and SK-MEL-28 (bottom) cells transfected with siRNA (ctrl-siRNA, siBRD2#1, siBRD2#2, siBRD3#1, siBRD3#2, siBRD4#1, siBRD4#2). (D) Representative western blots (left) and quantification (right) western blot analysis of BRD4 protein levels of control (Ctrl) or BRD4-knockout (KO1 or KO2) A375 and SK-MEL-28 cells. (E) Representative western blots (left) and quantification (right) western blot analysis of YAP1 protein levels of control or BRD4-knockout (KO1 or KO2) A375 and SK-MEL-28 cells. (F) Cell counting assays of control or BRD4-knockout (KO1 or KO2) A375 (left) and SK-MEL-28 (right) cells. (G) Representative images (left) and quantification (right) of colony formation assays of control (Ctrl) or BRD4-knockout (KO1 or KO2) A375 (left) and SK-MEL-28 (right) cells. (H) Tumor growth curves of control (Ctrl) or BRD4-knockout (KO1 or KO2) A375 tumor-bearing mice 21 days after subcutaneous implantation in nude mice (n = 8/group). (I) Representative immunofluorescence images (left) and quantification (right) of Ki67+ melanoma cells in control (Ctrl) or BRD4-knockout (KO1 or KO2) A375 tumors. Ki67, red; Melan A, green; and DAPI, blue. The scale bar is 50 μm. (J) Representative YAP1 staining (left) and IHC scoring (right) of control (EV) or BRD4-knockout (KO1 or KO2) A375 tumors. The scale bar is 50 μm. (K) Genome browser views of BRD4 ChIP-seq peaks on the YAP1 promoter: BRD4 ChIP of A375 cells treated with DMSO or 4 nM NHWD-870 for 3 days (top panel) and DMSO-treated, JQ-1-treated, or BRD4-overexpressing cells (bottom panel). (L) Model showing the effects of the BET inhibitors JQ1 and NHWD-870 on BRD4 regulation of YAP1. * p < 0.05, ** p < 0.01, *** p < 0.001. The error bars represent the SEMs.
Figure 5
Figure 5
Overexpression of YAP1 rescues the proliferation defects caused by BRD4 knockout. (A-B) Representative western blots (left) and quantification (right) of western blot analysis of BRD4 and YAP1 protein levels in control A375 (A) and SK-MEL-28 (B) cells, A375 (SK-MEL-28) cells with BRD4 KO, or A375 (SK-MEL-28) cells with BRD4 KO and YAP1 overexpression. (C-D) Cell counting assays of control A375 (C) and SK-MEL-28 (D) cells, A375 (C) and SK-MEL-28 (D) cells with BRD4 KO, or A375 (C) and SK-MEL-28 (D) cells with (BRD4 KO and YAP1 overexpression. (E-F) Representative images (left) and quantification (right) of colony formation assays of control A375 (E) and SK-MEL-28 (F) cells, A375 (E) and SK-MEL-28 (F) cells with BRD4 KO, or A375 (E) and SK-MEL-28 (F) cells with BRD4 KO and YAP1 overexpression. (G) Tumor growth curves of nude mice subcutaneously implanted with control A375 cells, A375 cells with BRD4 KO, or A375 cells with BRD4 KO and YAP1 overexpression (n = 6/group). (H) Survival of nude mice after subcutaneous implantation of control A375 cells, A375 cells with BRD4 KO, or A375 cells with BRD4 KO and YAP1 overexpression (n = 8/group). * p < 0.05, ** p < 0.01, *** p < 0.001. The error bars represent the SE = M.
Figure 6
Figure 6
Combined BET and MEK inhibition synergistically suppresses melanoma growth. (A) Representative flow cytometry plots (left) and quantification (right) of Ki67+ cells in A375 cells treated with trametinib and/or NHWD-870 for 3 days. (B-D) Inhibition effect and IC50s of trametinib and NHWD-870 combination in A375 (B), SK-MEL-28 (C) and HT-29 (D) cells. Tra, trametinib; 870, NHWD-870. (E) Combination treatment of trametinib and NHWD-870 depicted as the Fa-CI (fraction affected—combination index) plot shows synergy between the two drugs in the A375 (left), SK-MEL-28 (center) and HT-29 (right) cells. CI values of 0.1-0.3, 0.3-0.7, 0.7-0.85, and 0.85-0.90 indicate strong, medium, modest and slight synergism, respectively. CI values of 0.90-1.10 indicate nearly additive effects, and those >1.1 indicate antagonism. 8T, NHWD-870 plus trametinib. (F) Tumor growth curves of nude mice subcutaneously implanted with A375 cells and treated with 0.5 mg/kg trametinib in combination with 0.5 mg/kg NHWD-870 (n = 6-7/group). T, trametinib; 870, NHWD-870. * p < 0.05, ** p < 0.01, *** p < 0.001. The error bars represent the SEMs.
Figure 7
Figure 7
BRD4 expression is correlated with YAP1 expression and poor response and survival of patients with melanoma treated with the MEK inhibitor trametinib. (A) Representative immunofluorescence staining of tumor tissue from responders and nonresponders before and after trametinib treatment. BRD4, green; DAPI, blue. (B) BRD4 expression in tumor tissue from responders and nonresponders before and after trametinib treatment. (C) Change in BRD4 expression (BRD4post-BRD4prior) in tumor tissue from responders and nonresponders before and after trametinib treatment. (D) Kaplan‒Meier analysis of overall survival. The BRD4post-BRD4prior high group had a worse prognosis in terms of survival than the BRD4post-BRD4prior low group. (E) The change in BRD4 expression (BRD4post-BRD4prior) is positively correlated with the change in YAP1 expression (YAP1post-YAP1prior). (F) Working model summarizing the major findings. * p < 0.05, ** p < 0.01, *** p < 0.001. The error bars represent the SEMs.

Similar articles

Cited by

References

    1. Siegel RL, Miller KD, Jemal A. Cancer statistics, 2020. CA Cancer J Clin. 2020;70(1):7–30. - PubMed
    1. Simeone E, Ascierto PA. Anti-PD-1 and PD-L1 antibodies in metastatic melanoma. Melanoma Manag. 2017;4(4):175–8. - PMC - PubMed
    1. Robert C, Karaszewska B, Schachter J, Rutkowski P, Mackiewicz A, Stroiakovski D. et al. Improved overall survival in melanoma with combined dabrafenib and trametinib. N Engl J Med. 2015;372(1):30–9. - PubMed
    1. Falchook GS, Lewis KD, Infante JR, Gordon MS, Vogelzang NJ, DeMarini DJ. et al. Activity of the oral MEK inhibitor trametinib in patients with advanced melanoma: a phase 1 dose-escalation trial. Lancet Oncol. 2012;13(8):782–9. - PMC - PubMed
    1. Hanahan D, Weinberg RA. Hallmarks of cancer: the next generation. Cell. 2011;144(5):646–74. - PubMed

MeSH terms