. 2024 Jan 1;20(2):569-584.
doi: 10.7150/ijbs.89291. eCollection 2024.

MAPK1 Mediates MAM Disruption and Mitochondrial Dysfunction in Diabetic Kidney Disease via the PACS-2-Dependent Mechanism

Affiliations

MAPK1 Mediates MAM Disruption and Mitochondrial Dysfunction in Diabetic Kidney Disease via the PACS-2-Dependent Mechanism

Shanshan Liu et al. Int J Biol Sci. .

Abstract

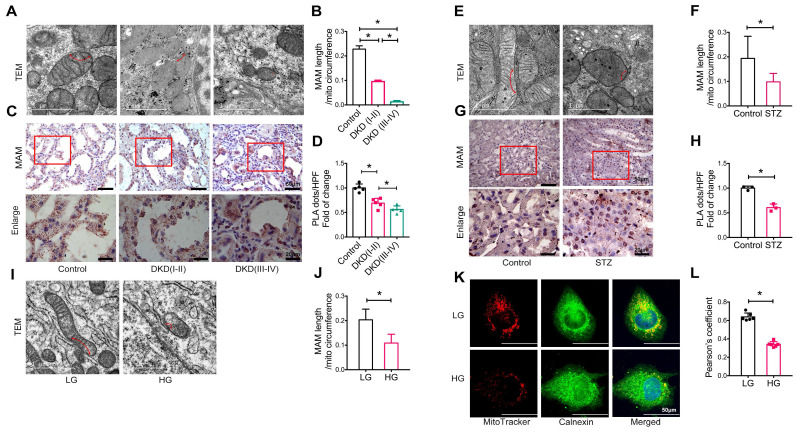
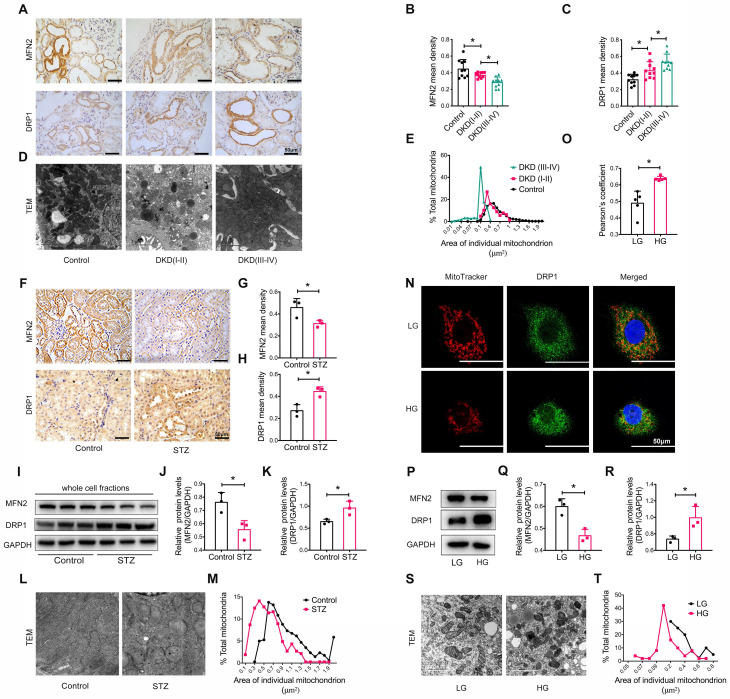
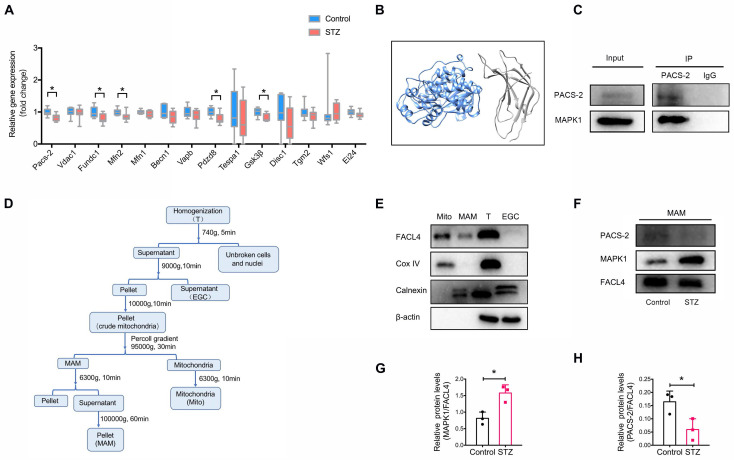
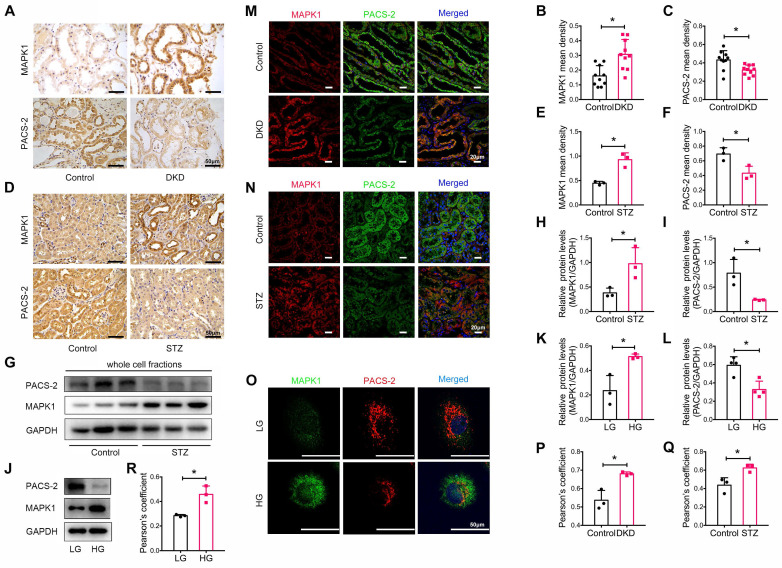
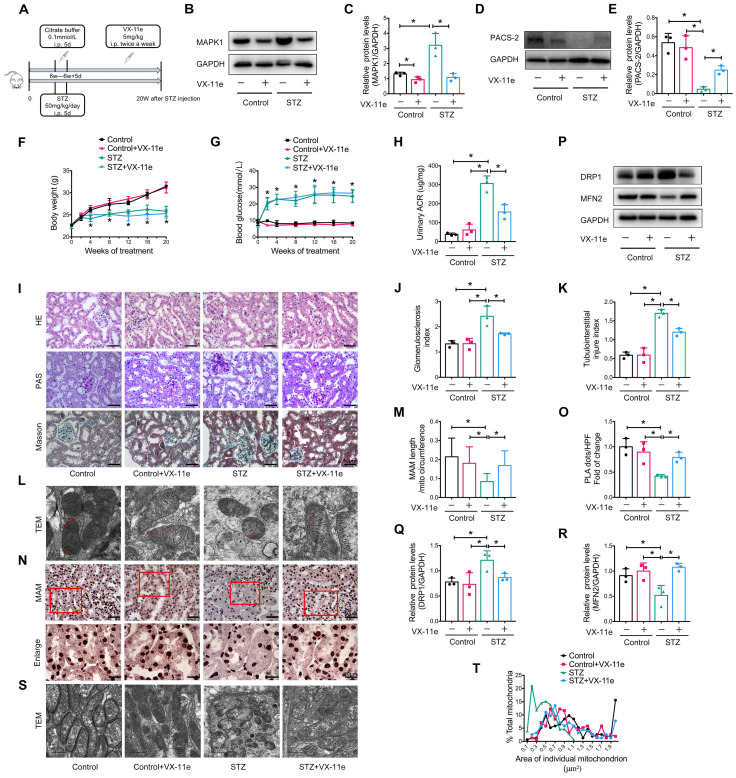
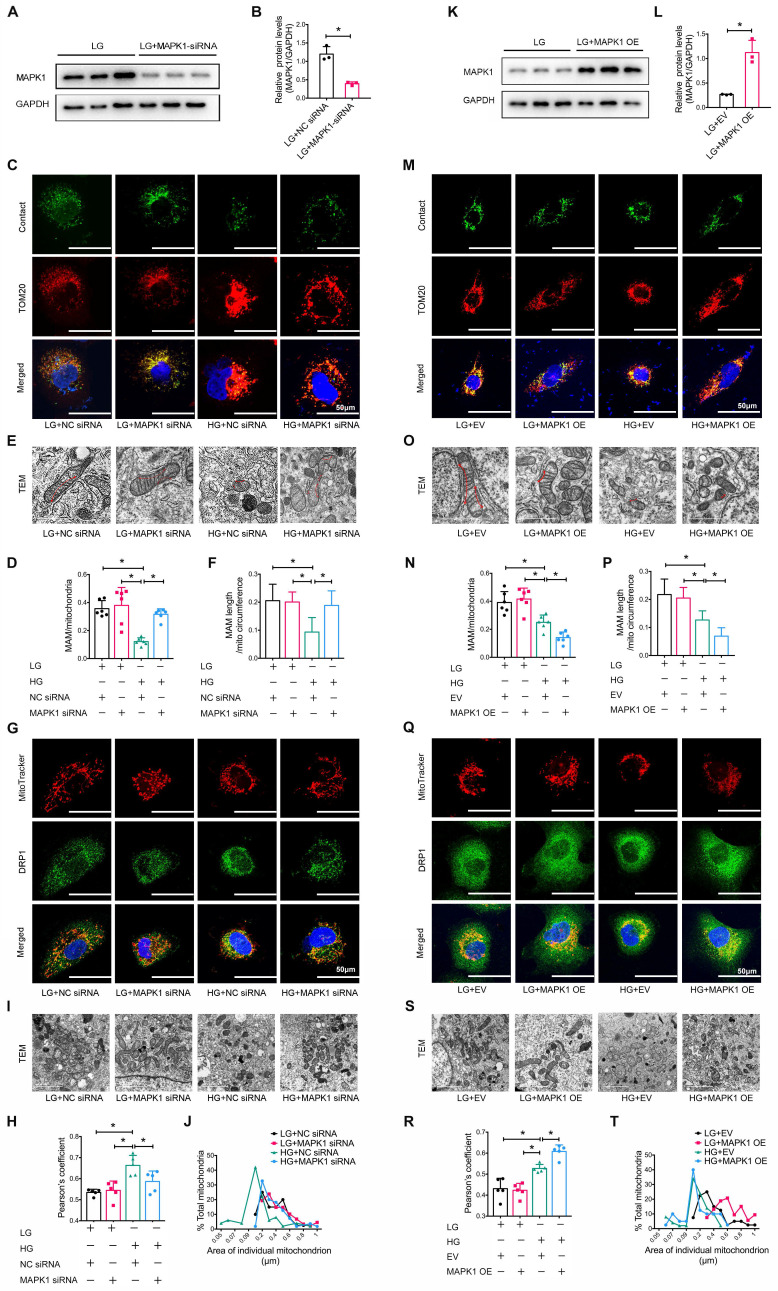
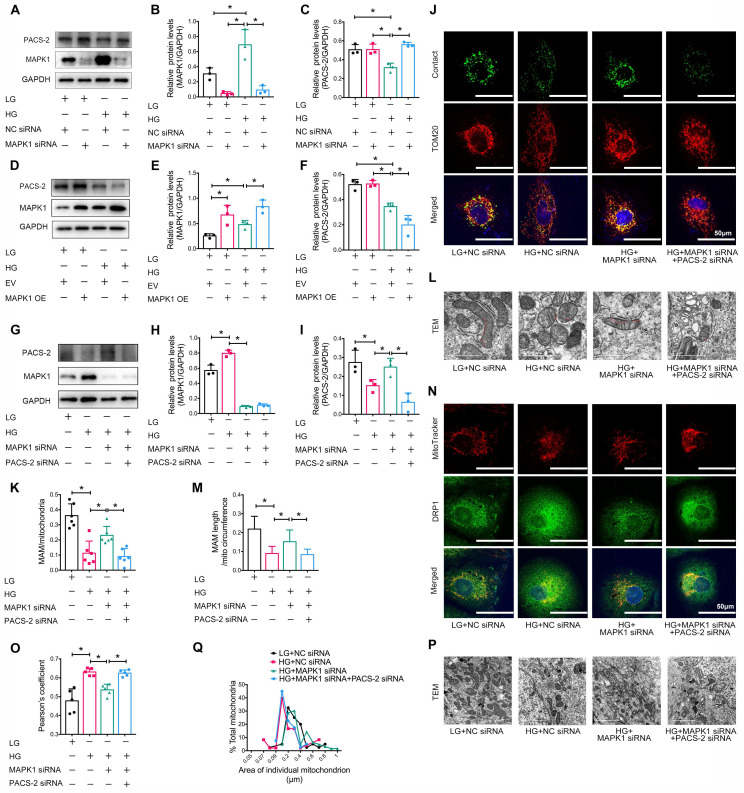
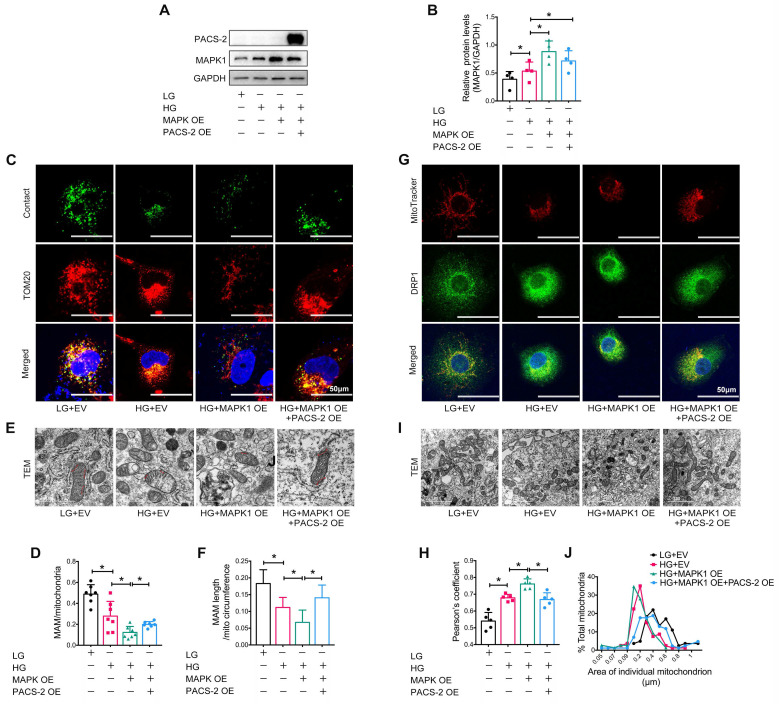
Diabetic kidney disease (DKD) is a leading cause of end-stage renal disease (ESRD). Mitochondrial dysfunction in renal tubules, occurring early in the disease, is linked to the development of DKD, although the underlying pathways remain unclear. Here, we examine diabetic human and mouse kidneys, and HK-2 cells exposed to high glucose, to show that high glucose disrupts mitochondria-associated endoplasmic reticulum membrane (MAM) and causes mitochondrial fragmentation. We find that high glucose conditions increase mitogen-activated protein kinase 1(MAPK1), a member of the MAP kinase signal transduction pathway, which in turn lowers the level of phosphofurin acidic cluster sorting protein 2 (PACS-2), a key component of MAM that tethers mitochondria to the ER. MAPK1-induced disruption of MAM leads to mitochondrial fragmentation but this can be rescued in HK-2 cells by increasing PACS-2 levels. Functional studies in diabetic mice show that inhibition of MAPK1 increases PACS-2 and protects against the loss of MAM and the mitochondrial fragmentation. Taken together, these results identify the MAPK1-PACS-2 axis as a key pathway to therapeutically target as well as provide new insights into the pathogenesis of DKD.

Keywords: MAPK1; PACS-2; diabetic kidney disease; mitochondria; mitochondria-associated endoplasmic reticulum membrane.


Conflict of interest statement

Competing Interests: The authors have declared that no competing interest exists.

Figures

Figure 1
Figure 1
Disruption of MAM integrity in renal tubules of patients with DKD, diabetic mice, and high glucose stimulated HK-2 cells. (A) TEM analysis of the length of MAM in renal tubules of healthy controls and patients with DKD. Red arrows indicate MAM regions (Scale bar, 1μm). (B) Quantification of MAM length in different groups. At least 600 MAM in each group were analyzed. (C) Number of MAM detected by in-situ PLA in tubular cells of patients with DKD and healthy controls (Scale bar, 50/20μm). (D) Relative number of PLA dots/ HPF of different groups, n=5. (E) TEM analysis of the length of MAM in renal tubules of STZ-induced diabetic mice and controls (Scale bar, 1μm). (F) Quantification of MAM length in different groups, at least 80 MAM in each group were analyzed. (G) Number of MAM detected by in-situ PLA in tubular cells of STZ-induced diabetic mice and controls (Scale bar, 50/20μm). (H) Relative number of PLA dots/HPF of diabetic and control mice, n=3. (I) TEM analysis of the length of MAM in HK-2 cells exposed to high/low glucose (Scale bar, 1μm). (J) Quantification of MAM length in different groups in HK-2 cells, at least 10 MAM in each group were analyzed. (K) Immunostaining of mitochondria (MitoTracker, red) and ER (Calnexin, green) (Scale bar, 50μm). (L) Pearson's correlation coefficient of mitochondria and ER of different groups, n=6. Data are the mean ± SD, * P < 0.05.
Figure 2
Figure 2
Tubular mitochondrial dysfunction in patients with DKD, diabetic mice, and high glucose stimulated HK-2 cells. (A) Immunohistochemistry analysis of tubular MFN2 and DRP1 in healthy controls and patients with DKD (I-II) and DKD (III-IV) (Scale bar, 50μm). (B,C) Quantification of MFN2 and DRP1 in different groups, n=10. (D) TEM analysis of mitochondrial morphology in healthy controls and patients with DKD (I-II) and DKD (III-IV) (Scale bar, 2μm). (E) Changes in the mitochondrial cross-section area in different groups. At least 2000 mitochondria in each group were analyzed. (F) Immunohistochemistry analysis of tubular MFN2 and DRP1 in STZ-induced diabetic mice (Scale bar, 50μm). (G,H) Quantification of MFN2 and DRP1, n=3. (I) Western blot analysis of MFN2 and DRP1 in renal cortices of controls and STZ-induced diabetic mice. (J,K) Quantification of MFN2 and DRP1, n=3. (L) TEM analysis of mitochondrial morphology (Scale bar, 1μm). (M) Changes in the mitochondrial cross-section area. At least 300 mitochondria in each group were analyzed. (N) Immunofluorescence of MitoTracker and DRP1 in low or high glucose stimulated HK-2 cells (Scale bar, 50μm). (O) Pearson's correlation coefficient of MitoTracker and DRP1 of different groups, n=5. (P) Western blots of MFN2 and DRP1 in low or high glucose stimulated HK-2 cells. (Q,R) Quantification of MFN2 and DPR1, n=3. (S) TEM analysis of mitochondrial morphology in low or high glucose stimulated HK-2 cells (Scale bar, 2μm). (T) Changes in the mitochondrial cross-section area. At least 40 mitochondria in each group were analyzed. Data are the mean ± SD, * P < 0.05.
Figure 3
Figure 3
Identification of potential genes associated with the disruption of MAM in diabetic mice. (A) Relative expression of genes encoding MAM-related proteins in the kidney cortex of diabetic mice and normal controls by RNA sequencing, n=9-10. (B) Three-dimensional structures showing that MAPK1 and PACS-2 likely form a protein complex, as predicted by Uni-Fold. MAPK1, in blue, is predicted to interact with the N terminus domain of PACS-2 formed between residues 1 and 154, which are colored in grey. (C) HK-2 cells stably expressing MAPK1 were immunoprecipitated using protein A/G beads. The left panels show immunoblots of MAPK1 and PACS-2 as input materials. The two panels on the right show the combination of PACS-2 and MAPK1 detected by immunoblotting following immunoprecipitation. (D) A diagram of isolation of MAM from the mouse kidney cortex. (E) Western blot analysis of MAM markers including FACL4, Cox-IV, and Calnexin. T, total cell lysate; EGC: ER, Golgi, Cytoplasm; Mito, mitochondria. (F-H) Western blot analysis of MAPK1 and PACS-2 in MAM isolated from control and diabetic mice (n = 3). Data are the mean ± SD, * P < 0.05.
Figure 4
Figure 4
Expression and co-localization of MAPK1 and PACS-2 in renal tubules of patients with DKD, diabetic mice, and high glucose stimulated HK-2 cells. (A-C) MAPK1 and PACS-2 expression in patients with DKD by immunohistochemistry, n=10 (Scale bar, 50μm). (D-F) Immunohistochemical staining shows MAPK1 and PACS-2 expression in STZ-induced diabetic mice kidneys, n=3 (Scale bar, 50μm). (G-I) Western blot analysis detects the expression of MAPK1 and PACS-2 in the kidney cortex of control and diabetic mice, n=3. (J-L) Western blot analysis detects the expression of MAPK1 and PACS-2 in low or high glucose stimulated HK-2 cells, n=3-4. (M-O) Immunofluorescence detection of co-localization of MAPK1/PACS-2 in renal tubules in controls and patients with DKD (Scale bar, 20μm), in diabetic mice (Scale bar, 20μm), and low or high glucose stimulated HK-2 cells (Scale bar, 50μm). (P-R) Pearson's correlation coefficient of MAPK1/PACS-2 in controls and patients with DKD or diabetic mice and low or high glucose stimulated HK-2 cells, n=3. Data are the mean ± SD, * P < 0.05.
Figure 5
Figure 5
Inhibition of MAPK1 increases PACS-2 and improves diabetic kidney injury in STZ-induced diabetic mice. (A) A diagram of the mouse model. (B-E) Western blot analysis of the expression of MAPK1 and PACS-2 in the kidney cortex of mice in different groups. (F-H) Effect of inhibiting MAPK1 on body weight, blood glucose, and urinary ACR of mice in different groups. (I) Effect of inhibiting MAPK1 on pathological changes determined by H&E, PAS, and Masson staining (scale bar, 50 μm). (J-K) Effect of inhibiting MAPK1 on glomerulosclerosis index (GSI) and tubulointerstitial injury index (TII). (L) TEM analysis of the length of MAM in the renal tubules of mice in different groups (Scale bar, 0.5μm). (M) Quantification of MAM length. 45 MAM in each group were analyzed. (N) In-situ PLA detection of the number of MAM in the tubular cells of mice in different groups (Scale bar, 50/20μm). (O) Quantitative analysis of PLA dots/ HPF in mice of different groups, n=3. (P-R) Western blot analysis of DRP1, MFN2 expression in renal cortices of mice in different groups. (S) TEM analysis of mitochondrial morphology in renal tubules of mice in different groups (Scale bar, 1μm). (T) The mitochondrial cross-section area. At least 150 mitochondria in each group were analyzed. Data are the mean ± SD, n=3, * P < 0.05.
Figure 6
Figure 6
Silencing or overexpression of MAPK1 improves or aggravates MAM integrity and mitochondrial dysfunction in high glucose stimulated HK-2 cells. (A-B) Western blot analysis of the expression of MAPK1 in HK-2 cells with or without MAPK1 silencing, n=3. (C-D) Immunostaining of the MAM reporter (green) and TOM20 (red) in HK-2 cells (Scale bar, 50μm), n=6. (E-F) TEM analysis of the length of MAM in HK-2 cells, at least 10 MAM in each group were analyzed (Scale bar, 1μm). (G-H) Two-color immunofluorescence detects MitoTracker (red) and DRP1 (green) in HK-2 cells (Scale bar, 50μm), n=5. (I-J) TEM analysis of mitochondrial morphology in HK-2 cells (Scale bar, 2μm), at least 40 mitochondria in each group were analyzed. (K-L) Western blot analysis of the expression of MAPK1 in HK-2 cells with or without MAPK1 overexpression, n=3. (M-N) Immunostaining of the MAM reporter (green) and TOM20 (red) in HK-2 cells (Scale bar, 50μm), n=6. (O-P) TEM analysis of the length of MAM in HK-2 cells, at least 10 MAM in each group were analyzed (Scale bar, 1μm). (Q-R) Two-color immunofluorescence of MitoTracker (red) and DRP1 (green) in HK-2 cells (Scale bar, 50μm), n=5. (S-T) TEM analysis of mitochondrial morphology in HK-2 cells (Scale bar, 2μm), at least 40 mitochondria in each group were analyzed. Data are the mean ± SD, * P < 0.05.
Figure 7
Figure 7
Silencing PACS-2 reverses the protective effect of siMAPK1 on MAM disruption and mitochondrial dysfunction in high glucose stimulated HK-2 cells. (A-C) Western blot analysis of the expression of MAPK1 and PACS-2 in HK-2 cells treated with or without siMAPK1, n=3. (D-F) Western blot analysis of MAPK1 and PACS-2 expression in HK-2 cells with or without overexpressing MAPK1, n=3. (G-I) Western blot analysis of the expression of MAPK1 and PACS-2 in HK-2 cells treated with or without siMAPK1+siPACS-2, n=3. (J-K) Immunostaining of the MAM reporter (green) and TOM20 (red) in HK-2 cells (Scale bar, 50μm), n=6. (L-M) TEM analysis of the length of MAM in HK-2 cells, at least 10 MAM in each group were analyzed (Scale bar, 1μm). (N-O) Two-color immunofluorescence of MitoTracker (red) and DRP1 (green) in HK-2 cells (Scale bar, 50μm), n=5. (P-Q) TEM analysis of mitochondrial morphology in HK-2 cells (Scale bar, 2μm), at least 40 mitochondria in each group were analyzed. Data are the mean ± SD; * P < 0.05.
Figure 8
Figure 8
PACS-2 overexpression protects against MAM disruption and mitochondrial dysfunction induced by overexpressing MAPK1 in high glucose stimulated HK-2 cells. (A-B) Western blot analysis of the expression of MAPK1 and PACS-2 in HK-2 cells with or without double overexpressing MAPK1 and PACS-2, n=4. (C-D) Immunostaining of the MAM reporter (green) and TOM20 (red) in HK-2 cells (Scale bar, 50μm), n=7. (E-F) TEM analysis of the length of the MAM in HK-2 cells, at least 10 MAM in each group were analyzed (Scale bar, 1μm). (G-H) Two-color immunofluorescence analysis of MitoTracker (red) and DRP1 (green) in HK-2 cells (Scale bar, 50μm), n=5. (I-J) TEM analysis of mitochondrial morphology in HK-2 cells (Scale bar, 2μm), at least 40 mitochondria in each group were analyzed. Data are the mean ± SD; * P < 0.05.

Similar articles

Cited by

References

    1. Saran R, Li Y, Robinson B, Abbott KC, Agodoa LY, Ayanian J. et al. US Renal Data System 2015 Annual Data Report: Epidemiology of Kidney Disease in the United States. American journal of kidney diseases: the official journal of the National Kidney Foundation. 2016;67:Svii. S1-305. - PMC - PubMed
    1. Reutens AT. Epidemiology of diabetic kidney disease. Med Clin North Am. 2013;97:1–18. - PubMed
    1. Tuttle KR, Bakris GL, Bilous RW, Chiang JL, de Boer IH, Goldstein-Fuchs J. et al. Diabetic kidney disease: a report from an ADA Consensus Conference. American journal of kidney diseases: the official journal of the National Kidney Foundation. 2014;64:510–33. - PubMed
    1. White SL, Cass A, Atkins RC, Chadban SJ. Chronic kidney disease in the general population. Adv Chronic Kidney Dis. 2005;12:5–13. - PubMed
    1. Pagliarini DJ, Calvo SE, Chang B, Sheth SA, Vafai SB, Ong SE. et al. A mitochondrial protein compendium elucidates complex I disease biology. Cell. 2008;134:112–23. - PMC - PubMed