. 2024 Jan 1;20(2):446-463.
doi: 10.7150/ijbs.86085. eCollection 2024.

VEGFA/NRP-1/GAPVD1 axis promotes progression and cancer stemness of triple-negative breast cancer by enhancing tumor cell-macrophage crosstalk

Affiliations

VEGFA/NRP-1/GAPVD1 axis promotes progression and cancer stemness of triple-negative breast cancer by enhancing tumor cell-macrophage crosstalk

Lu Wang et al. Int J Biol Sci. .

Abstract

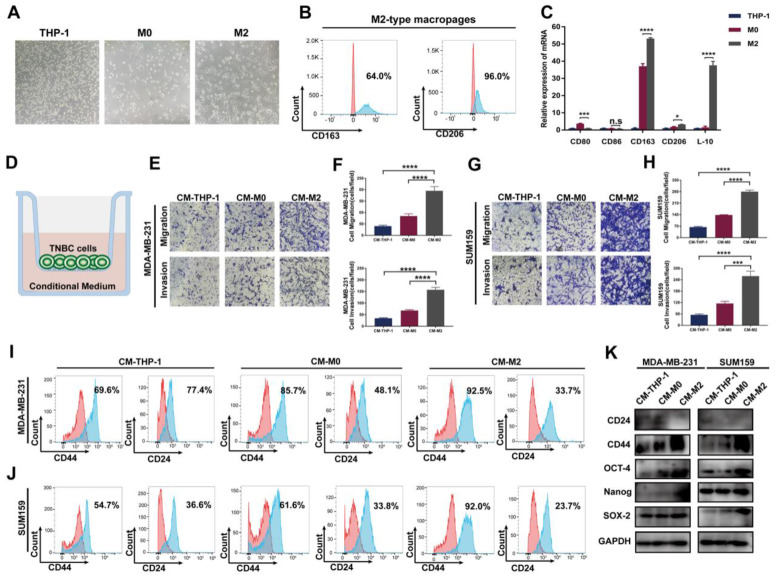
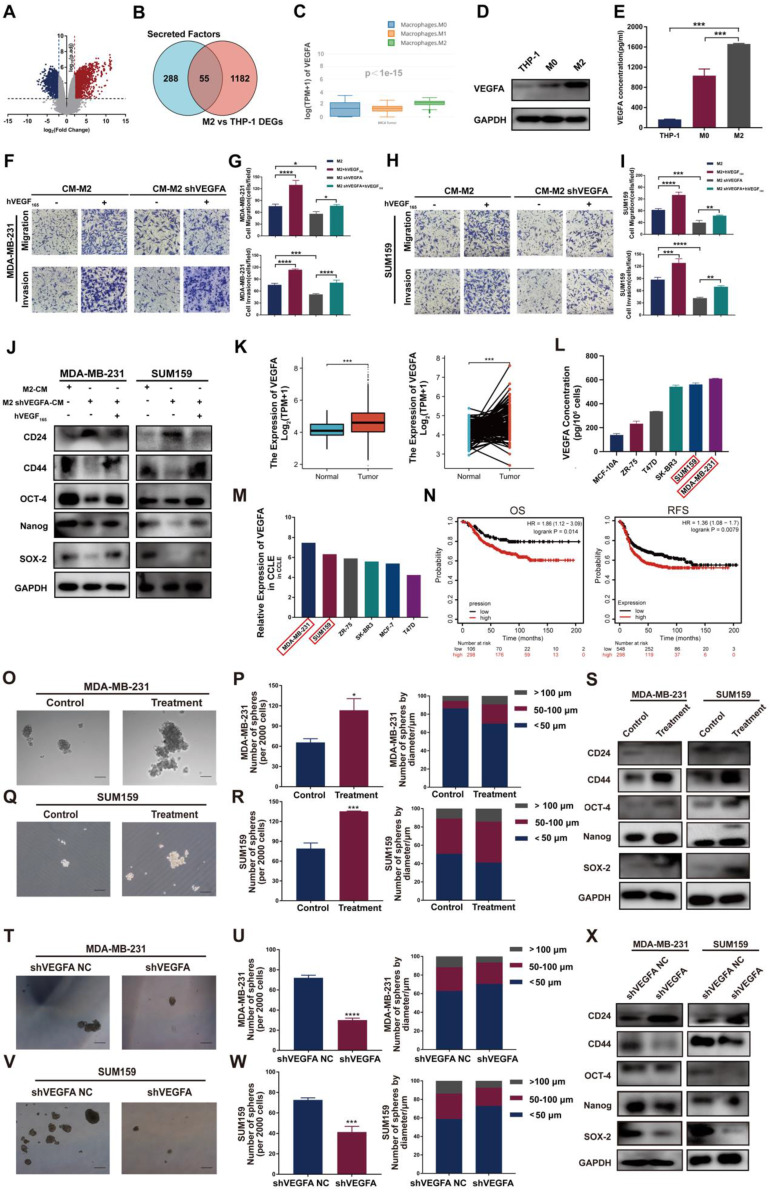
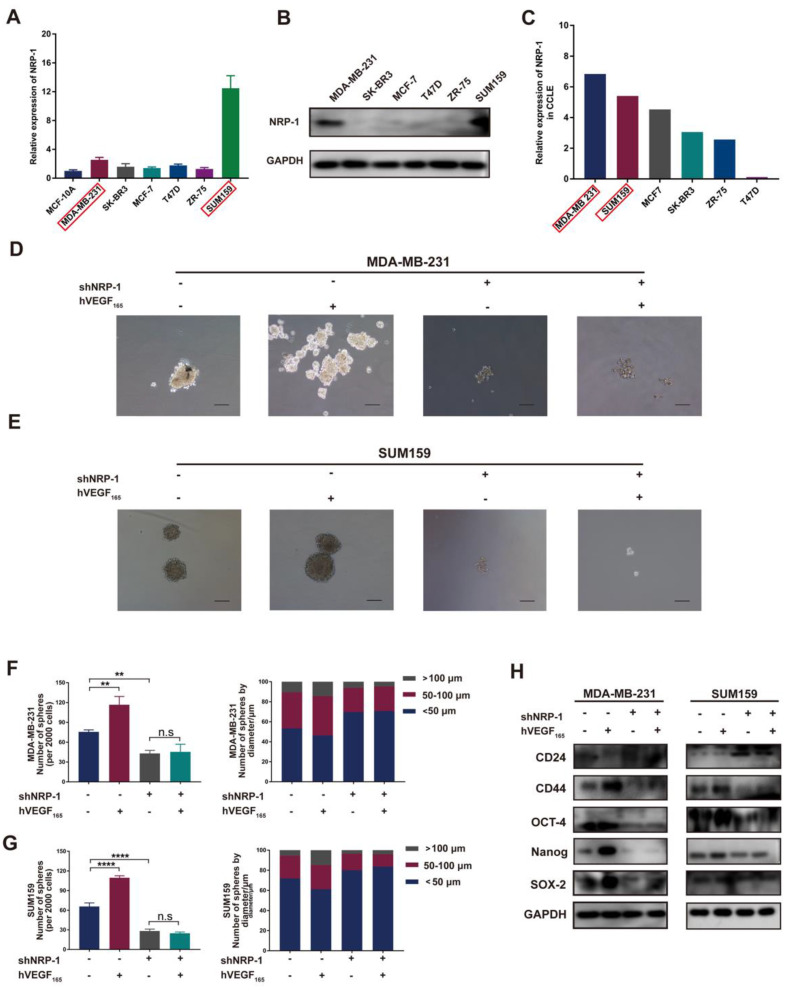
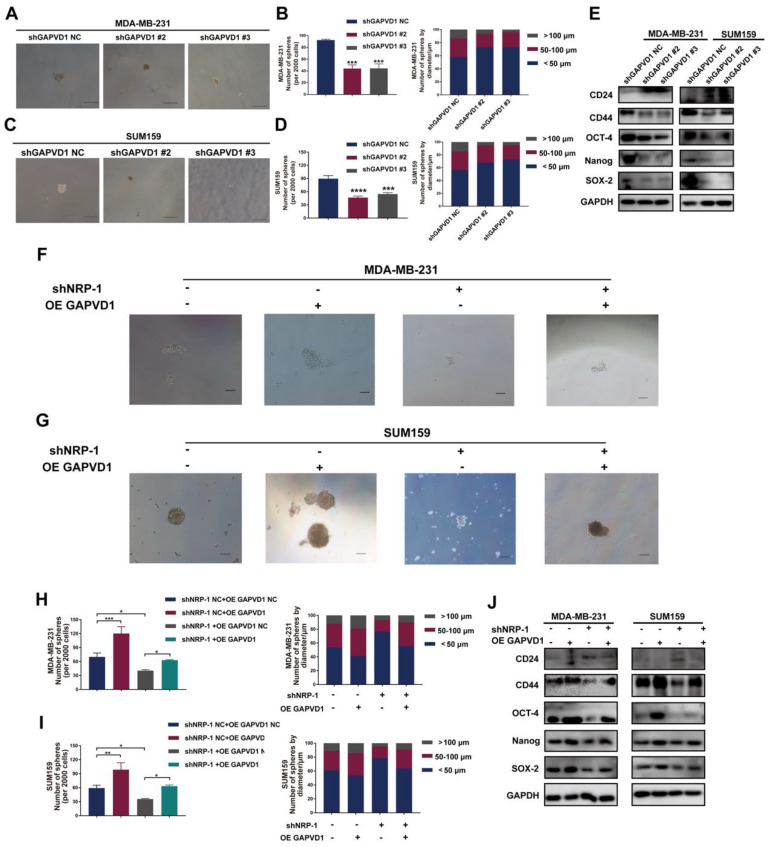
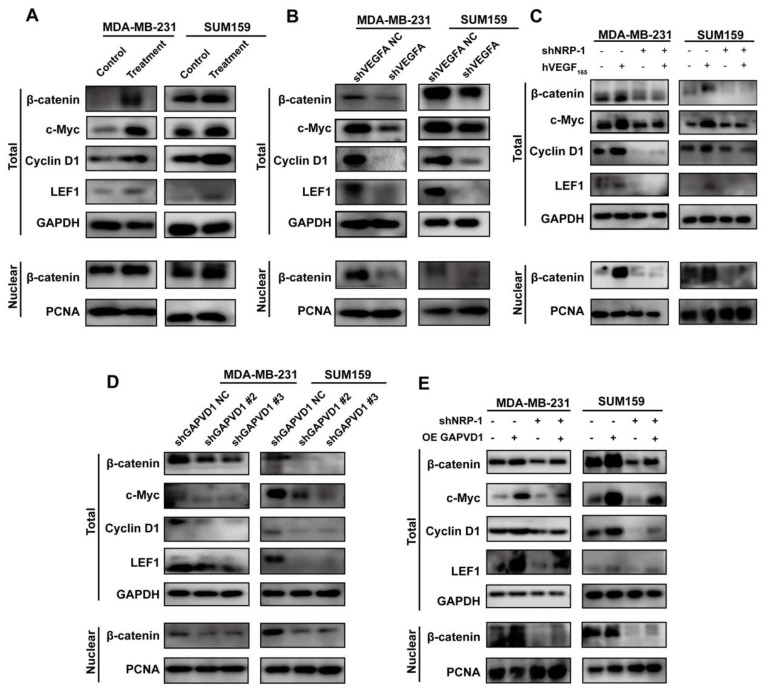
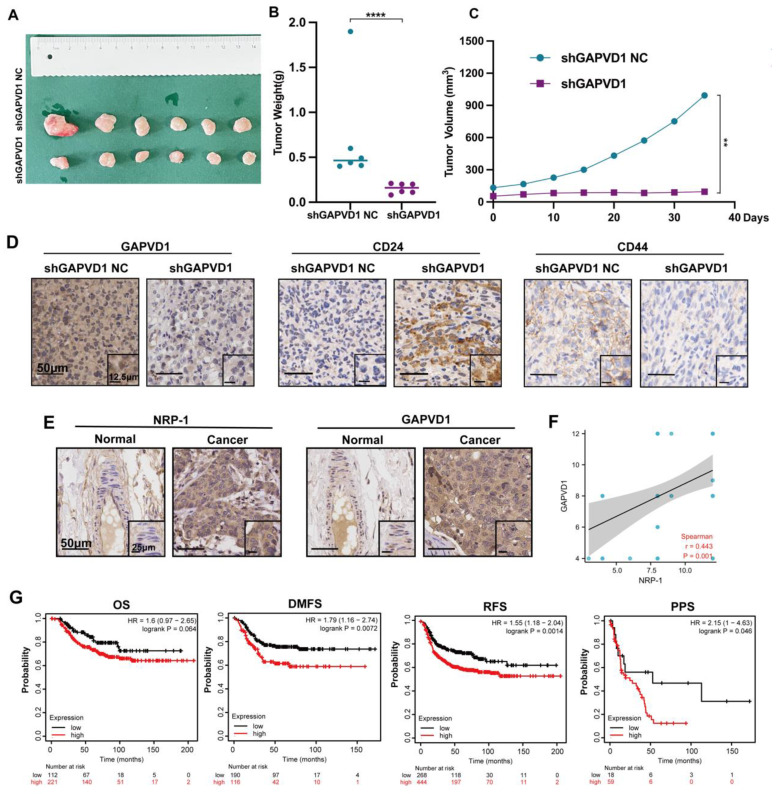
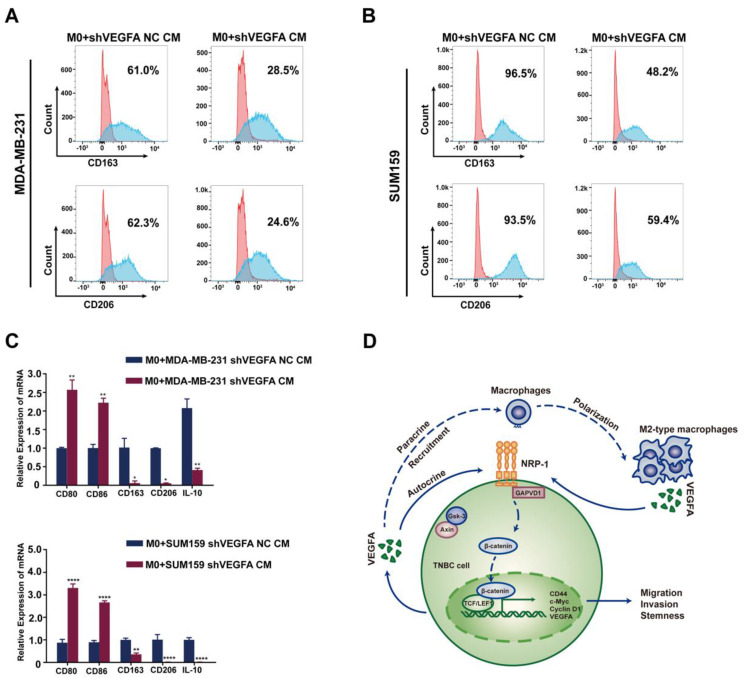
Triple-negative breast cancer (TNBC) has long been considered a major clinical challenge due to its aggressive behavior and poor prognosis. Cancer stem cells (CSCs) are known as the main cells responsible for tumor origination, progression, recurrence and metastasis. Here, we report that M2-type tumor-associated macrophages (TAMs) contribute to cancer stemness in TNBC cells via the secretion of VEGFA. Reciprocally, elevated VEGFA expression by TAM-educated TNBC cells acts as a regulator of macrophage polarization, therefore constitute a feed-back loop between TNBC cells and TAMs. Mechanistically, VEGFA facilitates the CSC phenotype via the NRP-1 receptor and downstream GAPVD1/Wnt/β-catenin signaling pathway in TNBC cells. Our study underscores the crosstalk between TNBC cells and TAMs mediated by VEGFA and further clarifies the role and underlying mechanisms of the VEGFA/NRP-1/GAPVD1 axis in regulating cancer stemness. We also document an immunosuppressive function of VEGFA in the tumor microenvironment (TME). Therefore, the present study indicates crosstalk between TNBC cells and TAMs induced by VEGFA and provides a potential implication for the combination of immunotherapy and VEGFA-targeted agents in TNBC therapy.

Keywords: Triple-negative breast cancer; VEGFA/NRP-1/GAPVD1 axis; cancer stem cell; tumor-associated macrophage..


Conflict of interest statement

Competing Interests: The authors have declared that no competing interest exists.

Figures

Figure 1
Figure 1
TAMs promote migration, invasion and cancer stemness of TNBC in vitro. (A) The cell morphology of THP-1, M0 and M2 type macrophages was observed by microscopy (100 ×). (B) Flow cytometry analysis of the expression of the M2 macrophage markers CD163 and CD206. (C) The mRNA expression of M1-related markers (CD80 and CD86) and M2-related markers (CD163, CD206 and IL-10) was evaluated by RT‒qPCR in THP-1 cells, M0-type macrophages and M2-type macrophages. (D) Schematic chart showing the coculture system. (E-H) Migration and invasion of TNBC cells after coculture with the indicated conditional medium were observed using Transwell assay (200 ×). The error bar indicates the mean ± SD. (I-J) Flow cytometry analysis of CD44 and CD24 expression on TNBC cells after coculture with the indicated conditional medium from THP-1 cells, M0-type macrophages and M2-type macrophages. (K) Western blotting of breast cancer stem cell markers (CD24, CD44, OCT-4, Nanog and SOX-2) after coculture with the indicated conditioned medium. The images show representative data, and data are expressed as the mean ± SD of each group of cells from three separate experiments. n.s., no significance, *P < 0.05, ***P < 0.001, ****P < 0.0001 vs. the controls.
Figure 2
Figure 2
VEGFA is highly expressed in M2 type TAMs and TNBC cells and generates TNBC cells with CSC phenotype. (A) Volcano plot representing the differentially expressed genes between THP-1 and M2-type macrophages. (B) Venn diagram representing the differentially expressed genes overlapping between the GEO database and GeneCard database. Blue: secretory factor gene sets in the GeneCard database. Red: differentially expressed genes between THP-1 monocytes and M2-like macrophages in the GEO database. (C) VEGFA expression in M0-, M1- and M2-type macrophages of breast cancer using the GEPIA2021 database. (D) Western blotting analysis of VEGFA expression in THP-1 cells and M0- and M2-type macrophages. (E) ELISA detection of the secretion of VEGFA in THP-1 cells and M0- and M2-type macrophages. (F-I) Migration and invasion of TNBC cells after coculture with the indicated conditional medium were determined by Transwell assay (200 ×). The error bar indicates the mean ± SD. (J) Western blotting of breast cancer stem cell markers (CD24, CD44, OCT-4, Nanog and SOX-2) in TNBC cells after coculture with the indicated conditioned medium in the presence or absence of 10 ng/ml hVEGF165. (K) VEGFA mRNA expression in nonpaired (left panel, adjacent noncancerous tissue n=113, cancer tissue n=1113) and paired (right panel, n = 113) breast cancer samples from the TCGA database. The error bar indicates the mean ± SD. (L) The secretion of VEGFA from different breast cancer cell lines was assessed by ELISA. (M) VEGFA expression in different breast cancer cell lines from the CCLE database. (N) Kaplan-Meier analysis to compare the OS (high n=298, low n=106) and RFS (high n=298, low n=548) of TNBC patients with high and low VEGFA mRNA expression using the TCGA database. (O-R) Representative images of the microspheres formed after treatment of TNBC cells with 10 ng/ml hVEGF165 (Treatment). The number of microspheres was counted and plotted, and the percentage of microspheres with diameters of < 50 μm, 50-100 μm and > 100 μm was calculated and plotted (200 ×, scale bars = 100 μm). (S) Western blotting of breast cancer stem cell markers (CD24, CD44, OCT-4, Nanog and SOX-2) in TNBC cells after treatment with 10 ng/ml hVEGF165. (T-W) Representative images of the microspheres after VEGFA knockdown (shVEGFA) in TNBC cells. The number of microspheres was counted and plotted, and the percentage of microspheres with diameters of < 50 μm, 50-100 μm and > 100 μm was calculated and plotted (200 ×, scale bars = 100 μm). (X) Western blotting of breast cancer stem cell markers (CD24, CD44, OCT-4, Nanog and SOX-2) in TNBC cells after VEGFA knockdown. The images show representative data, and data are expressed as the mean ± SD of each group of cells from three separate experiments. n.s., no significance, *P < 0.05, **P < 0.01, ***P < 0.001, ****P < 0.0001 vs. the controls.
Figure 3
Figure 3
VEGFA promotes the CSC phenotype via NRP-1. (A-B) The mRNA and protein levels of NRP-1 in different breast cancer cell lines were detected by RT‒qPCR and Western blotting. (C) NRP-1 mRNA expression in different breast cancer cell lines from the CCLE database. (D-G) Representative images of microspheres after NRP-1 knockdown (shNRP-1) in the presence or absence of 10 ng/ml hVEGF165. The number of microspheres was counted and plotted, and the percentage of microspheres with diameters of < 50 μm, 50-100 μm and > 100 μm was calculated and plotted (200 ×, scale bars = 100 μm). (H) Western blotting of breast cancer stem cell markers (CD24, CD44, OCT-4, Nanog and SOX-2) in TNBC cells after NRP-1 knockdown in the presence or absence of 10 ng/ml hVEGF165. The images show representative data, and data are expressed as the mean ± SD of each group of cells from three separate experiments. n.s., no significance, **P < 0.01, ****P < 0.0001 vs. the controls.
Figure 4
Figure 4
GAPVD1 interacts with NRP-1 and is regulated by the VEGFA/NRP-1 axis. (A) GAPVD1 mRNA expression in nonpaired (left panel, adjacent noncancerous tissue n=113, cancer tissue n=1113) and paired (right panel, n=113) breast cancer samples from the TCGA database. The error bar indicates the mean ± SD. (B) GAPVD1 protein expression in breast cancer tissue from the HPA database. (C) Correlation between GAPVD1 and NRP-1, ALDH1, CD44, and CD24 mRNA expression in human breast cancer samples from the TCGA dataset. (D-E) Coimmunoprecipitation of NRP-1 with the GAPVD1 antibody from TNBC whole-cell extracts. Precipitation with normal rabbit IgG was used as a negative control. (F) Western blotting of GAPVD1 after treatment with 10 ng/ml hVEGF165 in TNBC cells. (G) Western blotting of GAPVD1 after VEGFA knockdown in TNBC cells. (H) Western blotting of GAPVD1 after NRP-1 knockdown in the presence or absence of 10 ng/ml hVEGF165. The images show representative data, and data are expressed as the mean ± SD of each group of cells from three separate experiments. n.s., no significance, *P < 0.05, **P < 0.01 vs. the controls.
Figure 5
Figure 5
The VEGFA/NRP-1 axis promotes TNBC cell progression and stemness via GAPVD1. (A-D) Representative images of microspheres after GAPVD1 knockdown (shGAPVD1#2 and shGAPVD1#3) in TNBC cells. The number of microspheres was counted and plotted, and the percentage of microspheres with diameters of < 50 μm, 50-100 μm and > 100 μm was calculated and plotted (200 ×, scale bars = 100 μm). (E) Western blotting analysis of breast cancer stem cell markers (CD24, CD44, OCT-4, Nanog and SOX-2) in TNBC cells after GAPVD1 knockdown. (F-I) Representative images of microspheres after GAPVD1 overexpression (OE GAPVD1) in control and NRP-1-silencing TNBC cells. The number of microspheres was counted and plotted, and the percentage of microspheres with diameters of < 50 μm, 50-100 μm and > 100 μm was calculated and plotted (200 ×, scale bars = 100 μm). (J) Western blotting analysis of breast cancer stem cell markers (CD24, CD44, OCT-4, Nanog and SOX-2) after GAPVD1 overexpression in control and NRP-1-silencing TNBC cells. The images show representative data, and data are expressed as the mean ± SD of each group of cells from three separate experiments. *P < 0.05, **P < 0.01, ***P < 0.001, ****P < 0.0001 vs. the controls.
Figure 6
Figure 6
The VEGFA/NRP-1/GAPVD1 axis targeted the downstream Wnt/β-catenin signaling pathway. (A) Western blotting analysis of β-catenin and Wnt/β-catenin downstream targets in TNBC cells after treatment with 10 ng/ml hVEGF165. (B) Western blotting analysis of β-catenin and Wnt/β-catenin downstream targets in TNBC cells after VEGFA knockdown (shVEGFA). (C) Western blotting analysis of β-catenin and Wnt/β-catenin downstream targets in TNBC cells after NRP-1 knockdown (shNRP-1) in the presence or absence of 10 ng/ml hVEGF165. (D) Western blotting analysis of β-catenin and Wnt/β-catenin downstream targets in TNBC cells after GAPVD1 knockdown (shGAPVD1#2 and shGAPVD1#3). (E) Western blotting analysis of β-catenin and Wnt/β-catenin downstream targets in control and NRP-1-silencing TNBC cells after GAPVD1 overexpression (OE GAPVD1). The images show representative data, and data are expressed as the mean ± SD of each group of cells from three separate experiments. *P < 0.05, **P < 0.01, ****P < 0.0001 vs. the controls.
Figure 7
Figure 7
GAPVD1 inhibition impedes tumor growth and cancer stemness in vivo, and a high level of GAPVD1 indicates a poor prognosis in TNBC. (A) Diagram of xenograft tumors in NOD/SCID mice. Female NOD/SCID mice were randomized and inoculated with MDA-MB-231/shGAPVD1 NC (control group) or MDA-MB-231/shGAPVD1 cells (GAPVD1 knockdown group), and the growth of implanted breast tumors was monitored. (B) Tumor weight in the indicated groups. (C) The growth curve of inoculated breast tumors. (D) Representative IHC images of GAPVD1 and stem cell marker (CD24 and CD44) expression in xenograft tumors. (E) Representative IHC images of NRP-1 and GAPVD1 in a tissue microarray (adjacent noncancerous breast specimens n=5, TNBC specimens n=50). (F) Correlation analysis of NRP-1 and GAPVD1 expression in tissue microarray specimens. (G) Kaplan‒Meier analysis of the OS (high n=221, low n=112), DMFS (high n=116, low n=190), RFS (high n=444, low n=268) and PPS (high n=59, low n=18) of TNBC patients displaying high or low GAPVD1 expression. The images show representative data, and data are expressed as the mean ± SD of each group. **P < 0.01, ****P < 0.0001 vs. the controls.
Figure 8
Figure 8
TNBC cell-derived VEGFA promotes TAM polarization into M2 type and schematic of the crosstalk between TAMs and TNBC cells. (A-B) Flow cytometry analysis of the expressions of M2 macrophage markers (CD163 and CD206) after co-cultured with conditional medium from control TNBC cells or VEGFA-silencing TNBC cells. (C) RT-qPCR analysis of M1-related markers (CD80 and CD86) and M2-related markers (CD163, CD206 and IL-10) expression after co-cultured with conditional medium from control TNBC cells or VEGFA-silencing TNBC cells. The images show representative data, and data are expressed as the mean ± SD of each group of cells from three separate experiments. *P < 0.05, **P < 0.01, ****P < 0.0001 vs. the controls. (D) Schematic of the crosstalk between TAMs and TNBC cells mediated by VEGFA in the promotion of breast cancer stemness. VEGFA (secreted by TAMs in a paracrine manner and by TNBC cells in an autocrine manner) binds to NRP-1 and activates the downstream GAPVD1/Wnt/β-catenin signaling pathway to promote the stemness of TNBC. Additionally, VEGFA may provide an immunosuppressive microenvironment for tumor progression by recruiting TAMs and facilitating the M2 polarization of TAMs.

References

    1. Miller KD, Fidler-Benaoudia M, Keegan TH. et al. Cancer statistics for adolescents and young adults, 2020. CA Cancer J Clin. 2020;70(6):443–459. - PubMed
    1. Boyle P. Triple-negative breast cancer: epidemiological considerations and recommendations. Ann Oncol. 2012;23(Suppl 6):vi7–12. - PubMed
    1. Zuo B, Qi H, Lu Z. et al. Alarmin-painted exosomes elicit persistent antitumor immunity in large established tumors in mice. Nat Commun. 2020;11(1):1790. - PMC - PubMed
    1. Hill BS, Sarnella A, D'Avino G. et al. Recruitment of stromal cells into tumour microenvironment promote the metastatic spread of breast cancer. Semin Cancer Biol. 2020;60:202–213. - PubMed
    1. Wagner J, Rapsomaniki MA, Chevrier S. et al. A Single-Cell Atlas of the Tumor and Immune Ecosystem of Human Breast Cancer. Cell. 2019;177(5):1330–1345. e1318. - PMC - PubMed

MeSH terms

Substances