

Analysis of morphological and quantitative changes in pathological myopia and perioperative changes in posterior scleral reinforcement using three-dimensional magnet resonance imaging
- PMID: 38169632
- PMCID: PMC10758413
- DOI: 10.3389/fbioe.2023.1242440
Analysis of morphological and quantitative changes in pathological myopia and perioperative changes in posterior scleral reinforcement using three-dimensional magnet resonance imaging
Abstract
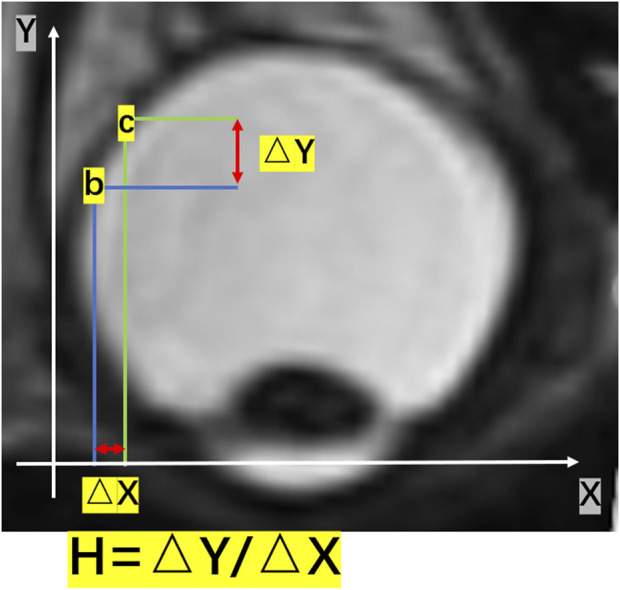
Objective: To compare the morphological and quantitative changes in pathological myopia (PM) and the perioperative changes in posterior scleral reinforcement (PSR) using three-dimensional magnetic resonance images (3D MRI). Methods: A total of 49 patients with high myopia (HM; 98 eyes), 15 with pathological myopia (PM; 19 eyes), and 10 without high myopia (NORM; 20 eyes) were recruited between September 2019 and July 2021. The patients underwent measurements of refractive error and axial length, as well as 3D MRI of the eyeball. Python was used to analyze the 3D MRI images, calculate the vitreous volume, establish a topography of the height of the eyeball posterior surface, and calculate the rate of change in height (H). For the PM group undergoing PSR, changes in vitreous volume and the highest point of the eyeball posterior surface in four quadrants (temporal, subtemporal, nasal, and subnasal) were compared before and after PSR. Results: The vitreous volume was smaller in the NORM group compared to the HM and PM groups (p < 0.01). The PM group had a larger volume than the HM group (p < 0.01). The H for the PM group was higher than that of the NORM and HM groups (p < 0.01). After PSR in the PM group, the total vitreous volume, as well as the volume in the subnasal and supratemporal quadrants, decreased (p < 0.05). Additionally, the highest point of the eyeball's posterior surface was generally shifted to the upper nasal side. Finally, the shape and position of the scleral band after PSR were plotted. Conclusion: 3D MRI is capable of a quantitative description of the eyeball morphology in PM and PSR. It allows for precise calculations of changes in vitreous volume and the H of the posterior surface. It also facilitates a meticulous analysis of the specific details of the scleral band following PSR.
Keywords: 3D MRI; high myopia; pathological myopia; posterior scleral reinforcement (PSR); posterior staphyloma.
Copyright © 2023 Liu, Rong, Wu, Xu, He, Du, Zhang and Wei.
Conflict of interest statement
The authors declare that the research was conducted in the absence of any commercial or financial relationships that could be construed as a potential conflict of interest.
Figures


References
-
- Cao K., Wang J., Zhang J., Yusufu M., Jin S., Zhu G., et al. (2020). The effectiveness and safety of posterior scleral reinforcement with vitrectomy for myopic foveoschisis treatment: a systematic review and meta-analysis. Graefes Arch. Clin. Exp. Ophthalmol. 258 (2), 257–271. 10.1007/s00417-019-04550-5 - DOI - PubMed
LinkOut - more resources
Full Text Sources
Other Literature Sources