. 2024 Jan 1;20(2):516-536.
doi: 10.7150/ijbs.84399. eCollection 2024.

p32 regulates glycometabolism and TCA cycle to inhibit ccRCC progression via copper-induced DLAT lipoylation oligomerization

Affiliations

p32 regulates glycometabolism and TCA cycle to inhibit ccRCC progression via copper-induced DLAT lipoylation oligomerization

Shaoping Tian et al. Int J Biol Sci. .

Abstract

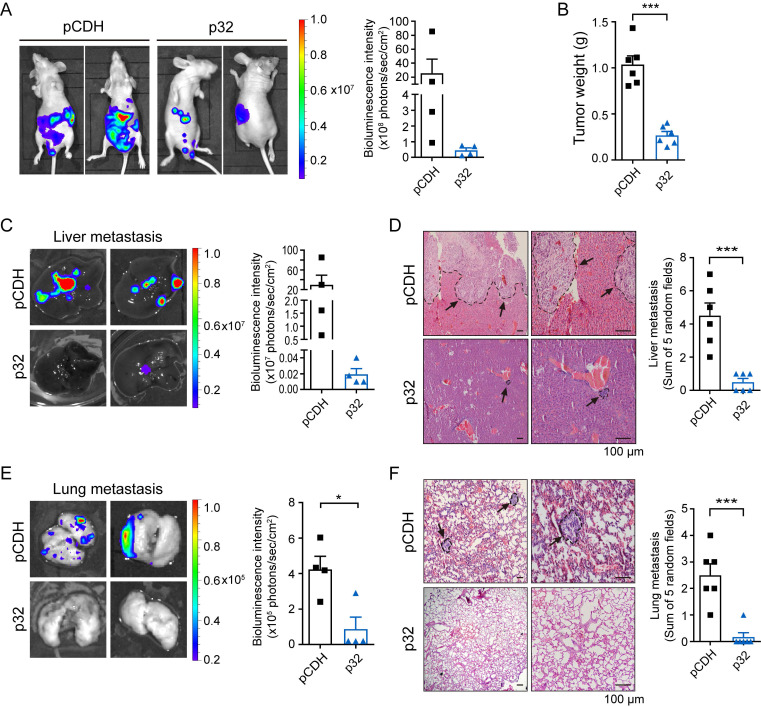
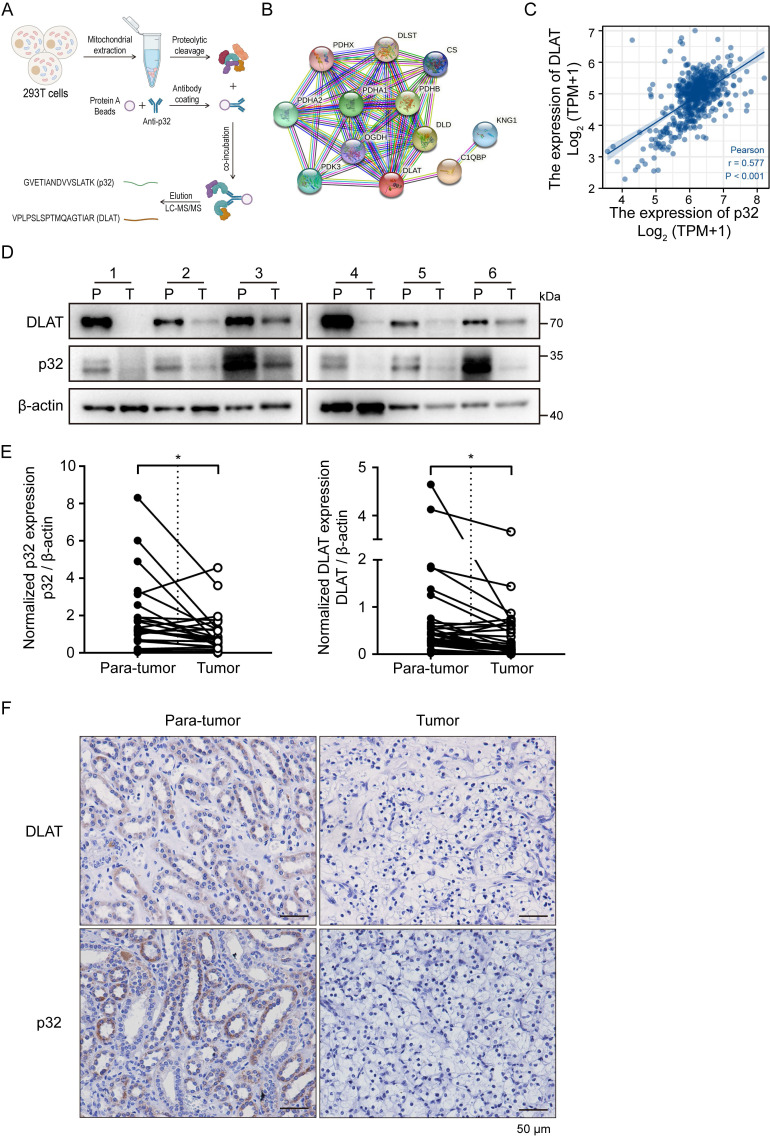
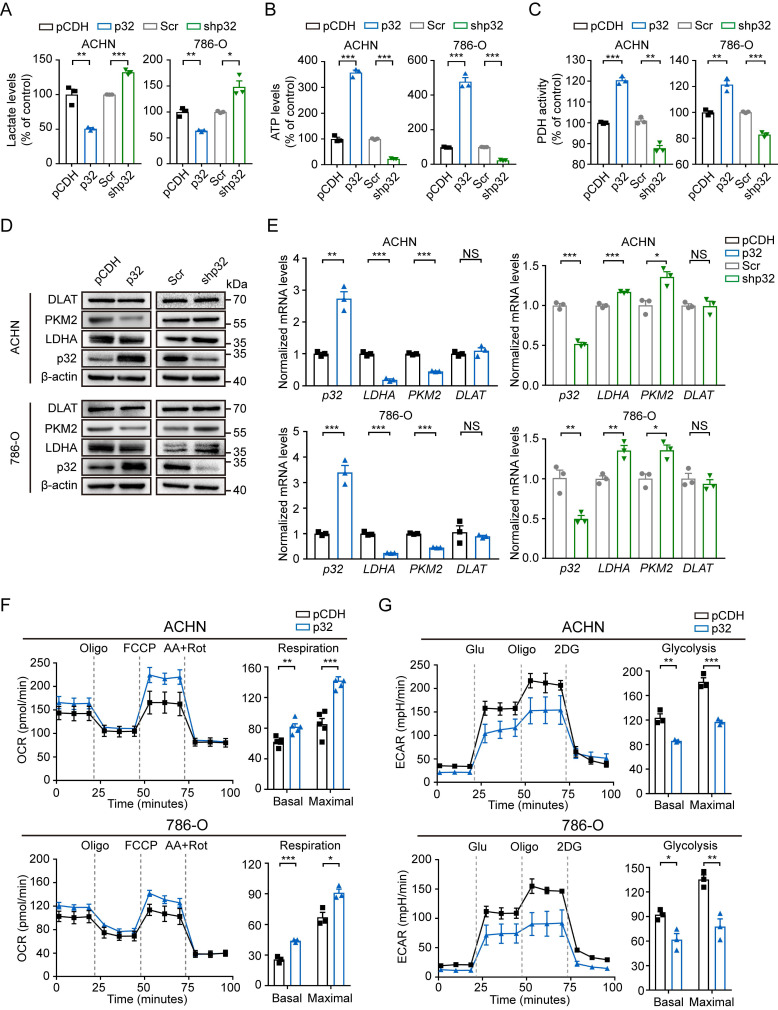
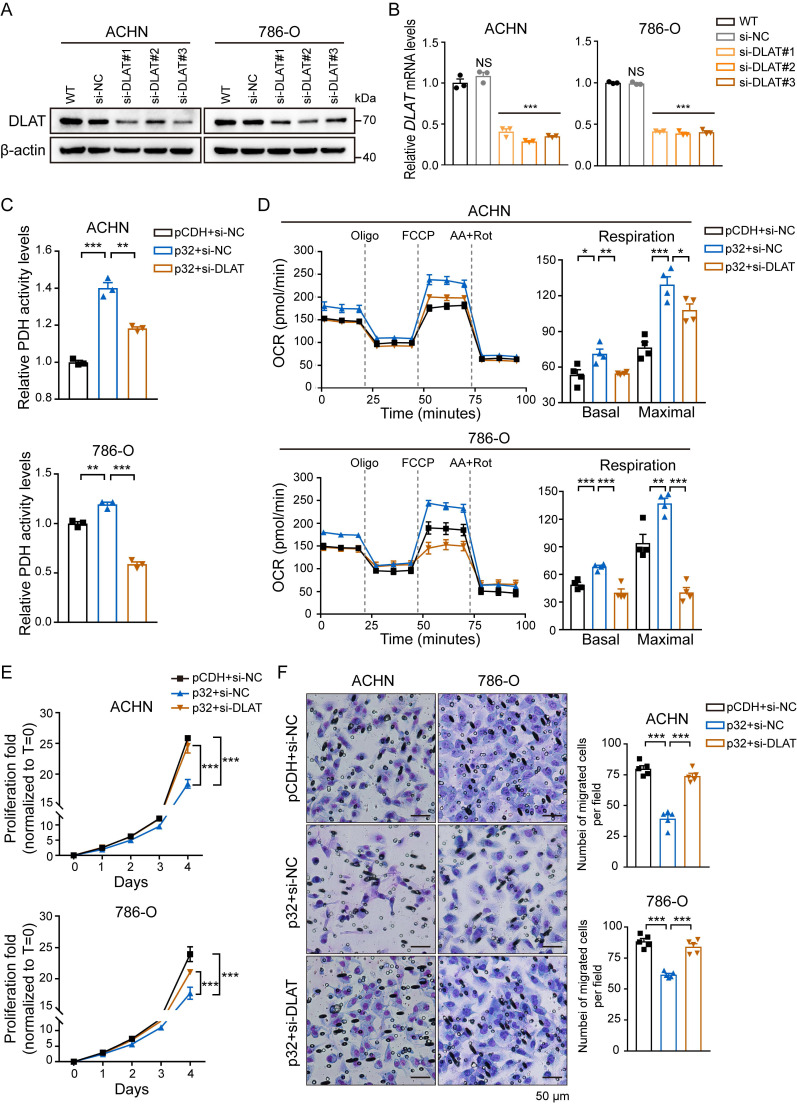
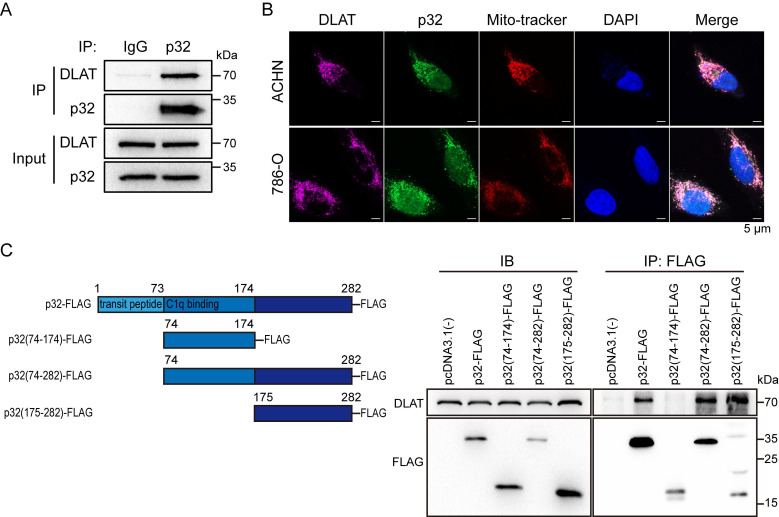
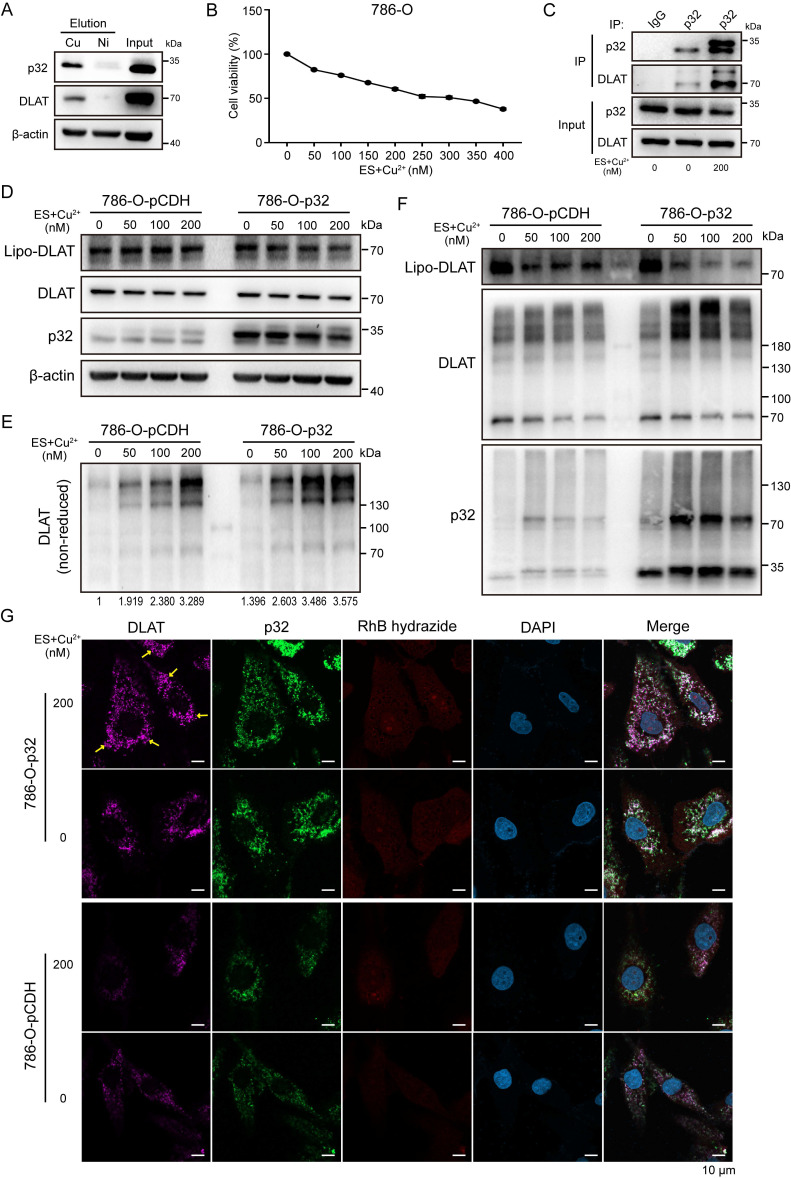
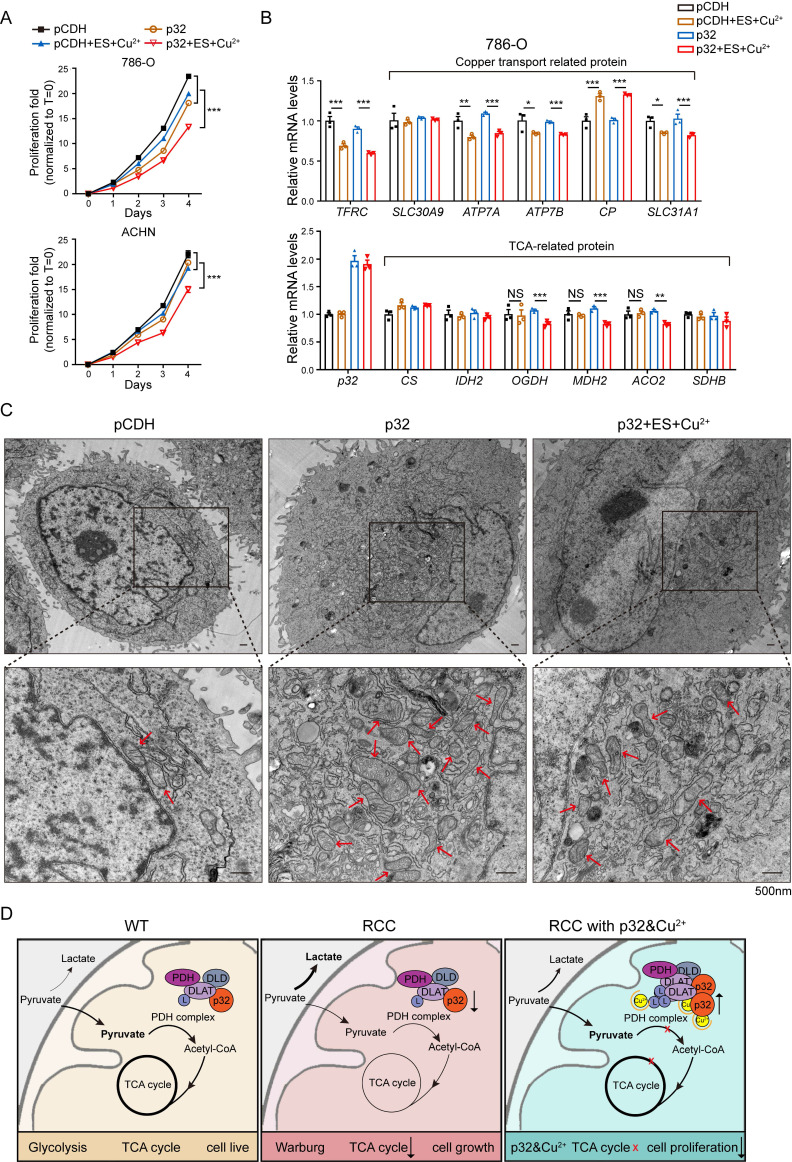
A key player in mitochondrial respiration, p32, often referred to as C1QBP, is mostly found in the mitochondrial matrix. Previously, we showed that p32 interacts with DLAT in the mitochondria. Here, we found that p32 expression was reduced in ccRCC and suppressed progression and metastasis in ccRCC animal models. We observed that increasing p32 expression led to an increase in oxidative phosphorylation by interacting with DLAT, thus, regulating the activation of the pyruvate dehydrogenase complex (PDHc). Mechanistically, reduced p32 expression, in concert with DLAT, suppresses PDHc activity and the TCA cycle. Furthermore, our research discovered that p32 has a direct binding affinity for copper, facilitating the copper-induced oligomerization of lipo-DLAT specifically in ccRCC cells. This finding reveals an innovative function of the p32/DLAT/copper complex in regulating glycometabolism and the TCA cycle in ccRCC. Importantly, our research provides important new understandings of the underlying molecular processes causing the abnormal mitochondrial metabolism linked to this cancer.

Keywords: Clear cell renal cell carcinoma; Copper; DLAT; glycometabolism; p32; tricarboxylic acid cycle.


Conflict of interest statement

Competing Interests: The authors have declared that no competing interest exists.

Figures

Figure 1
Figure 1
p32 inhibits proliferation and metastasis of ccRCC in vivo. (A) Luciferase-expressing p32-overexpression and pCDH-control ACHN cells were injected into the left sub-renal capsule of nude mice and then raised for 8 weeks (n=6). After anesthetized nude mice and injected fluorescein intraperitoneally for 10 minutes, luminescence intensity derived from tumors was measured by IVIS imaging system, and representative bioluminescence images were shown (left panel). Right panel showed quantitative analysis of bioluminescence intensity in nude mice (n=4, P=0.256). (B) Statistical analysis of in situ tumor weight, expressed as the weight of the left minus the corresponding right kidney of nude mice (n=6, P<0.001). (C) Liver and (E) lung of nude mice were isolated, and bioluminescence intensity was detected by IVIS imaging system (left panel). Right panel showed quantitative analysis of liver and lung bioluminescence intensity (n=4, Liver P=0.1901, Lung P=0.0153). (D) Liver and (F) lung metastatic foci were observed after H&E staining, indicated by black arrows (left panel). Metastatic foci in the liver and lung were quantified and compared using five random microscopic views (right panel, n=6, Live P=0.0005, Lung P=0.0005). Data represent the mean ± SEM of three independent experiments. P-values were determined by unpaired two-tailed Student's t-test.
Figure 2
Figure 2
Correlation between p32 and DLAT at the clinical tissue sample levels. (A) Schematic diagram showed the identification of proteins interacting with p32 in mitochondria by mass spectrometry. (B) A network map of proteins predicted to interact with p32 using the STRING database (https://cn.string-db.org/). (C) Correlation analysis between the expression levels of p32 and DLAT in the TCGA-KIRC data set (n=539, r=0.577, P<0.001). (D) Representative immunoblot images of p32 and DLAT protein levels in para-tumor (P) and tumor (T) tissues of 6 primary renal cell carcinoma patients. (E) The expression of p32 (left panel) and DLAT (right panel) was normalized with β-actin and quantified by Image J software in 30 primary RCC patients. The analysis was used paired two-tailed Student's t-test, n=30, p32 P=0.0146, DLAT P=0.0129, respectively. (F) Immunohistochemistry staining was used to examine the expression of p32 and DLAT in a study cohort consisting of 75 pairs of adjacent normal kidney tissues (Para-tumor) and RCC tissues (Tumor). Representative images were provided, where the presence of brown signals indicated positive staining.
Figure 3
Figure 3
p32 regulates ccRCC glucose metabolism towards OXPHOS. (A) Lactate levels, (B) ATP levels and (C) PDH activity were examined with p32 overexpression and knockdown in ACHN (left panel) and 786-O cells (right panel) (n=3). (D) Representative immunoblot showed the level of glycolysis-related protein PKM2 and LDHA after p32 overexpression and knockdown in ACHN (upper panel) and 786-O cells (lower panel). (E) Quantitative RT-PCR analysis measured LDHA and PKM2 relative mRNA levels in p32-overexpressed ACHN cells (upper left panel), p32-overexpressed 786-O cells (lower left panel), p32-knockdown ACHN cells (upper right panel) and p32-knockdown 786-O cells (lower right panel) (n=3). (F) p32-overexpressed ACHN cells (upper panel, n=5) and 786-O cells (lower panel, n=3) were seeded in Seahorse XFe24 cell culture plates and sequential treated with oligomycin (Oligo), FCCP and rotenone plus antimycin A (Rot/AA). Bar graphs showed quantified basal and maximal OCR. (G) Representative Seahorse analysis of extracellular acidification rate (ECAR) in p32-overexpressed ACHN cells (upper panel, n=3) and 786-O cells (lower panel, n=3). Bar graphs showed quantified basal and maximal ECAR. Data was analyzed by unpaired two-tailed Student's t-test. All error bars displayed mean ± SEM of three independent experiments. Statistically significant differences were indicated: *P<0.05, **P<0.01, ***P<0.001. NS: no significant difference.
Figure 4
Figure 4
p32 regulates OXPHOS and tumor progression via DLAT in ccRCC. DLAT knockdown by using three independent DLAT siRNAs (si-DLAT#1, si-DLAT#2, si-DLAT#3) in ACHN and 786-O cells were evidenced by (A) western blot and (B) real-time PCR (n=3). (C) ACHN and 786-O cells were transfected with pCDH+si-NC, p32+si-NC, p32+si-DLAT, and then the level of PDH activity was measured after 48h (n=3). (D) Detection of intracellular oxygen consumption levels and quantification basal and maximal OCR after transfection (n=4). (E) Cell Counting Kit-8 reagent was used to measure the cell proliferation in treated ACHN and 786-O cells (n=3). (F) Left panels: the representative migration images of treated ACHN and 786-O cells, Right panels: Random five fields of view counting the number of cells per field. The results were the mean ± SEM of three independent experiments., P-values were determined by unpaired two-tailed Student's t-test. Statistically significant differences were indicated: *P<0.05, **P<0.01, ***P<0.001.
Figure 5
Figure 5
p32 and DLAT interactive with each other and colocalize. (A) Co-immunoprecipitation of DLAT with p32 in ACHN cells. (B) Fluorescence images of colocalization of p32, DLAT and mitochondria in ACHN (upper panel) and 786-O (lower panel). Mito-tracker probes labeled mitochondria via mitochondrial membrane potential. (C) Left panel: schematic representation of the FLAG-tagged p32 domain protein peptides. Right panel: Co-IP analysis showed interaction of DLAT with p32 (aa 175-282) after plasmid transfection into 293T cells for 48h.
Figure 6
Figure 6
p32 promotes copper-induced oligomerization of lipo-DLAT in ccRCC cells. (A) Immunoblotting showed the binding of the 786-O cells' indicated proteins to copper (Cu) and nickel (Ni) of eluted proteins from the indicated metal-IDA beads. (B) Cell survival rate after treatment with 0-400 nM concentration gradient of elesclomol and CuSO4 in 786-O cells. (C) Western blot showed the co-immunoprecipitation of DLAT and p32 in 786-O cells after treating with or without 200nM elesclomol and CuSO4 for 24 h. 786-O-pCDH and 786-O-p32 cells were treated with concentration gradients of elesclomol and CuSO4, and the cellular proteins were extracted. (D) Western blotting showed the expression of the specified protein indicators after protein denaturation, (E) Non-reducing western blotting showed the expression of DLAT oligomers and (F) Western blotting showed the expression of the specified protein indicators after crosslinking protein. The relative quantification of the gray value of the bands was analysised with ImageJ software. (G) Immunofluorescence images showed the expression of indicated proteins after treating with or without 200nM elesclomol and CuSO4 for 24 h in 786-O-pCDH and 786-O-p32 cells. The yellow arrow pointed to the DLAT foci.
Figure 7
Figure 7
p32 promotes copper-induced TCA cycle disruption in ccRCC. (A) Cell proliferation after treating 786-O cells with or without 200 nM elesclomol and CuSO4 or treating ACHN cells with or without 400 nM elesclomol and CuSO4 (n=4). (B) Quantitative RT-PCR analysis measured TFRC, SLC30A9, ATP7A, ATP7B, CP and SLC31A1 relative mRNA levels (upper panel) and CS, IDH2, OGDH, MDH2, ACO2 and SDHB relative mRNA levels (lower panel) in 786-O cells with or without treatment of 200 nM elesclomol and CuSO4 (n=3). (C) The representative pictures of the morphology of mitochondria in cells under the transmission electron microscope. Higher magnification views of the indicated areas are shown on the bottom.The red arrows refer to the mitochondria. (D) The mechanism of p32 promoting copper-induced DLAT lipoylation oligomerization, thereby affecting TCA cycle to inhibit the proliferation of ccRCC. The results were the mean ± SEM of three independent experiments., P-values were determined by unpaired two-tailed Student's t-test. Statistically significant differences were indicated: *P<0.05, **P<0.01, ***P<0.001.

Similar articles

Cited by

References

    1. Sung H, Ferlay J, Siegel RL, Laversanne M, Soerjomataram I, Jemal A. et al. Global Cancer Statistics 2020: GLOBOCAN Estimates of Incidence and Mortality Worldwide for 36 Cancers in 185 Countries. CA Cancer J Clin. 2021;71:209–49. - PubMed
    1. Moch H, Cubilla AL, Humphrey PA, Reuter VE, Ulbright TM. The 2016 WHO Classification of Tumours of the Urinary System and Male Genital Organs-Part A: Renal, Penile, and Testicular Tumours. Eur Urol. 2016;70:93–105. - PubMed
    1. Saeednejad Zanjani L, Madjd Z, Axcrona U, Abolhasani M, Rasti A, Asgari M. et al. Cytoplasmic expression of B7-H3 and membranous EpCAM expression are associated with higher grade and survival outcomes in patients with clear cell renal cell carcinoma. Ann Diagn Pathol. 2020;46:151483. - PubMed
    1. Zhang G, Wu Y, Zhang J, Fang Z, Liu Z, Xu Z. et al. Nomograms for predicting long-term overall survival and disease-specific survival of patients with clear cell renal cell carcinoma. Onco Targets Ther. 2018;11:5535–44. - PMC - PubMed
    1. Linehan WM, Srinivasan R, Schmidt LS. The genetic basis of kidney cancer: a metabolic disease. Nat Rev Urol. 2010;7:277–85. - PMC - PubMed