. 2023 Nov 21;3(12):100440.
doi: 10.1016/j.xgen.2023.100440. eCollection 2023 Dec 13.

Natural history of Ebola virus disease in rhesus monkeys shows viral variant emergence dynamics and tissue-specific host responses

Affiliations

Natural history of Ebola virus disease in rhesus monkeys shows viral variant emergence dynamics and tissue-specific host responses

Erica Normandin et al. Cell Genom. .

Abstract

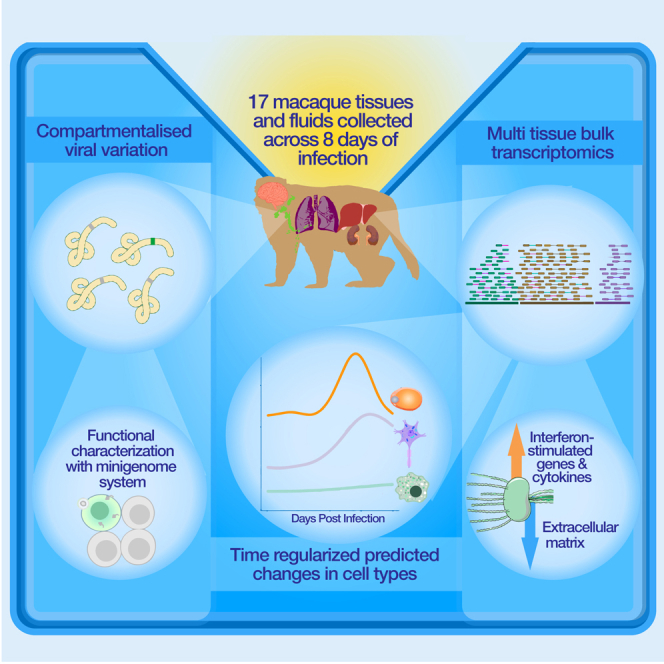
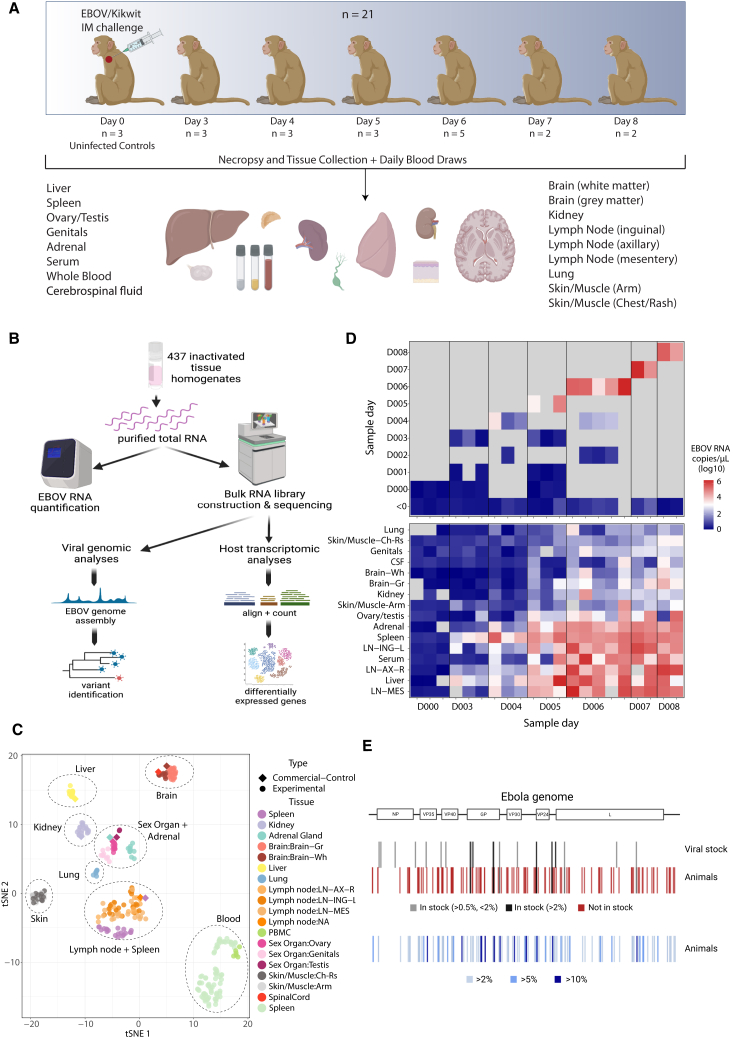
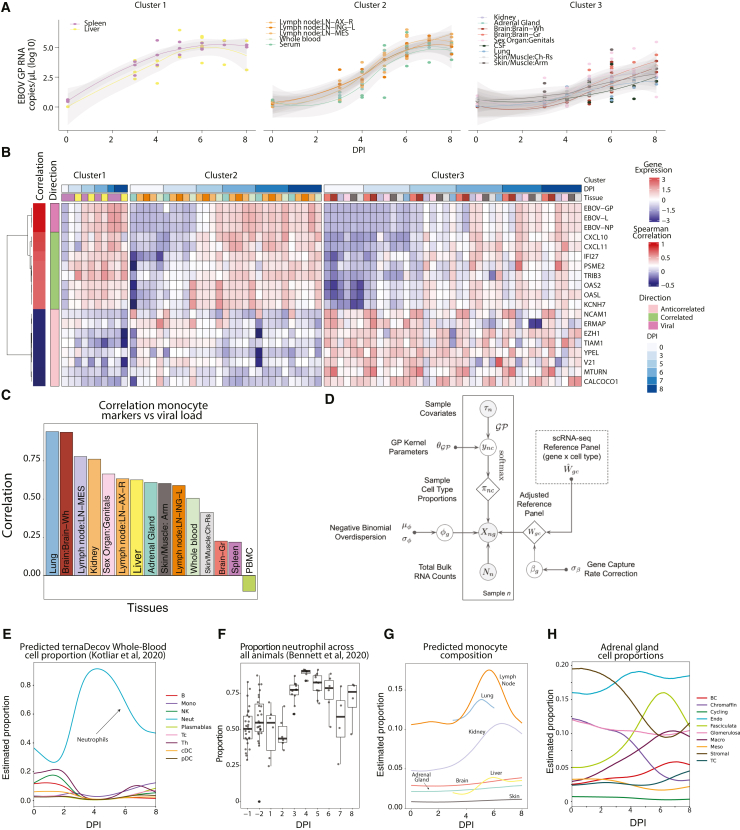
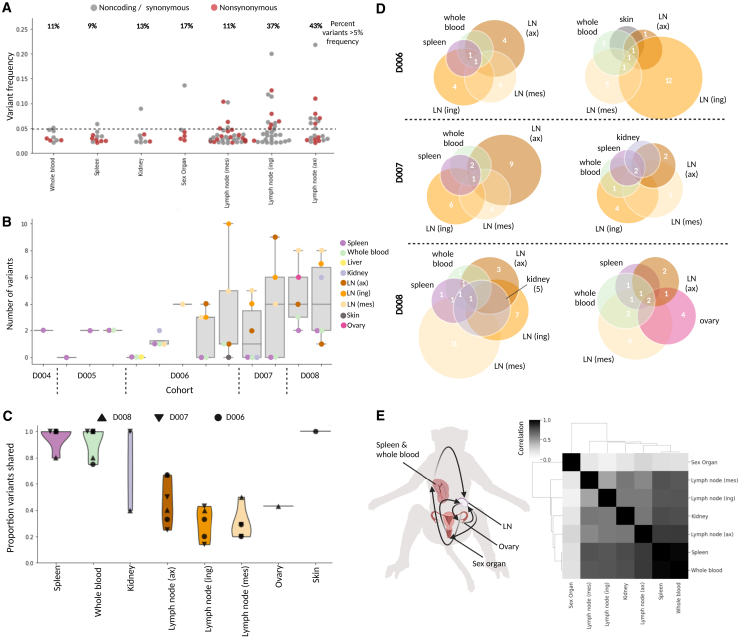
Ebola virus (EBOV) causes Ebola virus disease (EVD), marked by severe hemorrhagic fever; however, the mechanisms underlying the disease remain unclear. To assess the molecular basis of EVD across time, we performed RNA sequencing on 17 tissues from a natural history study of 21 rhesus monkeys, developing new methods to characterize host-pathogen dynamics. We identified alterations in host gene expression with previously unknown tissue-specific changes, including downregulation of genes related to tissue connectivity. EBOV was widely disseminated throughout the body; using a new, broadly applicable deconvolution method, we found that viral load correlated with increased monocyte presence. Patterns of viral variation between tissues differentiated primary infections from compartmentalized infections, and several variants impacted viral fitness in a EBOV/Kikwit minigenome system, suggesting that functionally significant variants can emerge during early infection. This comprehensive portrait of host-pathogen dynamics in EVD illuminates new features of pathogenesis and establishes resources to study other emerging pathogens.

Keywords: Ebola virus; Ebola virus disease; deconvolution; hemorrhagic fevers; host-virus interactions; minigenome; non-human primates; transcriptomics; viral variants.


Conflict of interest statement

P.C.S. is a co-founder and shareholder of Sherlock Biosciences and Delve Bio, a board member and shareholder of Danaher Corporation, and has filed IP related to genomic sequencing and diagnostic technologies. A.K.S. reports compensation for consulting and/or scientific advisory board (SAB) membership from Merck, Honeycomb Biotechnologies, Cellarity, Repertoire Immune Medicines, Ochre Bio, Third Rock Ventures, Hovione, Relation Therapeutics, FL82, FL86, Empress Therapeutics, IntrECate Biotherapeutics, Senda Biosciences, and Dahlia Biosciences unrelated to this work. F.Z. is a scientific advisor and cofounder of Editas Medicine, Beam Therapeutics, Pairwise Plants, Arbor Biotechnologies, and Aera Therapeutics. F.Z. is a scientific advisor for Octant.

Figures

None
Graphical abstract
Figure 1
Figure 1
Study overview (A) Description of the animal study and dataset, including the number of animals, time points, and samples collected. (B) Schematization of study design and experimental and analytical workflow. (C) t-distributed stochastic neighbor embedding (tSNE) plot of transcriptional signatures, demonstrating that unique tissues cluster together and with commercial controls of the same type. (D) Viral load across time in whole blood (top) and across tissues and other fluids at necropsy (bottom) for each animal, ordered by time between infection and necropsy. Colors represent viral RNA as log10(copies/μL), as assessed by qRT-PCR; gray represents no data. (E) Viral variants across the EBOV genome identified in infecting viral stock and infected animals. Variants, designated by lines, are colored by their presence in stock (top) and frequency in infected animals (bottom). Images were created with BioRender.
Figure 2
Figure 2
Correlating viral dynamics and host response to infection (A) Viral loads, as determined by qRT-PCR, plotted versus time. The trajectories for different tissues were separated into three distinct patterns using K-means longitudinal data clustering, yielding groups of tissues with similar viral load dynamics. (B) Gene expression across tissues (separated by the clusters in A) for the top 8 correlated and anti-correlated DEGs and 3 representative viral genes. Samples are ordered along the x axis by tissue and DPI. On the y axis, DEGs are clustered and labeled by direction. (C) Correlation between viral load and canonical monocyte marker expression across each tissue. (D) Overview of modular deconvolution framework used in ternaDecov. The output proportions from the models are then used to draw observed sample counts from a negative binomial distribution based on the provided single-cell profiles. (E) Deconvolution of whole blood using scRNA-seq data confirms the detected increase in neutrophils at 4 DPI. (F) Proportion of neutrophils across samples using Sysmex XT-2000iV automated hematology by flow cytometry. (G) Deconvolution of monocyte composition across time for each tissue based on an scRNA-seq reference of Macaca fascicularis. (H) Deconvolution of predicted cell type proportion across time for adrenal glands.
Figure 3
Figure 3
Host transcriptomics across tissues and time (A) Number of DEGs between non-infected and infected samples; tissues with more than 5 DEGs are shown in the plot. (B) PCA of log2 fold changes of significantly DEGs between infected and uninfected samples. Top contributing genes for PC1 and PC2 are highlighted. (C) Heatmap of fold-changes of top DEGs across tissues, stratified by meaningful gene categories; stars marks significant differential expression (FDR < 0.05). (D) Left: heatmap of genes changing significantly across time for brain. Right: gene expression changes across time for selected genes. Colors atop plots designate gray (light red) and white matter (dark red). (E) Same as (D) but for lymph nodes (shades of orange) and spleen (purple); colors atop plots designate tissues. (F) Gene Ontology (GO) term analysis of genes differentially expressed (top 100 FDR < 0.01) across time as determined by ImpulseDE2. Enriched terms were determined per tissue, and the top 3 GO terms, as determined by Kolmogorov-Smirnov (KS) test, per tissue were selected for display. Colors of circles correspond to −log10(KS pval) of the enriched term within tissue, and sizes of circles correspond to odds ratio.
Figure 4
Figure 4
Minor viral variants show compartmentalization and circulation (A) Frequencies of all nonsynonymous (red) and synonymous/noncoding (gray) variants that emerged during infection, plotted and separated by tissue; the percentage of variants above 5% frequency (dotted line) is given above each tissue. (B) For each animal (ordered by DPI), the number of variants that emerged in every tissue (samples with >400× mean viral coverage). (C) Violin plot showing the proportion of shared viral variants, separated by tissue; each point represents a unique animal, and symbols demonstrate DPI. (D) Schematic representing variants that are shared (numbers displayed in overlapping circles) and not shared (numbers displayed in non-overlapping circles) in all tissues available for 6 animals (2 of each the D6, D7, and D8 cohorts). (E) Left: schematic of viral circulation among tissues, based on the variant profiles (image created with BioRender). Right: a Spearman correlation of different tissues’ variant profiles, concatenated across animals.
Figure 5
Figure 5
Viral adaptation and fitness effects (A) Top: number of emergent variants per 1,000 bp (gray) were quantified for each gene-coding region as well as proportion of nonsynonymous variants (red). Bottom: accumulation of total (gray) and nonsynonymous (red) variants in specific gene regions was quantified using a sliding window of 200 bp. (B) Genomic locations of variants selected for further functional testing (red) among all variants identified across the EBOV genome (black). (C) Schematic of the EBOV/Kikwit transcription- and replication-competent virus-like particle (trVLP) minigenome system that recapitulates the wild-type and variant viral life cycle in a host cell (image created with BioRender). (D) Flow cytometry analysis of the percentage of GFP+ cells 48 h post minigenome transfection as a percentage of infected host cells by seed stock (wild type [WT]) or viral variants in GP, RNP, and VP24. Error bars represent standard deviation.

References

    1. Jacob S.T., Crozier I., Fischer W.A., 2nd, Hewlett A., Kraft C.S., Vega M.A.d.L., Soka M.J., Wahl V., Griffiths A., Bollinger L., Kuhn J.H. Ebola virus disease. Nat. Rev. Dis. Prim. 2020;6:13. - PMC - PubMed
    1. Hartman A.L., Towner J.S., Nichol S.T. Ebola and marburg hemorrhagic fever. Clin. Lab. Med. 2010;30:161–177. - PubMed
    1. Misasi J., Sullivan N.J. Camouflage and misdirection: the full-on assault of ebola virus disease. Cell. 2014;159:477–486. - PMC - PubMed
    1. Center for Biologics Evaluation, and Research . 2020. ERVEBO. U.S. Food and Drug Administration.https://www.fda.gov/vaccines-blood-biologics/ervebo
    1. Office of the Commissioner . U.S. Food and Drug Administration; 2020. FDA Approves First Treatment for Ebola Virus.https://www.fda.gov/news-events/press-announcements/fda-approves-first-t...

Publication types