

Fluorescent bioinspired albumin/polydopamine nanoparticles and their interactions with Escherichia coli cells
- PMID: 38169939
- PMCID: PMC10760463
- DOI: 10.3762/bjnano.14.100
Fluorescent bioinspired albumin/polydopamine nanoparticles and their interactions with Escherichia coli cells
Abstract
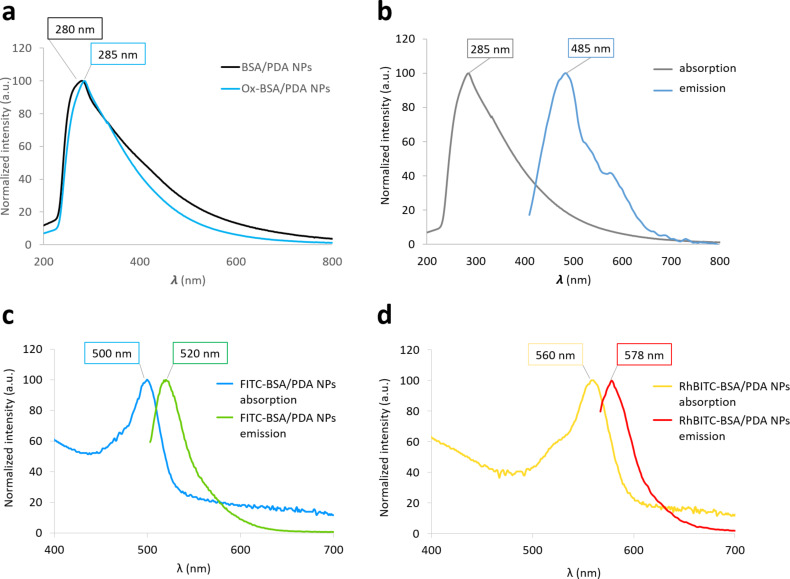
Inspired by the eumelanin aggregates in human skin, polydopamine nanoparticles (PDA NPs) are promising nanovectors for biomedical applications, especially because of their biocompatibility. We synthesized and characterized fluorescent PDA NPs of 10-25 nm diameter based on a protein containing a lysine-glutamate diad (bovine serum albumin, BSA) and determined whether they can penetrate and accumulate in bacterial cells to serve as a marker or drug nanocarrier. Three fluorescent PDA NPs were designed to allow for tracking in three different wavelength ranges by oxidizing BSA/PDA NPs (Ox-BSA/PDA NPs) or labelling with fluorescein 5-isothiocyanate (FITC-BSA/PDA NPs) or rhodamine B isothiocyanate (RhBITC-BSA/PDA NPs). FITC-BSA/PDA NPs and RhBITC-BSA/PDA NPs penetrated and accumulated in both cell wall and inner compartments of Escherichia coli (E. coli) cells. The fluorescence signals were diffuse or displayed aggregate-like patterns with both labelled NPs and free dyes. RhBITC-BSA/PDA NPs led to the most intense fluorescence in cells. Penetration and accumulation of NPs was not accompanied by a bactericidal or inhibitory effect of growth as demonstrated with the Gram-negative E. coli species and confirmed with a Gram-positive bacterial species (Staphylococcus aureus). Altogether, these results allow us to envisage the use of labelled BSA/PDA NPs to track bacteria and carry drugs in the core of bacterial cells.
Keywords: Escherichia coli; accumulation; albumin; antibacterial; fluorescence; nanoparticles; penetration; polydopamine.
Copyright © 2023, Equy et al.
Figures


Similar articles
-
Photo-enhanced antibacterial activity of polydopamine-curcumin nanocomposites with excellent photodynamic and photothermal abilities.Photodiagnosis Photodyn Ther. 2021 Sep;35:102417. doi: 10.1016/j.pdpdt.2021.102417. Epub 2021 Jun 26. Photodiagnosis Photodyn Ther. 2021. PMID: 34186263
-
Preparation of biocompatible heat-labile enterotoxin subunit B-bovine serum albumin nanoparticles for improving tumor-targeted drug delivery via heat-labile enterotoxin subunit B mediation.Int J Nanomedicine. 2014 May 6;9:2149-56. doi: 10.2147/IJN.S60764. eCollection 2014. Int J Nanomedicine. 2014. PMID: 24851048 Free PMC article.
-
Synthesis of tumor-targeted folate conjugated fluorescent magnetic albumin nanoparticles for enhanced intracellular dual-modal imaging into human brain tumor cells.Anal Biochem. 2016 Nov 1;512:8-17. doi: 10.1016/j.ab.2016.08.010. Epub 2016 Aug 11. Anal Biochem. 2016. PMID: 27523645
-
Construction of biocompatible bovine serum albumin nanoparticles composed of nano graphene oxide and AIEgen for dual-mode phototherapy bacteriostatic and bacterial tracking.J Nanobiotechnology. 2019 Oct 10;17(1):104. doi: 10.1186/s12951-019-0523-x. J Nanobiotechnology. 2019. PMID: 31601275 Free PMC article.
-
A bioinspired polydopamine-FeS nanocomposite with high antimicrobial efficiency via NIR-mediated Fenton reaction.Dalton Trans. 2023 Feb 7;52(6):1687-1701. doi: 10.1039/d2dt03765c. Dalton Trans. 2023. PMID: 36649112
Cited by
-
Polydopamine-Based Biomaterials in Orthopedic Therapeutics: Properties, Applications, and Future Perspectives.Drug Des Devel Ther. 2024 Aug 26;18:3765-3790. doi: 10.2147/DDDT.S473007. eCollection 2024. Drug Des Devel Ther. 2024. PMID: 39219693 Free PMC article. Review.
References
LinkOut - more resources
Full Text Sources