. 2023 Nov 30;13(1):2286820.
doi: 10.1080/2162402X.2023.2286820. eCollection 2024.

Activation of endogenous glucocorticoids by HSD11B1 inhibits the antitumor immune response in renal cancer

Affiliations

Activation of endogenous glucocorticoids by HSD11B1 inhibits the antitumor immune response in renal cancer

Hélène Poinot et al. Oncoimmunology. .

Abstract

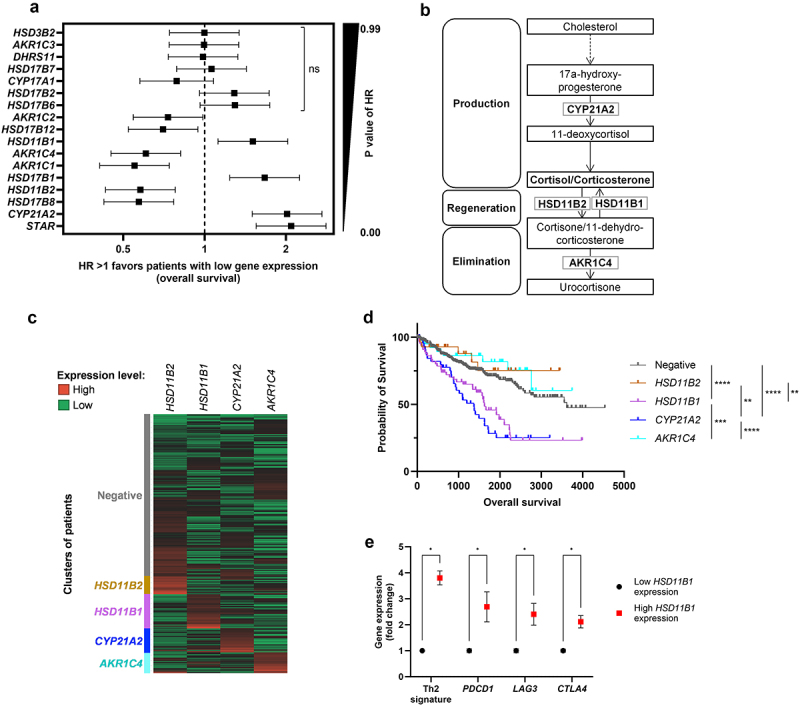
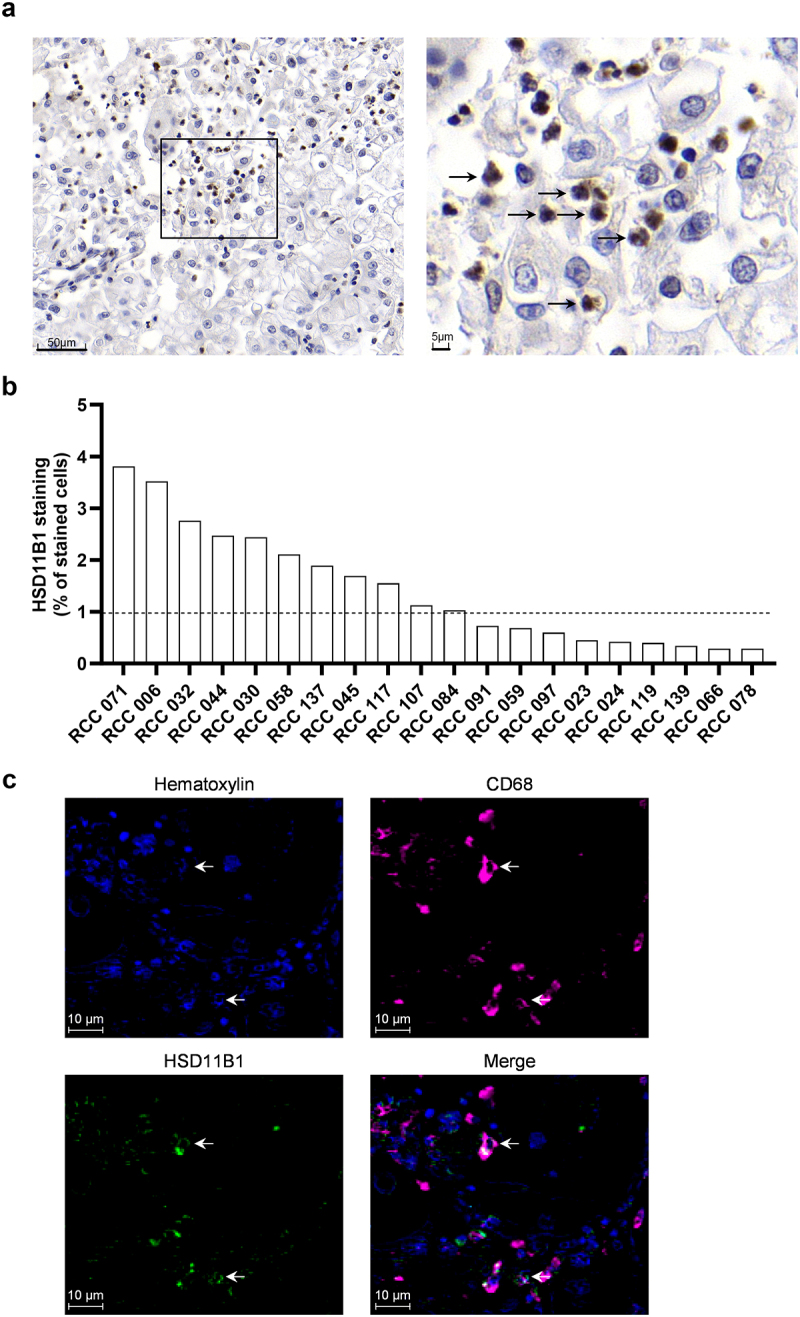
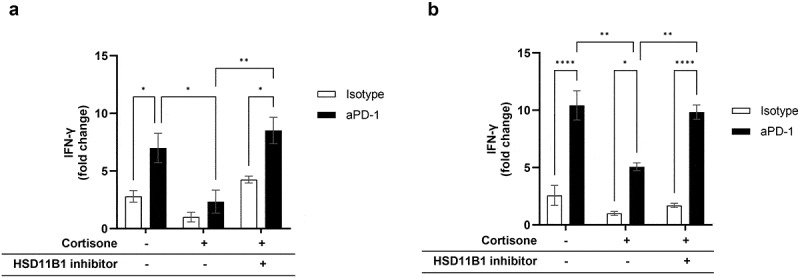
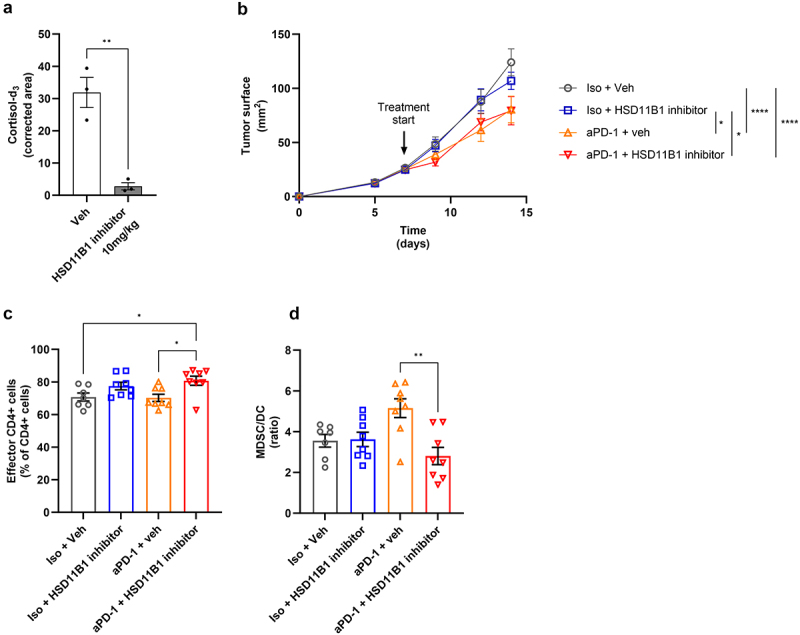
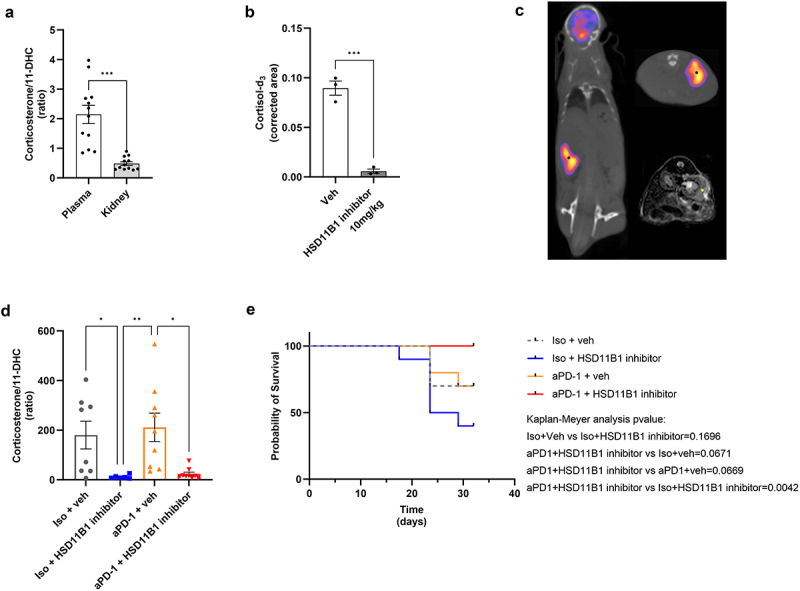
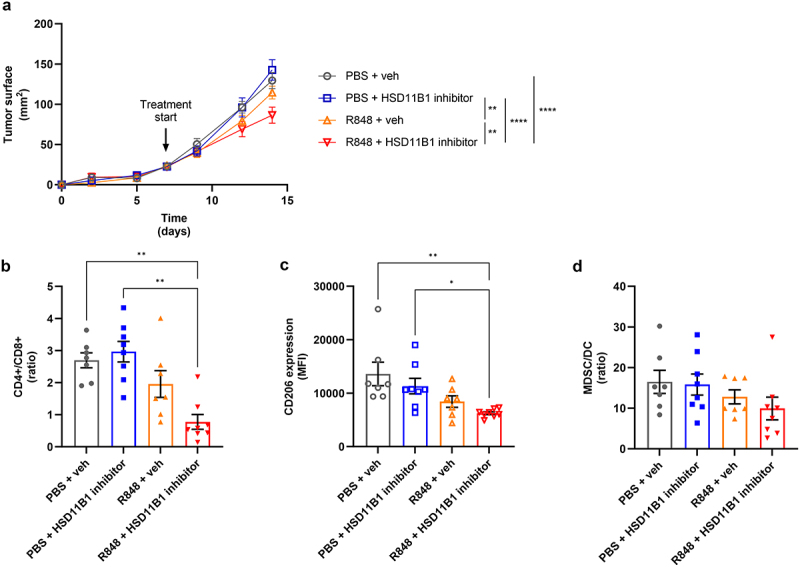
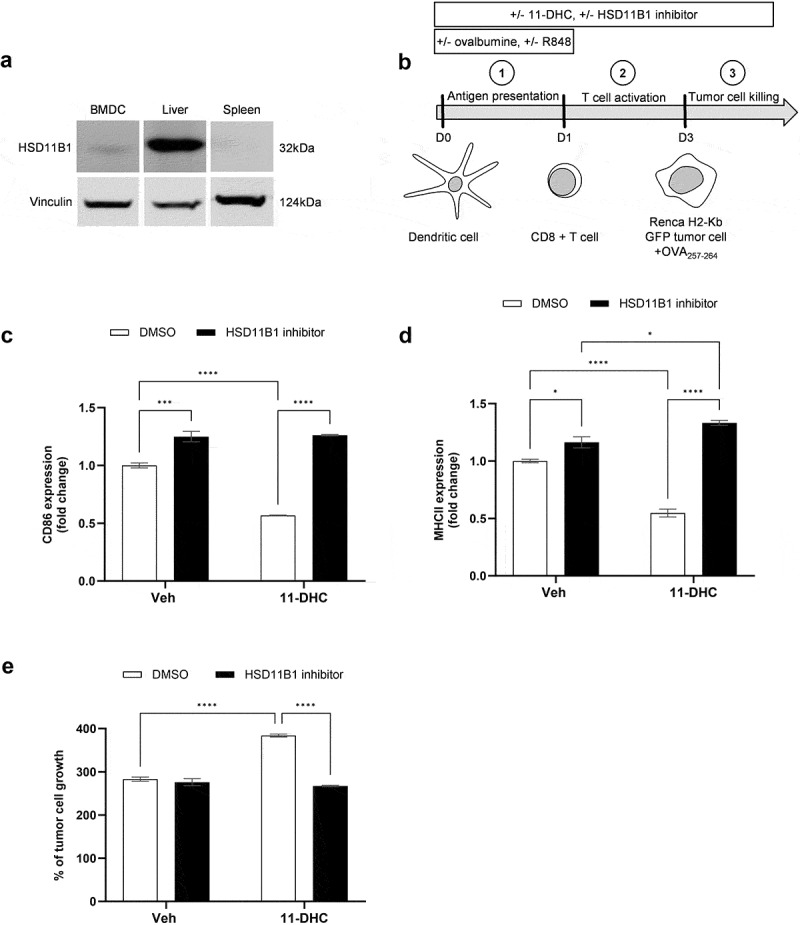
Although immune-based therapies have revolutionized the management of cancer, novel approaches are urgently needed to improve their outcome. We investigated the role of endogenous steroids in the resistance to cancer immunotherapy, as these have strong immunomodulatory functions. Using a publicly available database, we found that the intratumoral expression of 11 beta-hydroxysteroid dehydrogenase type 1 (HSD11B1), which regenerates inactive glucocorticoids into active glucocorticoids, was associated with poor clinical outcome and correlated with immunosuppressive gene signatures in patients with renal cell carcinoma (RCC). HSD11B1 was mainly expressed in tumor-infiltrating immune myeloid cells as seen by immunohistochemistry in RCC patient samples. Using peripheral blood mononuclear cells from healthy donors or immune cells isolated from the tumor of RCC patients, we showed that the pharmacological inhibition of HSD11B1 improved the response to the immune checkpoint inhibitor anti-PD-1. In a subcutaneous mouse model of renal cancer, the combination of an HSD11B1 inhibitor with anti-PD-1 treatment increased the proportion of tumor-infiltrating dendritic cells. In an intrarenal mouse tumor model, HSD11B1 inhibition increased the survival of mice treated with anti-PD-1. In addition, inhibition of HSD11B1 sensitized renal tumors in mice to immunotherapy with resiquimod, a Toll-like receptor 7 agonist. Mechanistically, we demonstrated that HSD11B1 inhibition combined with resiquimod increased T cell-mediated cytotoxicity to tumor cells by stimulating the antigen-presenting capacity of dendritic cells. In conclusion, these results support the use of HSD11B1 inhibitors to improve the outcome of immunotherapy in renal cancer and highlight the role of the endogenous glucocorticoid metabolism in the efficacy of immunotherapy.

Keywords: Glucocorticoids; HSD11B1; immunotherapy; renal cancer; steroidogenesis.


Conflict of interest statement

No potential conflict of interest was reported by the authors.

Figures

Figure 1.
Figure 1.
(a) forest plot showing the hazard ratio (HR) for overall survival (OS) in ccRCC patients with high versus low expression of genes involved in steroidogenesis. Patients were dichotomized into high vs. low gene expression groups based on the median expression values as threshold. HR is represented on a logarithmic scale, HR > 1 indicates that high expression of the gene correlates with a shorter OS. (b) simplified diagram of the glucocorticoid pathway. (C) heat map representing hierarchical clustering analysis of genes involved in glucocorticoid metabolism. (d) probability of survival for patients segregated based on the hierarchical clustering. **p-value <10−2, ***p-value <10−3, ****p-value <10−4. (e) expression levels for immune checkpoints and Th2 gene signature in patients with high vs. low HSD11B1 expression. Data are shown as mean ± SEM of 445 (low hsd11b1 expression) and 57 patients (high hsd11b1 expression), ****p-value <10−6.
Figure 2.
Figure 2.
(a) human RCC sample from tumor block stained for HSD11B1 (brown) by immunohistochemistry. The right picture is a zoom in section. The arrows indicate infiltrating cells positive for HSD11B1 with a macrophage morphology. (b) percentage of cells positive for HSD11B1 in tumors from 20 patients with RCC. (c) representative immunohistochemistry staining for CD68, HSD11B1 and hematoxylin in four RCC tumor specimens from patients. Arrows show colocalization of HSD11B1 and CD68.
Figure 3.
Figure 3.
Relative IFN-γ levels secreted by PBMC from a healthy donor (a) and immune cells enriched from a human RCC tumor (b), following antigen recall stimulation. In absence of cortisone, there was no effect of ABT-384 on the level of IFN-γ in stimulated or non-stimulated conditions (data not shown). Fold change compared to the condition with cortisone, isotype and without HSD11B1 inhibitor is represented as mean ± SEM of 3 technical replicates in one experiment. *p-value <0.05, **p-value <10−2, ***p-value <10−3, ****p-value <10−4. A. Data are representative of 3 independent experiments on the same donor. Similar results were obtained with 2 other donors tested in one experiment. B. out of 4 patients tested, only the patient shown had a response to antigen recall.
Figure 4.
Figure 4.
(a) determination of HSD11B1 activity by the measurement of plasma cortisol-d3 levels in naive mouse after administration of cortisol-d4 ± the HSD11B1 inhibitor ABT-384. Data are shown as mean ± SEM of 3 mice per group. **p-value <10−2. (b) growth kinetics of subcutaneous Renca tumors. Data are shown as mean of tumor area ± SEM of 8 mice per group. Statistical analysis at day 14, *p-value <0.05, ****p-value <10−4. (c-d) immunophenotyping results of the tumor by FACS. CD44CD62L CD4+ were defined as effector CD4+ cells and are represented as % of total CD4+ cells. (c) MDSC/DC ratio calculated based on the % of MDSC/CD45+ cells and % of DC/CD45+ cells (figureS6). (d) Data are shown as mean ± SEM of 8 mice per group. *p-value <0.05, **p-value <10−2. Animal experiments were performed once.
Figure 5.
Figure 5.
(a) comparison of corticosterone/11-DHC ratio in plasma and kidney of naive mice. Data are shown as mean ± SEM of 12 mice per group. ***p-value = 5×10⁻⁴. (b) determination of HSD11B1 activity by the measurement of cortisol-d3 levels in kidneys of naive mice after administration of cortisol-d4 ± the HSD11B1 inhibitor ABT-384. Data are shown as mean ± SEM of 3 mice per group. ***p-value <10−3. (c) representative images of a mouse with an intrarenal Renca tumor. Coronal (left) and axial views (upper right) of theF]FDG PET/CT scan (back of the mouse on the top). The lower right image corresponds to the axial view of the MRI scan. Tumor is pointed by the asterisks. (d) Corticosterone/11-DHC ratio in plasma of renal tumor-bearing mice. Data are shown as mean ± SEM of 6 to 9 mice per group. *p-value <0.05, **p-value <10−2. (e) probability of survival over time in mice bearing intrarenal Renca tumors based on the tumor volume. Tumor volume >200 mm considered as event of death, 10 mice per group. Statistical analysis: log-rank (Mantel-Cox) test. Animal experiments were performed once.
Figure 6.
Figure 6.
(a) growth kinetics of subcutaneously implanted Renca tumors. Treatments were initiated at day 7. Data are shown as mean of tumor area ± SEM of 7 to 8 mice per group. Statistical analysis at day 14, **p-value <10−2, ****p-value <10−4. (b-d) immunophenotyping results of the tumors by flow cytometry. Percentage of CD4+, CD8+ (b), MDSC, and DC (d) represented as ratio of cell populations. CD206 expression (c) represented as mean fluorescence intensity (MFI) of CD206 on macrophages in the tumor. Data are shown as mean ± SEM of 7 to 8 mice per group. *p-value <0.05, **p-value <10−2. Animal experiments were performed once.
Figure 7.
Figure 7.
(a) HSD11B1 expression by Western blot in mouse bone marrow-derived dendritic cells, liver and spleen. (b) experimental design of T cell-mediated tumor cytotoxicity assay. C, D. surface CD86 (c) and MHCII (d molecules on bone marrow-derived dendritic cells measured by flow cytometry at D1. Results are expressed as fold change of the MFI, relative to the control condition. Data are shown as mean ± SEM of 3 technical replicates of one experiment. (e) measurement of Renca H2-kb GFP tumor cell growth exposed to antigen stimulated CD8+ T cells. Results are expressed as % of tumor cell growth normalized to the seeding density. Data are shown as mean ± SEM of 3 replicates and representative of 3 independent experiments. *p-value <0.05, ***p-value <10−3, ****p-value <10−4.

References

    1. Tung I, Sahu A.. Immune checkpoint inhibitor in first-line treatment of metastatic renal cell carcinoma: a review of Current evidence and future directions. Front Oncol. 2021;11:707214. doi:10.3389/fonc.2021.707214. - DOI - PMC - PubMed
    1. Albiges L, Tannir NM, Burotto M, McDermott D, Plimack ER, Barthélémy P, Porta C, Powles T, Donskov F, George S, et al. Nivolumab plus ipilimumab versus sunitinib for first-line treatment of advanced renal cell carcinoma: extended 4-year follow-up of the phase III CheckMate 214 trial. ESMO Open. 2020;5(6):e001079. doi:10.1136/esmoopen-2020-001079. - DOI - PMC - PubMed
    1. Atkins MB, Tannir NM. Current and emerging therapies for first-line treatment of metastatic clear cell renal cell carcinoma. Cancer Treat Rev. 2018;70:127–11. doi:10.1016/j.ctrv.2018.07.009. - DOI - PubMed
    1. Strehl C, Ehlers L, Gaber T, Buttgereit F. Glucocorticoids—all-Rounders tackling the versatile players of the immune System. Front Immunol. 2019;10:1744. doi:10.3389/fimmu.2019.01744. - DOI - PMC - PubMed
    1. Horvat TZ, Adel NG, Dang TO, Momtaz P, Postow MA, Callahan MK, Carvajal RD, Dickson MA, D’Angelo SP, Woo KM, et al. Immune-related adverse events, need for systemic immunosuppression, and effects on survival and time to treatment failure in patients with melanoma treated with ipilimumab at memorial sloan Kettering cancer center. J Clin Oncol. 2015;33(28):3193–3198. doi:10.1200/JCO.2015.60.8448. - DOI - PMC - PubMed

MeSH terms

Substances