. 2021 Dec:34:4738-4750.

Generalized Shape Metrics on Neural Representations

Affiliations

Generalized Shape Metrics on Neural Representations

Alex H Williams et al. Adv Neural Inf Process Syst. 2021 Dec.

Abstract

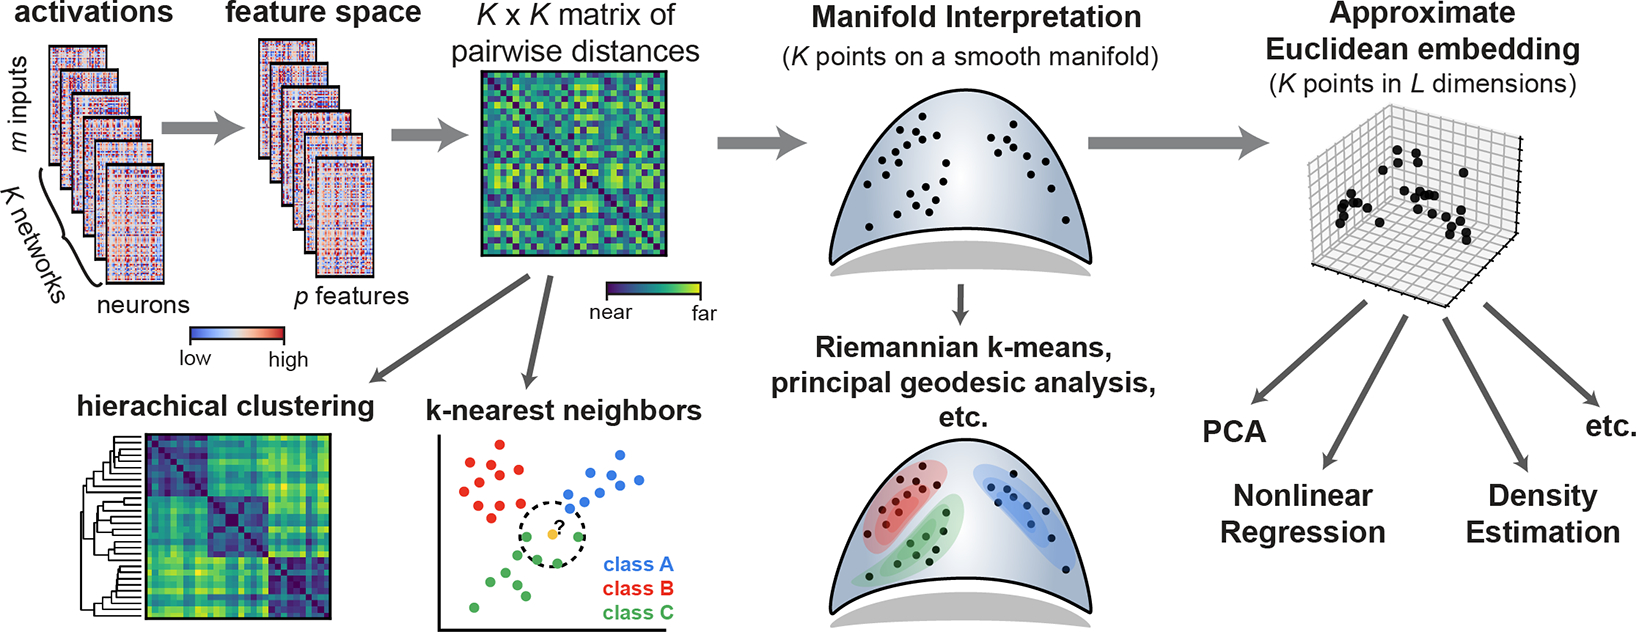
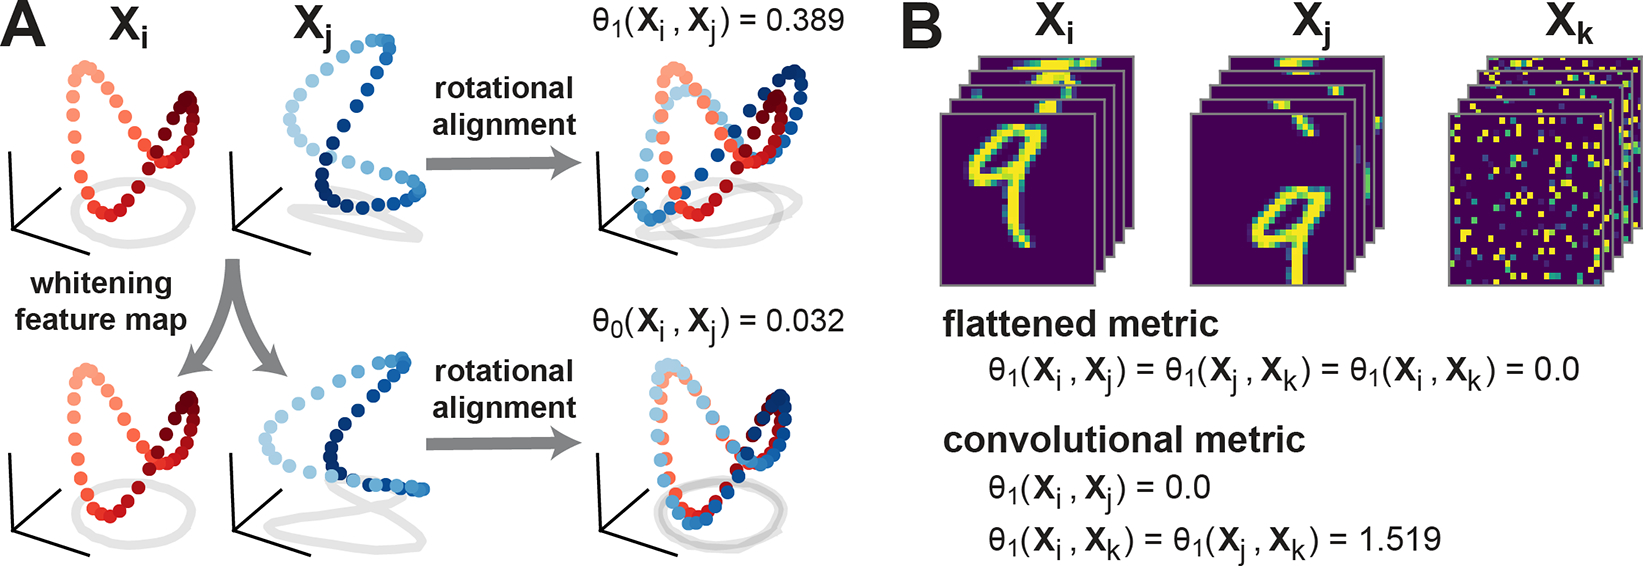
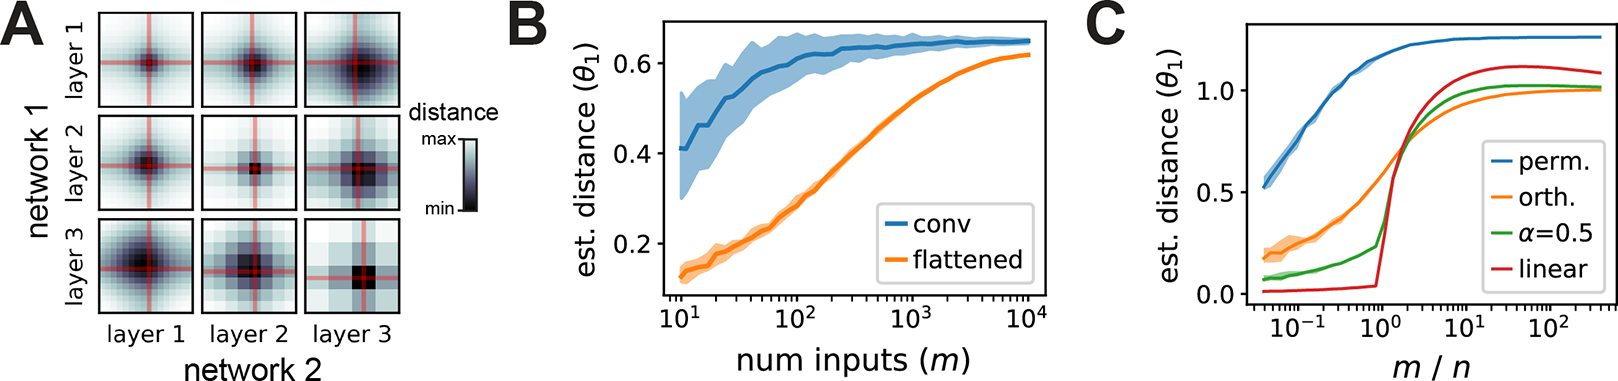
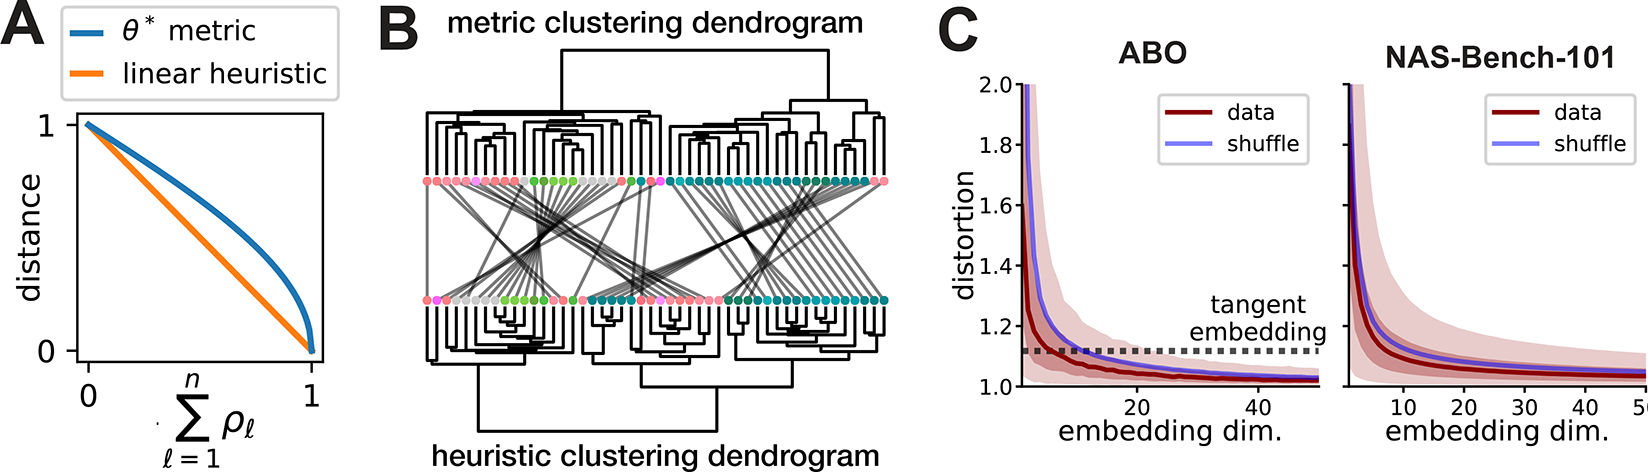
Understanding the operation of biological and artificial networks remains a difficult and important challenge. To identify general principles, researchers are increasingly interested in surveying large collections of networks that are trained on, or biologically adapted to, similar tasks. A standardized set of analysis tools is now needed to identify how network-level covariates-such as architecture, anatomical brain region, and model organism-impact neural representations (hidden layer activations). Here, we provide a rigorous foundation for these analyses by defining a broad family of metric spaces that quantify representational dissimilarity. Using this framework, we modify existing representational similarity measures based on canonical correlation analysis and centered kernel alignment to satisfy the triangle inequality, formulate a novel metric that respects the inductive biases in convolutional layers, and identify approximate Euclidean embeddings that enable network representations to be incorporated into essentially any off-the-shelf machine learning method. We demonstrate these methods on large-scale datasets from biology (Allen Institute Brain Observatory) and deep learning (NAS-Bench-101). In doing so, we identify relationships between neural representations that are interpretable in terms of anatomical features and model performance.


Figures

Figure 1:
Figure 1:
Machine learning workflows enabled by generalized shape metrics.
Figure 2:
Figure 2:
(A) Schematic illustration of metrics with rotational invariance (top), and linear invariance (bottom). Red and blue dots represent a pair of network representations Xi and Xj, which correspond to m points in n-dimensional space. (B) Demonstration of convolutional metric on toy data. Flattened metrics (e.g. [6, 9]) that ignore convolutional layer structure treat permuted images (Xk, right) as equivalent to images with coherent spatial structure (Xi and Xj, left and middle). A convolutional metric, Eq. (11), distinguishes between these cases while still treating Xi and Xj as equivalent (obeying translation invariance).
Figure 3:
Figure 3:
(A) Each heatmap shows a brute-force search over the shift parameters along the width and height dimensions of a pair of convolutional layers compared across two networks. The optimal shifts are typically close to zero (red lines). (B) Impact of sample size, m, on flattened and convolutional metrics with orthogonal invariance. The convolutional metric approaches its final value faster than the flattened metric, which is still increasing even at the full size of the CIFAR-10 test set m=104. (C) Impact of sample density, m/n, on metrics invariant to permutation, orthogonal, regularized linear (α=0.5), and linear transformations. Shaded regions mark the 10th and 90th percentiles across shuffled repeats. Further details are provided in Supplement E.
Figure 4:
Figure 4:
(A) Comparison of metric and linear heuristic. (B) Metric and linear heuristic produce discordant hierarchical clusterings of brain areas in the ABO dataset. Leaves represent brain areas that are clustered by representational similarity (see Fig. 1C), colored by Allen reference atlas, and ordered to maximize dendrogram similarities of adjacent leaves. In the middle, grey lines connect leaves corresponding to the same brain region across the two dendrograms. (C) ABO and NAS-Bench-101 datasets can be accurately embedded into Euclidean spaces. Dark red line shows median distortion. Light red shaded region corresponds to 5th to 95th percentiles of distortion, dark red shaded corresponds to interquartile range. The mean distortion of a null distribution over representations (blue line) was generated by shuffling the m inputs independently in each network.
Figure 5:
Figure 5:
(A) PCA visualization of representations across 48 brain regions in the ABO dataset. Areas are colored by the reference atlas (see inset), illustrating a functional clustering of regions that maps onto anatomy. (B) Left, kernel regression predicts anatomical hierarchy [48] from embedded representations (see Supplement E). Right, PCA visualization of 31 areas labeled with hierarchy scores. (C) PCA visualization of 2000 network representations (a subset of NAS-Bench-101) across five layers, showing global structure is preserved across layers. Each network is colored by its position in the “Stack 1” layer (the middle of the architecture). (D) Embeddings of NAS-Bench-101 representations are predictive of test set accuracy, even in very early layers.

References

    1. Barrett David GT, Morcos Ari S, and Macke Jakob H. “Analyzing biological and artificial neural networks: challenges with opportunities for synergy?” Current Opinion in Neurobiology 55 (2019). Machine Learning, Big Data, and Neuroscience, pp. 55–64. - PubMed
    1. Kriegeskorte Nikolaus and Wei Xue-Xin. “Neural tuning and representational geometry”. Nature Reviews Neuroscience (2021). - PubMed
    1. Roeder Geoffrey, Metz Luke, and Kingma Durk. “On Linear Identifiability of Learned Representations”. Proceedings of the 38th International Conference on Machine Learning. Ed. by Meila Marina and Zhang Tong. Vol. 139. Proceedings of Machine Learning Research. PMLR, 2021, pp. 9030–9039.
    1. Yamins Daniel L. K., Hong Ha, Cadieu Charles F., Solomon Ethan A., Seibert Darren, and DiCarlo James J. “Performance-optimized hierarchical models predict neural responses in higher visual cortex”. Proceedings of the National Academy of Sciences 111.23 (2014), pp. 8619–8624. - PMC - PubMed
    1. Cadena Santiago A., Sinz Fabian H., Muhammad Taliah, Froudarakis Emmanouil, Cobos Erick, Walker Edgar Y., Reimer Jake, Bethge Matthias, Tolias Andreas, and Ecker Alexander S.. “How well do deep neural networks trained on object recognition characterize the mouse visual system?” NeurIPS Workshop Neuro AI (2019).

LinkOut - more resources