. 2024 Jan 3;147(1):6.
doi: 10.1007/s00401-023-02666-x.

Disruption of MAM integrity in mutant FUS oligodendroglial progenitors from hiPSCs

Affiliations

Disruption of MAM integrity in mutant FUS oligodendroglial progenitors from hiPSCs

Yingli Zhu et al. Acta Neuropathol. .

Erratum in

Abstract

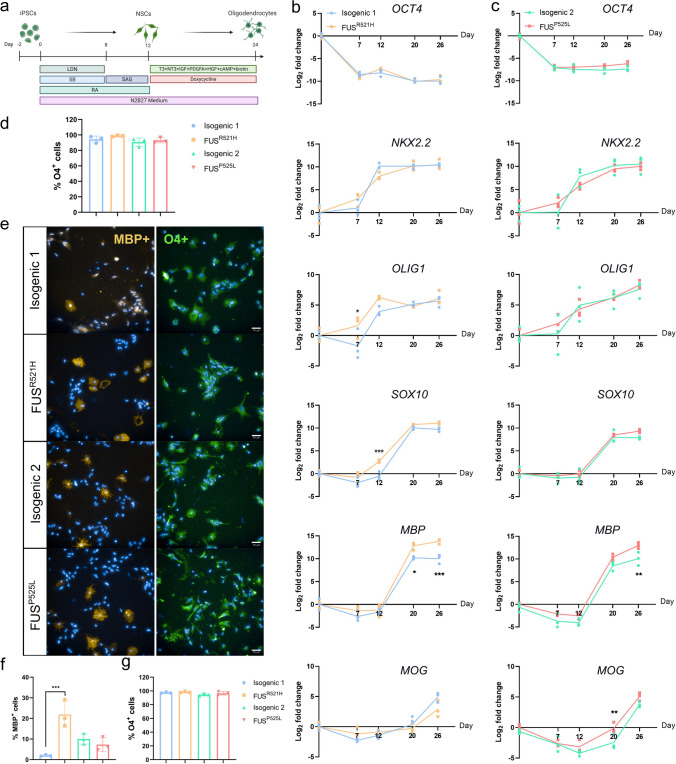
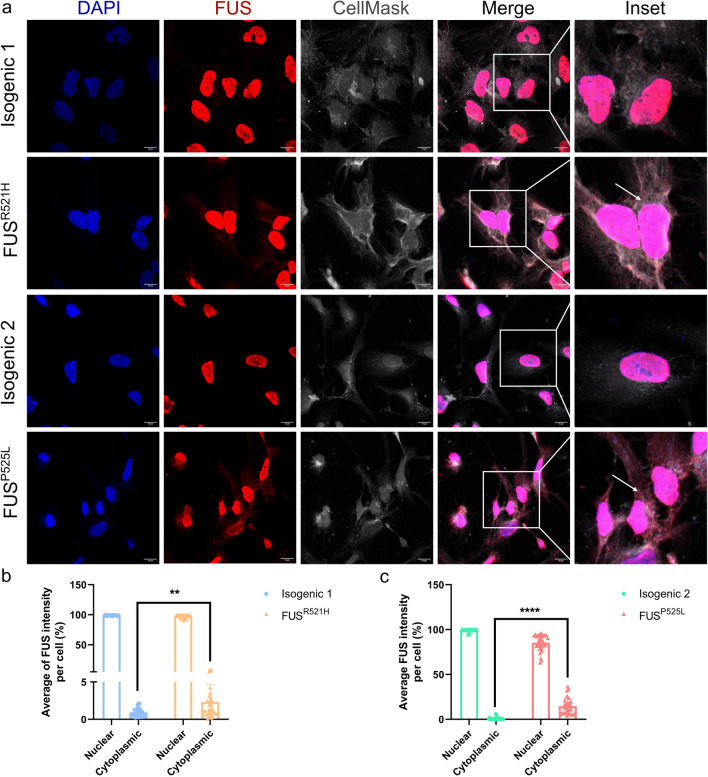
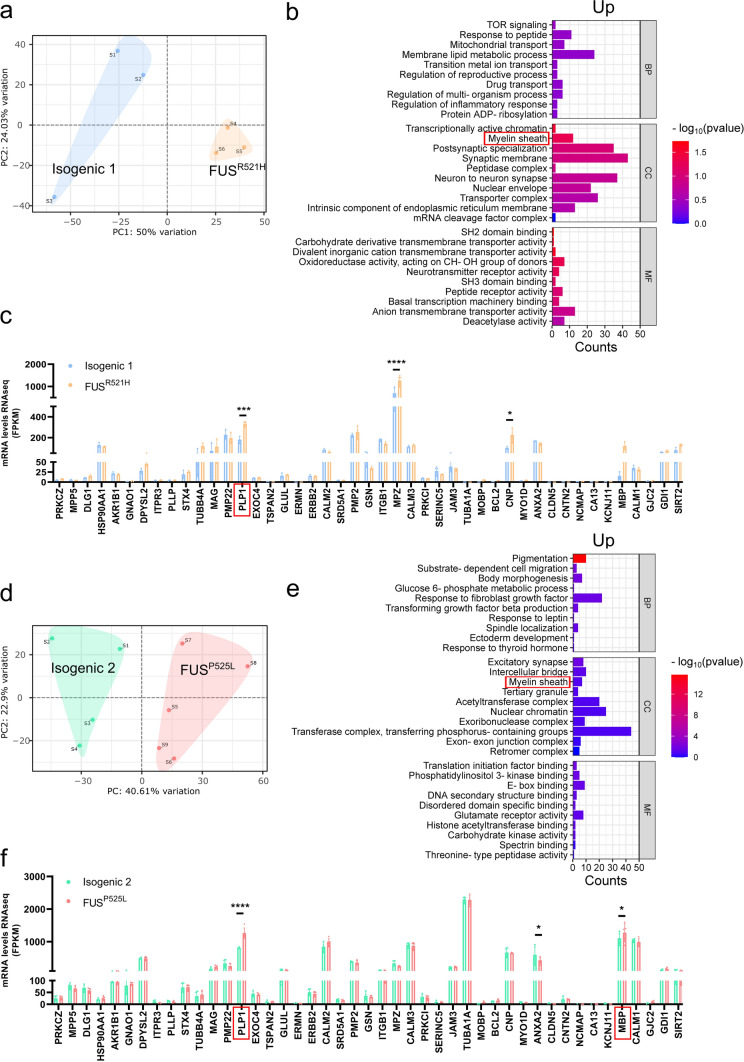
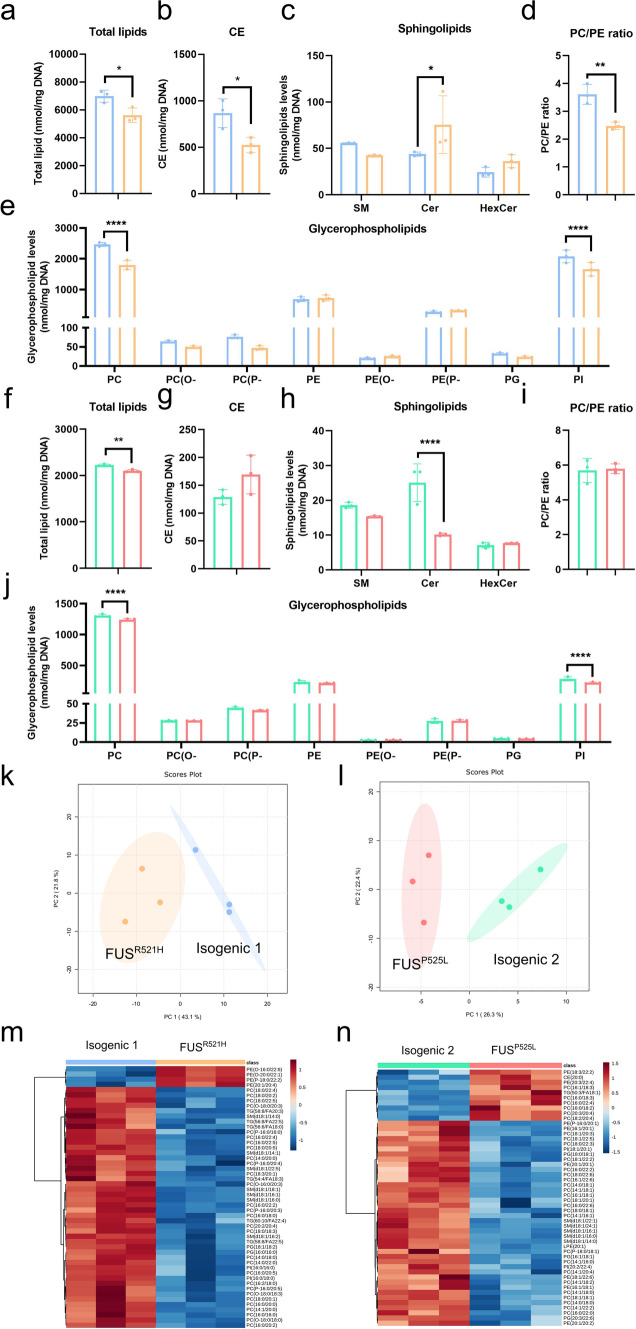
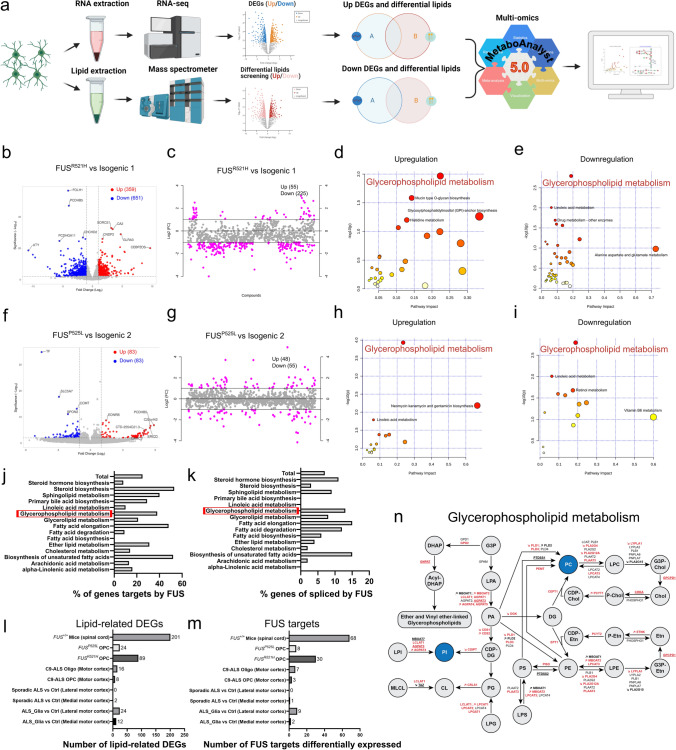
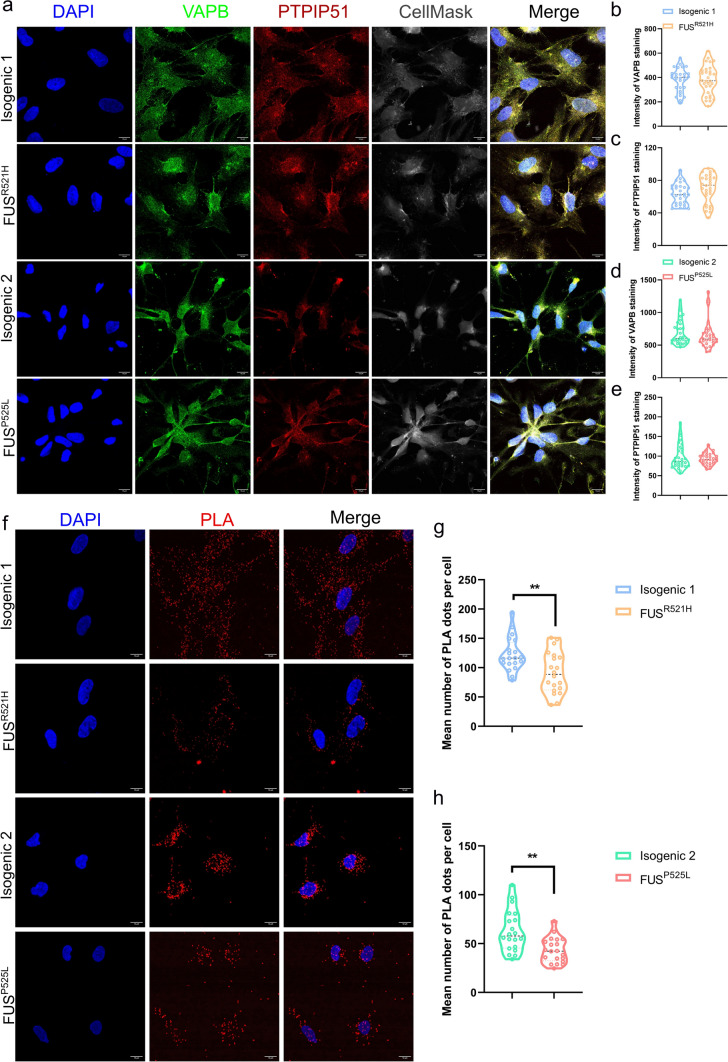
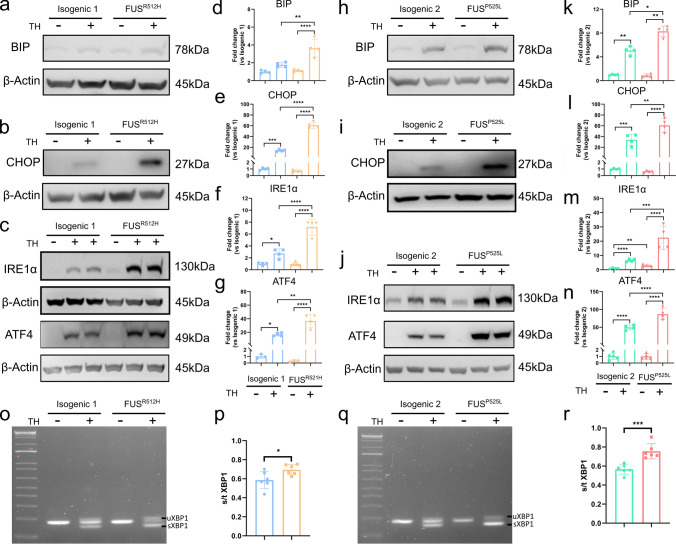
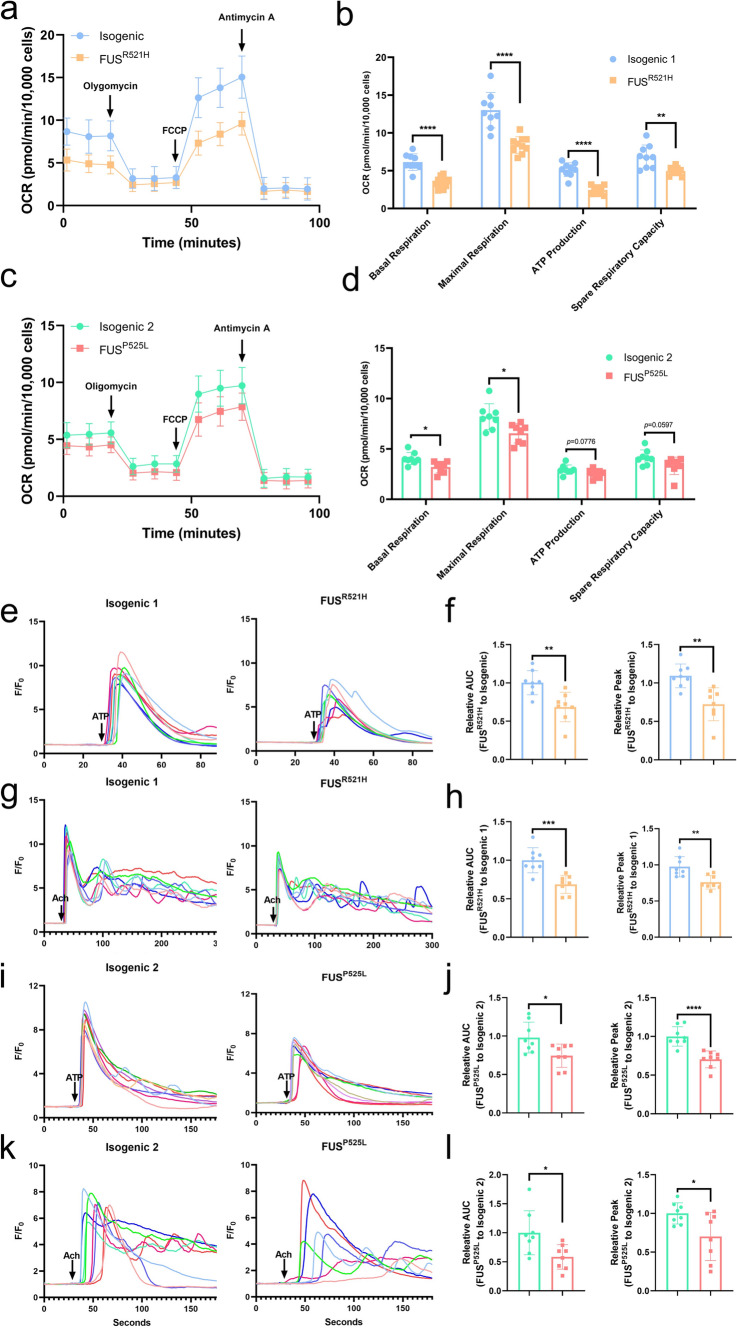
Amyotrophic lateral sclerosis (ALS) is a rapidly progressive and fatal neurodegenerative disorder, characterized by selective loss of motor neurons (MNs). A number of causative genetic mutations underlie the disease, including mutations in the fused in sarcoma (FUS) gene, which can lead to both juvenile and late-onset ALS. Although ALS results from MN death, there is evidence that dysfunctional glial cells, including oligodendroglia, contribute to neurodegeneration. Here, we used human induced pluripotent stem cells (hiPSCs) with a R521H or a P525L mutation in FUS and their isogenic controls to generate oligodendrocyte progenitor cells (OPCs) by inducing SOX10 expression from a TET-On SOX10 cassette. Mutant and control iPSCs differentiated efficiently into OPCs. RNA sequencing identified a myelin sheath-related phenotype in mutant OPCs. Lipidomic studies demonstrated defects in myelin-related lipids, with a reduction of glycerophospholipids in mutant OPCs. Interestingly, FUSR521H OPCs displayed a decrease in the phosphatidylcholine/phosphatidylethanolamine ratio, known to be associated with maintaining membrane integrity. A proximity ligation assay further indicated that mitochondria-associated endoplasmic reticulum membranes (MAM) were diminished in both mutant FUS OPCs. Moreover, both mutant FUS OPCs displayed increased susceptibility to ER stress when exposed to thapsigargin, and exhibited impaired mitochondrial respiration and reduced Ca2+ signaling from ER Ca2+ stores. Taken together, these results demonstrate a pathological role of mutant FUS in OPCs, causing defects in lipid metabolism associated with MAM disruption manifested by impaired mitochondrial metabolism with increased susceptibility to ER stress and with suppressed physiological Ca2+ signaling. As such, further exploration of the role of oligodendrocyte dysfunction in the demise of MNs is crucial and will provide new insights into the complex cellular mechanisms underlying ALS.

Keywords: Amyotrophic lateral sclerosis; ER stress; FUS; Lipid defects; MAM disruption; Mitochondrial dysfunction.


Conflict of interest statement

The authors declare that they have no known competing financial interests or personal relationships that could have appeared to influence the work reported in this paper.

Figures

Fig. 1
Fig. 1
Presence of mutant FUS does not affect iPSC-derived OPC differentiation. a Schematic overview of the oligodendrocyte differentiation protocol. RT-qPCR of OCT4, NKX2.2, OLIG1, SOX10, MBP and MOG transcripts throughout the oligodendrocyte differentiation of FUSR521H mutant and isogenic control (b) and FUSP525L mutant and isogenic control (c) (N = 3 independent differentiations). d Determination by flow cytometry of the percentage of O4+ cells in DIV26 OPCs generated by SOX10 overexpression from the AAVS1 locus (N = 3 independent differentiations). e Immunofluorescent staining for MBP and O4 on DIV26-30 OPCs generated from FUSP525L, FUSR521H mutant and the isogenic control hiPSCs (scale bar: 50 μm). Quantification of the percentage of MBP (f) and O4 (g) positive cells. Data are represented as mean ± SD of three biological replicates (n = 33 images). Statistical analyses were performed by one-way ANOVA (dg) and two-way ANOVA (b, and c) with the Bonferroni's multiple comparisons test. Data are represented as mean ± SD. *p < 0.05 **p < 0.01 ***p < 0.001
Fig. 2
Fig. 2
Cytoplasmic FUS accumulation in mutant FUS iPSC-derived OPCs. a Representative confocal images of FUS protein cellular localization on DIV26-30 OPCs generated from FUSP525L, FUSR521H and their isogenic control hiPSCs (scale bar: 10 μm). Nuclei are stained with DAPI and cytoplasm with CellMask. Arrows in the inset indicate FUS mislocalization in the cytoplasm of mutant FUS OPCs. Quantification of nuclear and cytoplasmic FUS staining in FUSR521H mutant OPCs (b) and FUSP525L mutant OPCs (c) and their respective isogenic controls. Statistical analyses were performed by unpaired two-tailed t tests. Data are represented as mean ± SD from three biological replicates with three technical replicates in each experiment (n = 30 images and n > 150 nuclei/condition). **p < 0.01 ****p < 0.0001
Fig. 3
Fig. 3
Transcriptome analysis identified myelin sheath pathological signature in mutant FUS iPSC-derived OPCs. Principal component analysis (PCA) of FUSR521H mutant (a) and FUSP525L mutant (d) and their respective isogenic controls (N ≥ 3 independent differentiations). Ranked gene set enrichment analysis (GSEA) was performed in FUSR521H mutant OPCs (b) and FUSP525L mutant OPCs (e) and their respective isogenic controls using the online tool WebGestalt. The top ten significantly enriched gene ontology (GO) terms of upregulated genes in biological process (BP), cellular component (CC), and molecular function (MF) are presented. Normalized expression from RNAseq data of myelin sheath-related genes in FUSR521H mutant (c) and FUSP525L mutant (f) (N ≥ 3 independent differentiations). Statistical analyses were performed by two-way ANOVA with the Bonferroni’s multiple comparisons test (c and f). Data are represented as mean ± SD. *p < 0.05; **p < 0.01 ****p < 0.0001
Fig. 4
Fig. 4
Lipidome analysis identified lipid metabolism defects in mutant FUS iPSC-derived OPCs. Quantification of total lipid concentrations (nmol/mg DNA) by mass spectrometry in FUSR521H mutant OPCs (a) and FUSP525L mutant OPCs (f) and their respective isogenic controls (N = 3 independent differentiations). Quantification of cholesterol ester (CE) and sphingolipid concentrations (SM, Cer, and HexCer) in FUSR521H mutant OPCs (b, c) and FUSP525L mutant OPCs (g, h) and their respective isogenic controls. Quantification of glycerophospholipid subclasses (PC, PC(O-), PC(P-), PE, PE(O-), PE(P-), PG, and PI) in FUSR521H mutant OPCs (e) and FUSP525L mutant OPCs (j) and their respective isogenic controls. PC to PE concentration ratio in FUSR521H mutant OPCs (d) and FUSP525L mutant OPCs (i) and their respective isogenic controls. PCA plot of lipidomic data in FUSR521H mutant OPCs (k) and FUSP525L mutant OPCs (l) and their respective isogenic controls. m, n Heatmap representing all clustered samples and color-coded normalized concentrations of the top 50 most significantly altered individual lipid species (one-way ANOVA, p < 0.05, FDR corrected). (PC, phosphatidylcholine; PC(O-), alkylphosphatidylcholine; PC(P-), alkenylphosphatidylcholine; PE, phosphatidylethanolamine; PE(O-), alkylphosphatidylethanolamine; PE(P-), alkenylphosphatidylethanolamine; PG, phosphatidylglycerol; PI, phosphatidylinositol; SM, sphingomyelin; Cer, ceramide; HexCer, hexose-ceramides). Statistical analyses were performed by unpaired two-tailed t tests to compare FUS-mutant OPCs and their respective controls (a, b, d, f, g, and i) and two-way ANOVA with the Bonferroni’s multiple comparisons test (c, e, h, and j). Data are represented as mean ± SD. *p < 0.05 **p < 0.01 ****p < 0.0001
Fig. 5
Fig. 5
Dysregulated glycerophospholipid metabolism in mutant FUS iPSC-derived OPCs. a Scheme of joint-pathway analysis. b, f Volcano plots of upregulated (red) and downregulated (blue) genes in FUS-mutant OPCs, compared to isogenic controls. Genes with log2FC < − 1.0 and − log10(p) > 2.0 were considered downregulated and log2FC > 1.0 with − log10(p) > 2.0 were considered upregulated. c, g Important dysregulated lipid species (red circles) selected by fold-change analysis. Both upregulated (log2FC > 1.0) and downregulated (log2FC < − 1.0) features are plotted in a symmetrical way. d, h, e, i Joint-pathway analysis (MetaboAnalyst v.5.0) shows upregulated and downregulated metabolic pathways in FUS-mutant OPCs, compared to isogenic controls. Each circle signifies a distinct pathway, with its size and shade reflecting the pathway’s impact and statistical significance (red denotes the highest significance). j, k Bar graphs displaying the percentage of known genes targeted by FUS (j) or spliced by FUS (k) within the different lipid-metabolism-related KEGG pathways (based on studies [12, 33, 37, 45, 64, 83]. l, m Bar graphs indicating the number of lipid-metabolism-related dysregulated genes (DEGs) (l) and the number of lipid-metabolism-related dysregulated genes that can be regulated by FUS (m) across previously published datasets compared to FUS-mutant OPCs. These datasets include bulk RNAseq data of the spinal cord from symptomatic FUS+/+ mice overexpressing wild-type human FUS compared to wild-type mice [79], single nuclei RNAseq data of primary human motor cortex OPCs/oligodendroglia of C9orf72-ALS patients compared with control human brain [50] and bulk RNAseq data of sporadic ALS patient motor cortex compared to control non-ALS control individuals [91], as well as between the so-called motor cortex of a ‘ALS_glia’ subtype group (identified by enriched astroglia, microglia and oligodendroglia dysregulated genes, and this even if—according to the authors—there was no selective neuronal loss) versus motor cortex all other sporadic ALS patients. n Scheme of glycerophospholipid metabolism, in which circles indicate metabolites and arrows indicate the enzymatic reaction with the gene name encoding the enzyme. Altered lipid classes in FUS-mutant OPCs are highlighted in blue, and arrows indicate whether the gene is upregulated or downregulated based on RNAseq data. Genes targeted by FUS are highlighted in red, while genes spliced by FUS are underlined
Fig. 6
Fig. 6
MAM disruption in mutant FUS iPSC-derived OPCs. a Immunofluorescent staining for DAPI, VAPB, and PTPIP51 on DIV26-30 OPCs generated from FUSP525L, FUSR521H and their isogenic control hiPSCs (scale bar: 10 μm). b, d Violin plot of the intensity of VAPB staining on FUSP525L and FUSR521H OPCs, and their isogenic controls. Each symbol represents the mean intensity of VAPB from an image. Data are represented as mean ± SD from 3 biological (N = 30 images). c, e Violin plot of intensity of PTPIP51 staining on FUSP525L and FUSR521H OPCs, and their isogenic controls. Each symbol represents the mean intensity of PTPIP51 from an image. Data are represented as mean ± SD from three biological (N = 30 images). f Proximity ligation analysis (PLA) using antibodies against VAPB and PTPIP51 (VAPB/PTPIP51, red) FUSP525L and FUSR521H OPCs, and their isogenic controls. Nuclei were stained with DAPI (blue). Scale bars are 10 μm. g, h Violin plot of quantification of the PLA signal in FUSR521H and isogenic control OPCs (h) and FUSP525L and isogenic control OPCs (i). Each symbol represents the mean number of PLA dots per cell from one image. Statistical analyses were performed by unpaired two-tailed t tests to compare mutant FUS OPCs and their controls. Data are represented as mean ± SD from three biological replicates with three technical replicates in each experiment (N = 20 images and n > 100 nuclei/condition). **p < 0.01
Fig. 7
Fig. 7
Mutant FUS iPSC-derived OPCs show enhanced ER stress after thapsigargin (TH) exposure. a–g Representative Western blots and quantification for BIP, CHOP, IRE1α, and ATF-4 levels in FUSR521H and its isogenic control OPCs after 1 μM TH treatment for 24 h. All of the values are normalized to the control group (N ≥ 4 independent differentiations). h–n Representative Western blots of and quantification for BIP, CHOP, IRE1α, and ATF-4 levels in FUSP525L and isogenic control OPCs after 1 μM TH treatment for 24 h (N ≥ 4 independent differentiations). o, q The mRNAs of spliced (sXBP1) and unspliced (uXBP1) were detected using RT-PCR in FUSR521H and isogenic control OPCs (o) and FUSP525L and isogenic control OPCs (q) after 2 μM TH treatment for 4 h. p, r Ratio of spliced to total XBP1 mRNA in FUSR521H and isogenic control OPCs (N = 6) and FUSP525L and isogenic control OPCs (N = 6). Statistical analyses were performed by one-way ANOVA with the Bonferroni’s multiple comparisons test (b–g and k–n) and unpaired two-tailed t test (p and r) to compare FUS-mutant OPCs and its control. Data are represented as mean ± SD. *p < 0.05 **p < 0.01 ***p < 0.001 ****p < 0.0001
Fig. 8
Fig. 8
Mitochondrial respiration and ER-derived Ca2+ signaling are impaired in mutant FUS iPSC-derived OPCs. a, c Oxygen consumption rate (OCR) throughout the mitochondrial respiration in FUSR521H OPCs (a) and FUSP525L OPCs (c) and their respective isogenic controls (N ≥ 8). The time points of adding mitochondrial inhibitors to the media for evaluating respiratory parameters are indicated by arrows. b, d Basal respiration, maximal respiration, ATP production, and spare respiratory capacity in FUSR521H OPCs (b) and FUSP525L OPCs (d) and their respective isogenic controls. e, i Representative Ca2+ traces following 10 μM ATP stimulation (arrow) in FUSR521H OPCs (e) and FUSP525L OPCs (i) and their respective isogenic controls loaded with Cal-520. f, h Quantitative data of the corresponding AUC and peak after 10 μM ATP stimulation (N = 8). g, k Representative Ca2+ traces following 10 μM Ach stimulation (arrow) in FUSR521H OPCs (g) and FUSP525L OPCs (k) and their respective isogenic controls. h, l Quantitative data of the corresponding AUC and peak after 10 μM Ach stimulation (N = 8). Statistical analyses were performed by unpaired two-tailed t tests to compare mutant FUS OPCs and their control. Data are represented as mean ± SD. *p < 0.05 **p < 0.01 ***p < 0.001 ****p < 0.0001

References

    1. Al-Saif A, Al-Mohanna F, Bohlega S. A mutation in sigma-1 receptor causes juvenile amyotrophic lateral sclerosis. Ann Neurol. 2011;70:913–919. doi: 10.1002/ana.22534. - DOI - PubMed
    1. Angebault C, Fauconnier J, Patergnani S, Rieusset J, Danese A, Affortit CA, Jagodzinska J, Mégy C, Quiles M, Cazevieille C, Korchagina J, Bonnet-Wersinger D, Milea D, Hamel C, Pinton P, Thiry M, Lacampagne A, Delprat B, Delettre C. ER-mitochondria cross-talk is regulated by the Ca(2+) sensor NCS1 and is impaired in Wolfram syndrome. Sci Signal. 2018 doi: 10.1126/scisignal.aaq1380. - DOI - PubMed
    1. Area-Gomez E, de Groof A, Bonilla E, Montesinos J, Tanji K, Boldogh I, Pon L, Schon EA. A key role for MAM in mediating mitochondrial dysfunction in Alzheimer disease. Cell Death Dis. 2018;9:335. doi: 10.1038/s41419-017-0215-0. - DOI - PMC - PubMed
    1. Von Bartheld CS, Bahney J, Herculano-Houzel S. The search for true numbers of neurons and glial cells in the human brain: a review of 150 years of cell counting. J Comp Neurol. 2016;524:3865–3895. doi: 10.1002/cne.24040. - DOI - PMC - PubMed
    1. Bensimon G, Lacomblez L, Meininger V. A controlled trial of riluzole in amyotrophic lateral sclerosis. ALS/Riluzole Study Group. N Engl J Med. 1994;330:585–591. doi: 10.1056/NEJM199403033300901. - DOI - PubMed

Publication types

MeSH terms