. 2024 Feb;119(1):93-112.
doi: 10.1007/s00395-023-01022-0. Epub 2024 Jan 3.

Acute antiarrhythmic effects of SGLT2 inhibitors-dapagliflozin lowers the excitability of atrial cardiomyocytes

Affiliations

Acute antiarrhythmic effects of SGLT2 inhibitors-dapagliflozin lowers the excitability of atrial cardiomyocytes

Amelie Paasche et al. Basic Res Cardiol. 2024 Feb.

Abstract

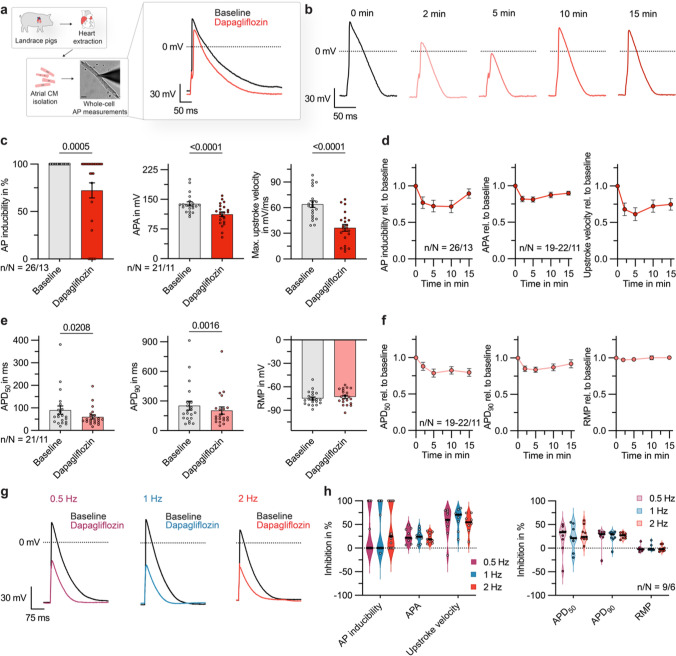
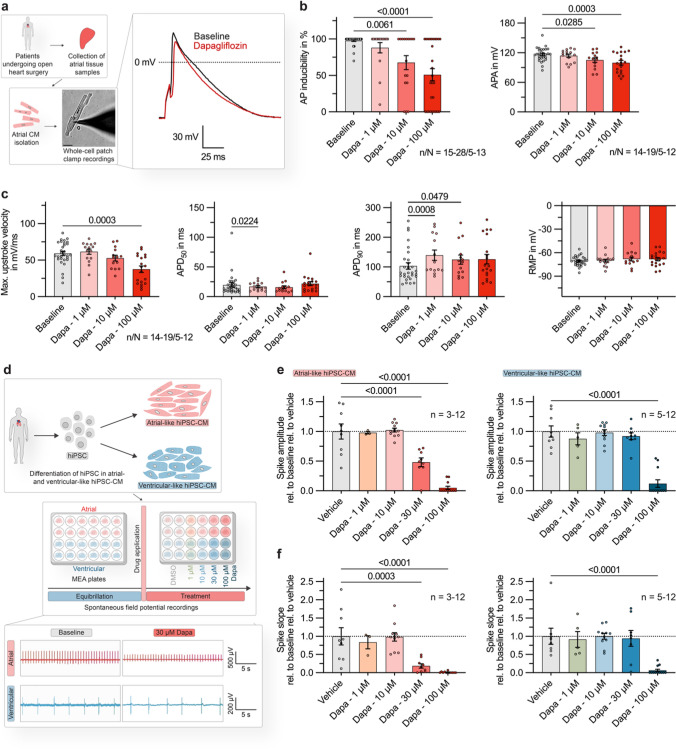
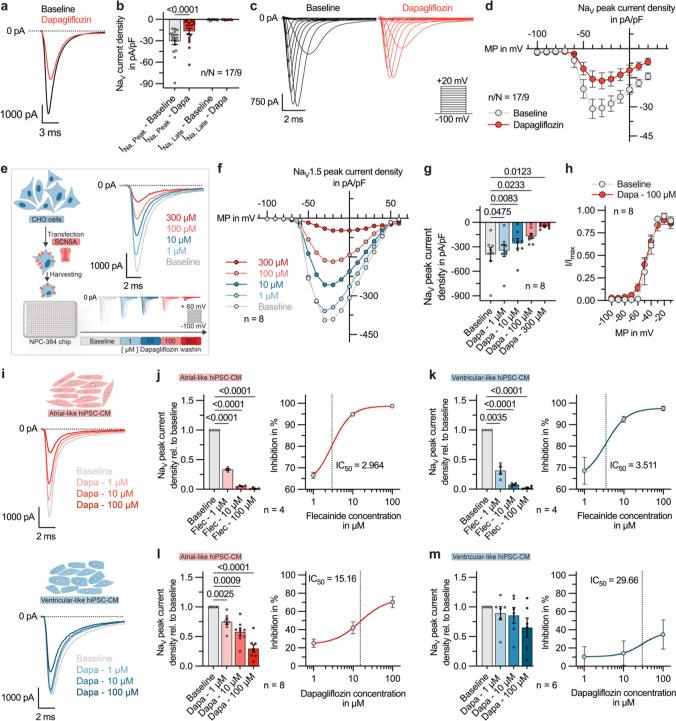
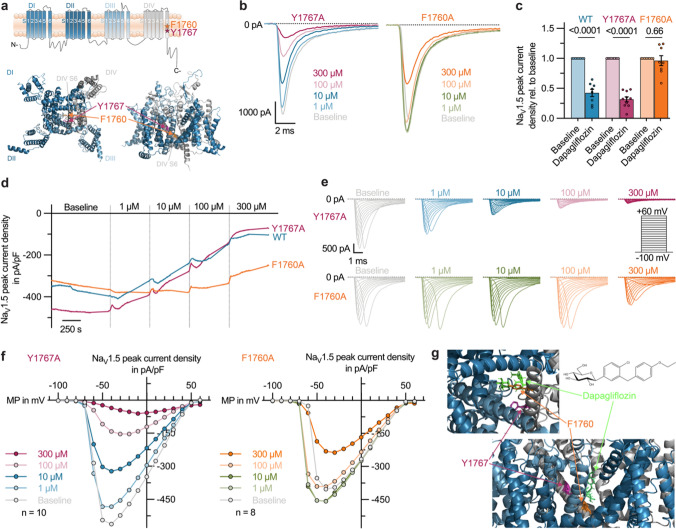
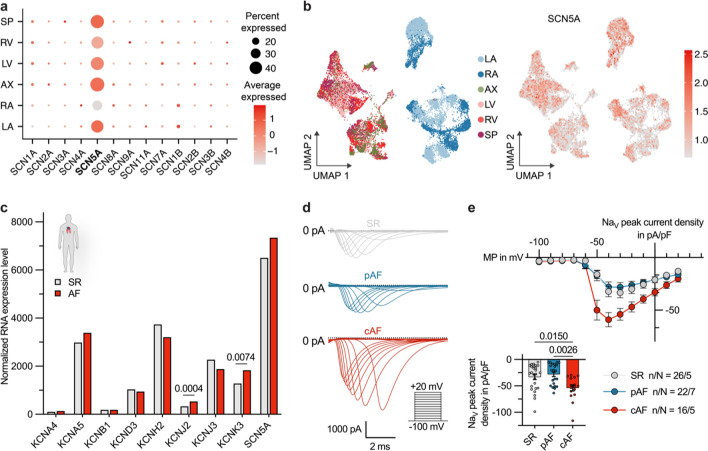
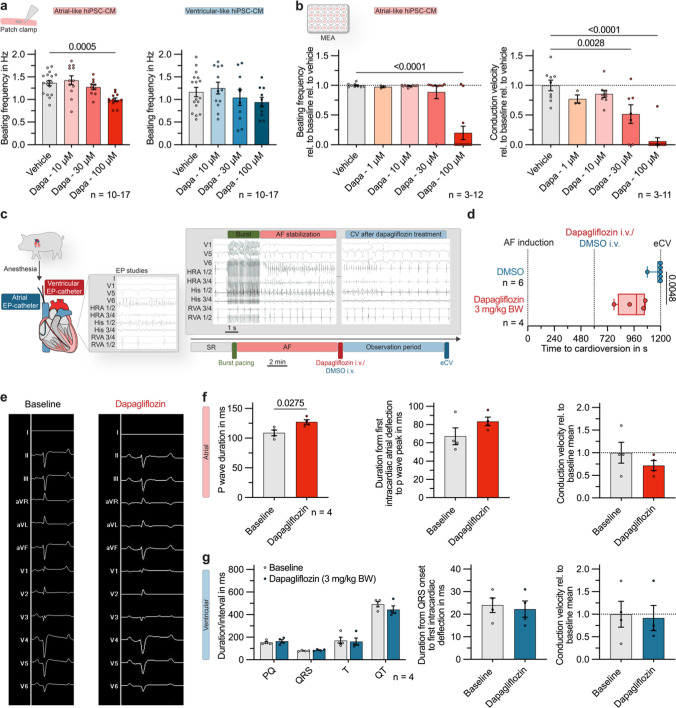
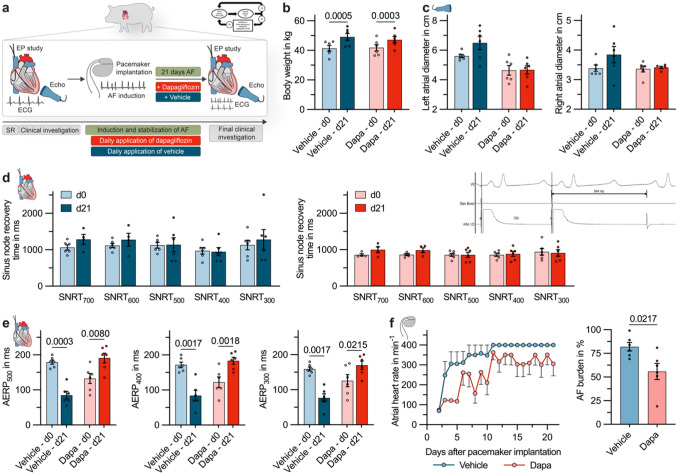
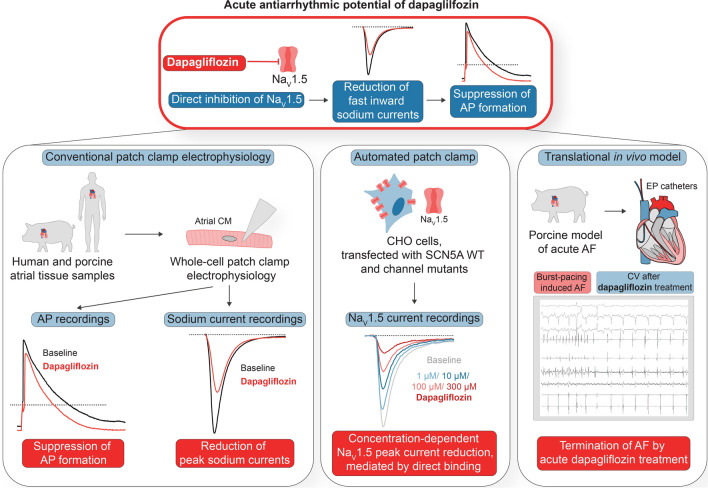
In recent years, SGLT2 inhibitors have become an integral part of heart failure therapy, and several mechanisms contributing to cardiorenal protection have been identified. In this study, we place special emphasis on the atria and investigate acute electrophysiological effects of dapagliflozin to assess the antiarrhythmic potential of SGLT2 inhibitors. Direct electrophysiological effects of dapagliflozin were investigated in patch clamp experiments on isolated atrial cardiomyocytes. Acute treatment with elevated-dose dapagliflozin caused a significant reduction of the action potential inducibility, the amplitude and maximum upstroke velocity. The inhibitory effects were reproduced in human induced pluripotent stem cell-derived cardiomyocytes, and were more pronounced in atrial compared to ventricular cells. Hypothesizing that dapagliflozin directly affects the depolarization phase of atrial action potentials, we examined fast inward sodium currents in human atrial cardiomyocytes and found a significant decrease of peak sodium current densities by dapagliflozin, accompanied by a moderate inhibition of the transient outward potassium current. Translating these findings into a porcine large animal model, acute elevated-dose dapagliflozin treatment caused an atrial-dominant reduction of myocardial conduction velocity in vivo. This could be utilized for both, acute cardioversion of paroxysmal atrial fibrillation episodes and rhythm control of persistent atrial fibrillation. In this study, we show that dapagliflozin alters the excitability of atrial cardiomyocytes by direct inhibition of peak sodium currents. In vivo, dapagliflozin exerts antiarrhythmic effects, revealing a potential new additional role of SGLT2 inhibitors in the treatment of atrial arrhythmias.

Keywords: Atrial action potential; Atrial fibrillation; Dapagliflozin; NaV1.5; SGLT2 inhibitors.


Conflict of interest statement

C.S. received research funding from Böhringer Ingelheim, Ingelheim, Germany. All other authors declare that they have no competing interests.

Figures

Fig. 1
Fig. 1
Effect of acute dapagliflozin treatment on action potential (AP) formation in isolated porcine atrial cardiomyocytes (CMs). a Left: Experimental protocol: fresh atrial tissue samples from N = 13 pigs were enzymatically digested. APs from n = 26 isolated CMs were recorded at baseline and after administration of dapagliflozin (100 µmol/L), using current clamp measurements in a whole-cell configuration with ruptured patches. The scalebar in the lower panel indicates 25 µm. Right: Representative AP recordings, obtained from a porcine atrial CM at baseline and after administration of dapagliflozin (100 µmol/L). b Representative AP recordings, under baseline conditions and in the time course after administration of dapagliflozin (100 µmol/L). c AP inducibility (percentage of pulses evoking an AP, out of 10 current pulses elicited at a rate of 0.5 Hz; n/N = 26/13), AP amplitude (APA) and maximum upstroke velocity of elicited APs (n/N = 21/11) at baseline and 5 min after application of dapagliflozin (100 µmol/L). d AP inducibility (n/N = 26/13), APA and maximum upstroke velocity (n/N = 19–22/11) relative to baseline values in the time course after administration of dapagliflozin (100 µmol/L; stimulation frequency = 0.5 Hz). e AP duration at 50% and 90% repolarization (APD50, APD90) and resting membrane potential (RMP) at baseline and 5 min after application of dapagliflozin (100 µmol/L; n/N = 21/11; stimulation frequency = 0.5 Hz). f APD50, APD90 and RMP relative to baseline values in the time course after administration of dapagliflozin (100 µmol/L; n/N = 19–22/11; stimulation frequency = 0.5 Hz). g Representative APs recorded at stimulation frequencies of 0.5, 1, and 2 Hz are shown under baseline conditions and after administration of dapagliflozin (100 µmol/L). h Violin plots showing dapagliflozin effects on AP inducibility (n/N = 14/8) and AP parameters (n/N = 9/6) at 0.5, 1 and 2 Hz stimulation frequency. Unless otherwise stated, data are shown as mean ± SEM. P-values were derived from paired Student’s t-tests
Fig. 2
Fig. 2
Direct electrophysiological effects of dapagliflozin on human atrial cardiomyocytes (CMs). a Left: Experimental protocol: fresh atrial tissue samples were obtained from N = 14 patients undergoing open heart surgery. APs from n = 34 isolated CMs were recorded at baseline and after administration of dapagliflozin at various concentrations (1, 10, 100 µmol/L), using current clamp measurements in a whole-cell configuration with ruptured patches. The scalebar in the lower panel indicates 25 µm. Right: Representative AP recordings, obtained from a human atrial CM at baseline and after administration of dapagliflozin (100 µmol/L). b AP inducibility (percentage of pulses evoking an AP, out of 10 current pulses elicited at a rate of 0.5 Hz; n/N = 15–28/5–13) and AP amplitude (APA) of elicited APs (n/N = 14–19/5–12) at baseline and 5 min after application of dapagliflozin (1, 10, 100 µmol/L). c Maximum upstroke velocity, AP duration at 50% and 90% repolarization (APD50, APD90) and resting membrane potential (RMP) in human atrial CMs under baseline conditions and 5 min after application of dapagliflozin (1, 10, 100 µmol/L; n/N = 14–19/5–12; stimulation frequency = 0.5 Hz). d Upper: Experimental protocol: human induced pluripotent stem cells (hiPSC) were differentiated in atrial- or ventricular-like hiPSC-derived CM (hiPSC-CM) and seeded on multi-electrode array (MEA) plates. Spontaneous field potentials were recorded under control conditions and after application of dapagliflozin at various concentrations (1, 10, 30, 100 µmol/L) or the vehicle. Lower: Representative field potential recordings, for atrial-and ventricular-like hiPSC-CM monolayers at baseline and 15 min after administration of dapagliflozin (30 µmol/L). e Relative spike amplitudes of field potentials recorded from atrial-(left) and ventricular-like (right) hiPSC-CM 15 min after application of dapagliflozin (1, 10, 30, 100 µmol/L; atrial: n = 3–12; ventricular: n = 5–12). f Relative spike slopes of field potentials recorded from atrial- (left) and ventricular-like (right) hiPSC-CM 15 min after application of dapagliflozin (1, 10, 30, 100 µmol/L; atrial: n = 3–12; ventricular: n = 5–12). If not indicated otherwise, data are shown as mean ± SEM. P-values were derived from ordinary one-way analysis of variance (ANOVA)
Fig. 3
Fig. 3
Dapagliflozin effects on sodium currents in human cardiomyocytes (CMs) and human NaV1.5 channels. a Representative recordings of peak sodium currents at − 30 mV, obtained from a human atrial CM at baseline and after dapagliflozin (100 µmol/L) treatment. b NaV peak and late sodium current densities at − 30 mV, measured under baseline conditions and 5 min after administration of dapagliflozin (100 µmol/L; n/N = 17/9). P-values were derived from paired Student’s t-tests. c Representative families of sodium current traces, recorded from a human atrial CM under baseline conditions and 5 min after application of dapagliflozin (100 µmol/L). The voltage protocol is depicted as inset, d Current–voltage-relationship of NaV peak current densities in human atrial CM before and 5 min after application of 100 µmol/L dapagliflozin (n/N = 17/9; MP, membrane potential). e Left: Experimental protocol: Transiently transfected Chinese hamster ovary (CHO) cells heterologously expressing human NaV1.5 channels were plated on an NPC-384 chip. Sodium currents were recorded using the SyncroPatch 384 Automated Patch Clamp (APC) system, under baseline conditions and while exposing the cells to increasing concentrations of dapagliflozin. Right: Representative NaV1.5 current traces, recorded with APC from transiently transfected CHO cells. f Current–voltage-relationship of NaV1.5 peak current densities at baseline and after stepwise increase of the dapagliflozin concentration from 1 to 300 µmol/L (n = 8). g NaV1.5 peak current densities of the respective recordings, quantified at -20 mV (n = 8). h Activation curve of NaV1.5 channels expressed in CHO cells calculated from Boltzmann fits under baseline conditions and dapagliflozin treatment (100 µmol/L; n = 8). i Representative sodium current traces, recorded with APC from atrial- and ventricular-like hiPSC-CM under baseline conditions and after administration of increasing dapagliflozin concentrations (1, 10, 100 µmol/L). j Left: NaV peak sodium current densities relative to baseline values, recorded from atrial-like hiPSC-CM under baseline conditions and during perfusion with flecainide at increasing concentrations (1, 10, 100 µmol/L; n = 4). Right: Dose–response-curve of NaV peak current inhibition by flecainide in atrial-like hiPSC-CM (IC50 = 2.96; n = 4). k Left: NaV peak sodium current densities relative to baseline values, recorded from ventricular-like hiPSC-CM under baseline conditions and during perfusion with flecainide at increasing concentrations (1, 10, 100 µmol/L; n = 4). Right: Dose–response-curve of NaV peak current inhibition by flecainide in ventricular-like hiPSC-CM (IC50 = 3.51; n = 4). l Left: NaV peak sodium current densities relative to baseline values, recorded from atrial-like hiPSC-CM under baseline conditions and during perfusion with dapagliflozin at increasing concentrations (1, 10, 100 µmol/L; n = 8). Right: Dose–response-curve of NaV peak current inhibition by dapagliflozin in atrial-like hiPSC-CM (IC50 = 15.16; n = 8). m Left: NaV peak sodium current densities relative to baseline values, recorded from ventricular-like hiPSC-CM under baseline conditions and during perfusion with dapagliflozin at increasing concentrations (1, 10, 100 µmol/L; n = 6). Right: Dose–response-curve of NaV peak current inhibition by dapagliflozin in ventricular-like hiPSC-CM (IC50 = 29.66; n = 6). Unless stated otherwise, data are given as mean ± SEM and P-values were derived from ordinary one-way analysis of variance (ANOVA). Where indicated, the peak sodium current amplitudes were normalized to the respective cell capacitance to obtain current densities
Fig. 4
Fig. 4
Investigation of the susceptibility of molecular drug binding sites of NaV1.5 to dapagliflozin. a Three-dimensional visualization of the NaV1.5 channel based on the recently revealed cryo-EM structure of the rat NaV1.5 ortholog (PDB ID: 6UZ0 [18]). The four repetitive domains of this pseudo-tetramer, each harboring 6 segments (S1–6) are visualized in different shades of blue and the pore-lining mutants F1760 and Y1767 located in the S6 segment of the fourth domain (DIV S6) are highlighted in orange and purple, respectively. b Representative NaV1.5 current traces, recorded with Automated Patch Clamp (APC) from Chinese hamster ovary (CHO) cells transiently transfected with SCN5A pore mutants Y1767A (left) and F1760A (right) during a gradual increase of the dapagliflozin concentration (1–300 µmol/L). c NaV1.5 peak current densities relative to baseline values, measured with APC in CHO cells heterologously expressing SCN5A wild-type (WT) or pore mutants Y1767A and F1760A at -20 mV under baseline conditions and after administration of dapagliflozin (100 µmol/L; n = 8–10). d Time course of NaV1.5 peak current densities, recorded with APC from CHO cells transfected with SCN5A WT, Y1767A or F1760A during gradual increase of the dapagliflozin concentration (1–300 µmol/L). e Representative families of sodium current traces, recorded with APC from CHO cells transfected with SCN5A Y1767A or F1760A during stepwise increase of dapagliflozin concentration (1–300 µmol/L). The pulse protocol is depicted as inset. f Current–voltage-relationship of NaV1.5 peak current densities, recorded with APC from CHO cells transfected with SCN5A Y1767A (left) or F1760A (right) at baseline and after stepwise administration of dapagliflozin (1–300 µmol/L) (n = 8–10; MP, membrane potential). g Hypothetical docking of dapagliflozin into the NaV1.5 channel pore. The regions of the excerpts are indicated in (a) as dashed squares. Data are provided as mean ± SEM and P-values were derived from paired Student’s t-tests
Fig. 5
Fig. 5
Differential sodium channel expression between cardiac regions and rhythm states. a Expression analysis of NaV channel subunits in human cardiomyocytes (CM), based on data from the Heart Cell Atlas [23]. The size of the dots indicates the percentage of cells expressing the channel subunit within a cardiac region (AX, apex; LA, left atrium; LV, left ventricle; RA, right atrium; RV, right ventricle; SP, septum). The color represents the scaled average expression level across all cells within a cardiac sub compartment. b Uniform manifold approximation and projection (UMAP) embedding, highlighting cardiac regions on the left and normalized SCN5A expression on the right side. c Normalized RNA expression levels of important atrial ion channels compared between sinus rhythm (SR) and atrial fibrillation (AF) patients (DEseq2 analysis of bulk RNA sequencing data, derived from n = 15 SR vs. n = 15 AF samples). d Representative sodium current traces, recorded from atrial CMs of SR controls and patients with paroxysmal (pAF) or chronic (cAF) AF. e NaV peak current densities quantified at a membrane potential (MP) of − 30 mV and current–voltage-relationships n atrial CMs obtained from N patients with SR, pAF or cAF (SR: n/N = 26/5, pAF: n/N = 22/7, cAF: n/N = 16/5). Data are shown as mean ± SEM and P-values were derived from ordinary one-way analysis of variance (ANOVA)
Fig. 6
Fig. 6
Antiarrhythmic effect of dapagliflozin in an in vivo large animal model of acute atrial fibrillation (AF). a Spontaneous beating frequency of atrial- and ventricular-like hiPSC-derived cardiomyocytes (hiPSC-CM), recorded with patch clamp under control conditions or exposition to dapagliflozin (10, 30, 100 µmol/L; atrial: n = 10–17; ventricular: n = 10–17). b Beating frequency (n = 3–12) and conduction velocity (n = 3–11) quantified from multi-electrode array (MEA) recordings of atrial-like hiPSC-CM monolayers relative to baseline values 15 min after application of dapagliflozin (1, 10, 30, 100 µmol/L) or the vehicle control. c Experimental protocol of a translational pilot study: Intracardiac electrophysiology (EP) catheters were inserted in anesthetized pigs and AF episodes were induced via atrial burst stimulation. If the AF episodes were stable within a 10 min control period, intravenous bolus administration of dapagliflozin (3 mg/kg body weight) or the appropriate solvent control (DMSO; dimethyl sulfoxide) was performed and the time to conversion to sinus rhythm (SR) was determined. If no conversion had occurred within 10 min, electrical cardioversion (eCV) was performed. Grey box: Representative EP recordings during burst stimulation and AF stabilization (left) and after administration of dapagliflozin (3 mg/kg body weight) showing cardioversion from AF to SR (right). d Conversion time in pigs treated with dapagliflozin (3 mg/kg body weight; n = 4) or the solvent control (n = 6). Box plots show the median and the interquartile range with whiskers ranging from minimum to maximum. The P-value was derived from Mann-Whitney-U-test. e Representative ECG recordings, obtained from pigs under control conditions and after treatment with dapagliflozin (3 mg/kg body weight). f Atrial parameters: P wave duration, duration from first intracardiac deflection to P wave peak and atrial conduction velocity in pigs under baseline conditions and after acute dapagliflozin treatment (3 mg/kg body weight; n = 4). g Ventricular parameters: ECG parameters, duration from QRS onset to first intracardiac deflection and ventricular conduction velocity in pigs under baseline conditions and after acute dapagliflozin treatment (3 mg/kg body weight; n = 4). Unless indicated otherwise, data are given as mean ± SEM and P-values were derived from Student´s t-tests
Fig. 7
Fig. 7
Elevated-dose dapagliflozin treatment for rhythm control in a translation large animal model of persistent atrial fibrillation (AF). a Experimental protocol: Following ECG, echocardiography, and electrophysiological (EP) studies, AV nodal ablation and dual-chamber pacemaker implantation were performed in pigs. AF was induced in n = 12 pigs over a three-week period. The pigs were randomized to dapagliflozin (3 mg/kg body weight/day i.v.; dapa; n = 6) or the corresponding solvent control (vehicle; n = 6). Finally, echocardiography and EP studies were repeated and the AF-burden over the three-week period was quantified by daily surface ECGs and pacemaker interrogation. The pacing protocol used to induce AF is shown as an inset. b Comparison of body weight between the respective groups of animals at the beginning and at the end of the experiment. c Left and right atrial diameter measured at day 0 and day 21 via echocardiography. d Sinus node recovery times (SNRTs) following 30 s of overdrive suppression by right atrial stimulation at basic cycle lengths from 300 to 700 ms, measured at day 0 and day 21 (n = 4–6, the dropouts result from measurements where the spontaneous cycle length of the pig was smaller than the respective basic cycle length). e Atrial effective refractory periods (AERPs) measured at a S1 cycle length of 500, 400, and 300 ms. f Mean atrial heart rates, derived from daily 6-lead surface ECGs. g AF load, quantified by the pacemaker devices as the time the animal spent in AF divided by the duration of the experiment. Unless indicated otherwise, data are given as mean ± SEM and P-values were derived from Student´s t-tests
Fig. 8
Fig. 8
Graphical abstract: Acute antiarrhythmic potential of dapagliflozin

References

    1. Antzelevitch C, Burashnikov A. Atrial-selective sodium channel block as a novel strategy for the management of atrial fibrillation. Ann N Y Acad Sci. 2010;1188:78–86. doi: 10.1111/j.1749-6632.2009.05086.x. - DOI - PMC - PubMed
    1. Belardinelli L, Shryock JC, Fraser H. Inhibition of the late sodium current as a potential cardioprotective principle: effects of the late sodium current inhibitor ranolazine. Heart. 2006;92(Suppl 4):iv-6–iv-14. doi: 10.1136/hrt.2005.078790. - DOI - PMC - PubMed
    1. Bode D, Semmler L, Wakula P, Hegemann N, Primessnig U, Beindorff N, Powell D, Dahmen R, Ruetten H, Oeing C, Alogna A, Messroghli D, Pieske BM, Heinzel FR, Hohendanner F. Dual SGLT-1 and SGLT-2 inhibition improves left atrial dysfunction in HFpEF. Cardiovasc Diabetol. 2021;20:7. doi: 10.1186/s12933-020-01208-z. - DOI - PMC - PubMed
    1. Böhm M, Slawik J, Brueckmann M, Mattheus M, George JT, Ofstad AP, Inzucchi SE, Fitchett D, Anker SD, Marx N, Wanner C, Zinman B, Verma S. Efficacy of empagliflozin on heart failure and renal outcomes in patients with atrial fibrillation: data from the EMPA-REG OUTCOME trial. Eur J Heart Fail. 2020;22:126–135. doi: 10.1002/ejhf.1663. - DOI - PubMed
    1. Bonora BM, Raschi E, Avogaro A, Fadini GP. SGLT-2 inhibitors and atrial fibrillation in the Food and Drug Administration adverse event reporting system. Cardiovasc Diabetol. 2021;20:39. doi: 10.1186/s12933-021-01243-4. - DOI - PMC - PubMed

Publication types