

Inpatient Costs of Treating Patients With COVID-19
- PMID: 38170519
- PMCID: PMC10765267
- DOI: 10.1001/jamanetworkopen.2023.50145
Inpatient Costs of Treating Patients With COVID-19
Abstract
Importance: With more than 6.2 million hospitalizations due to COVID-19 in the US, recognition of the average hospital costs to provide inpatient care during the pandemic is necessary to understanding the national medical resource use and improving public health readiness and related policies.
Objective: To examine the mean cost to provide inpatient care to treat COVID-19 and how it varied through the pandemic waves and by important sociodemographic patient characteristics.
Design, setting, and participants: This cross-sectional study used inpatient-level data from March 1, 2020, to March 31, 2022, extracted from a repository of clinical, administrative, and financial information covering 97% of academic medical centers across the US.
Main outcomes and measures: Cost to produce care for each stay was calculated using direct hospital costs to provide care adjusted for geographic differences in labor costs using area wage indices.
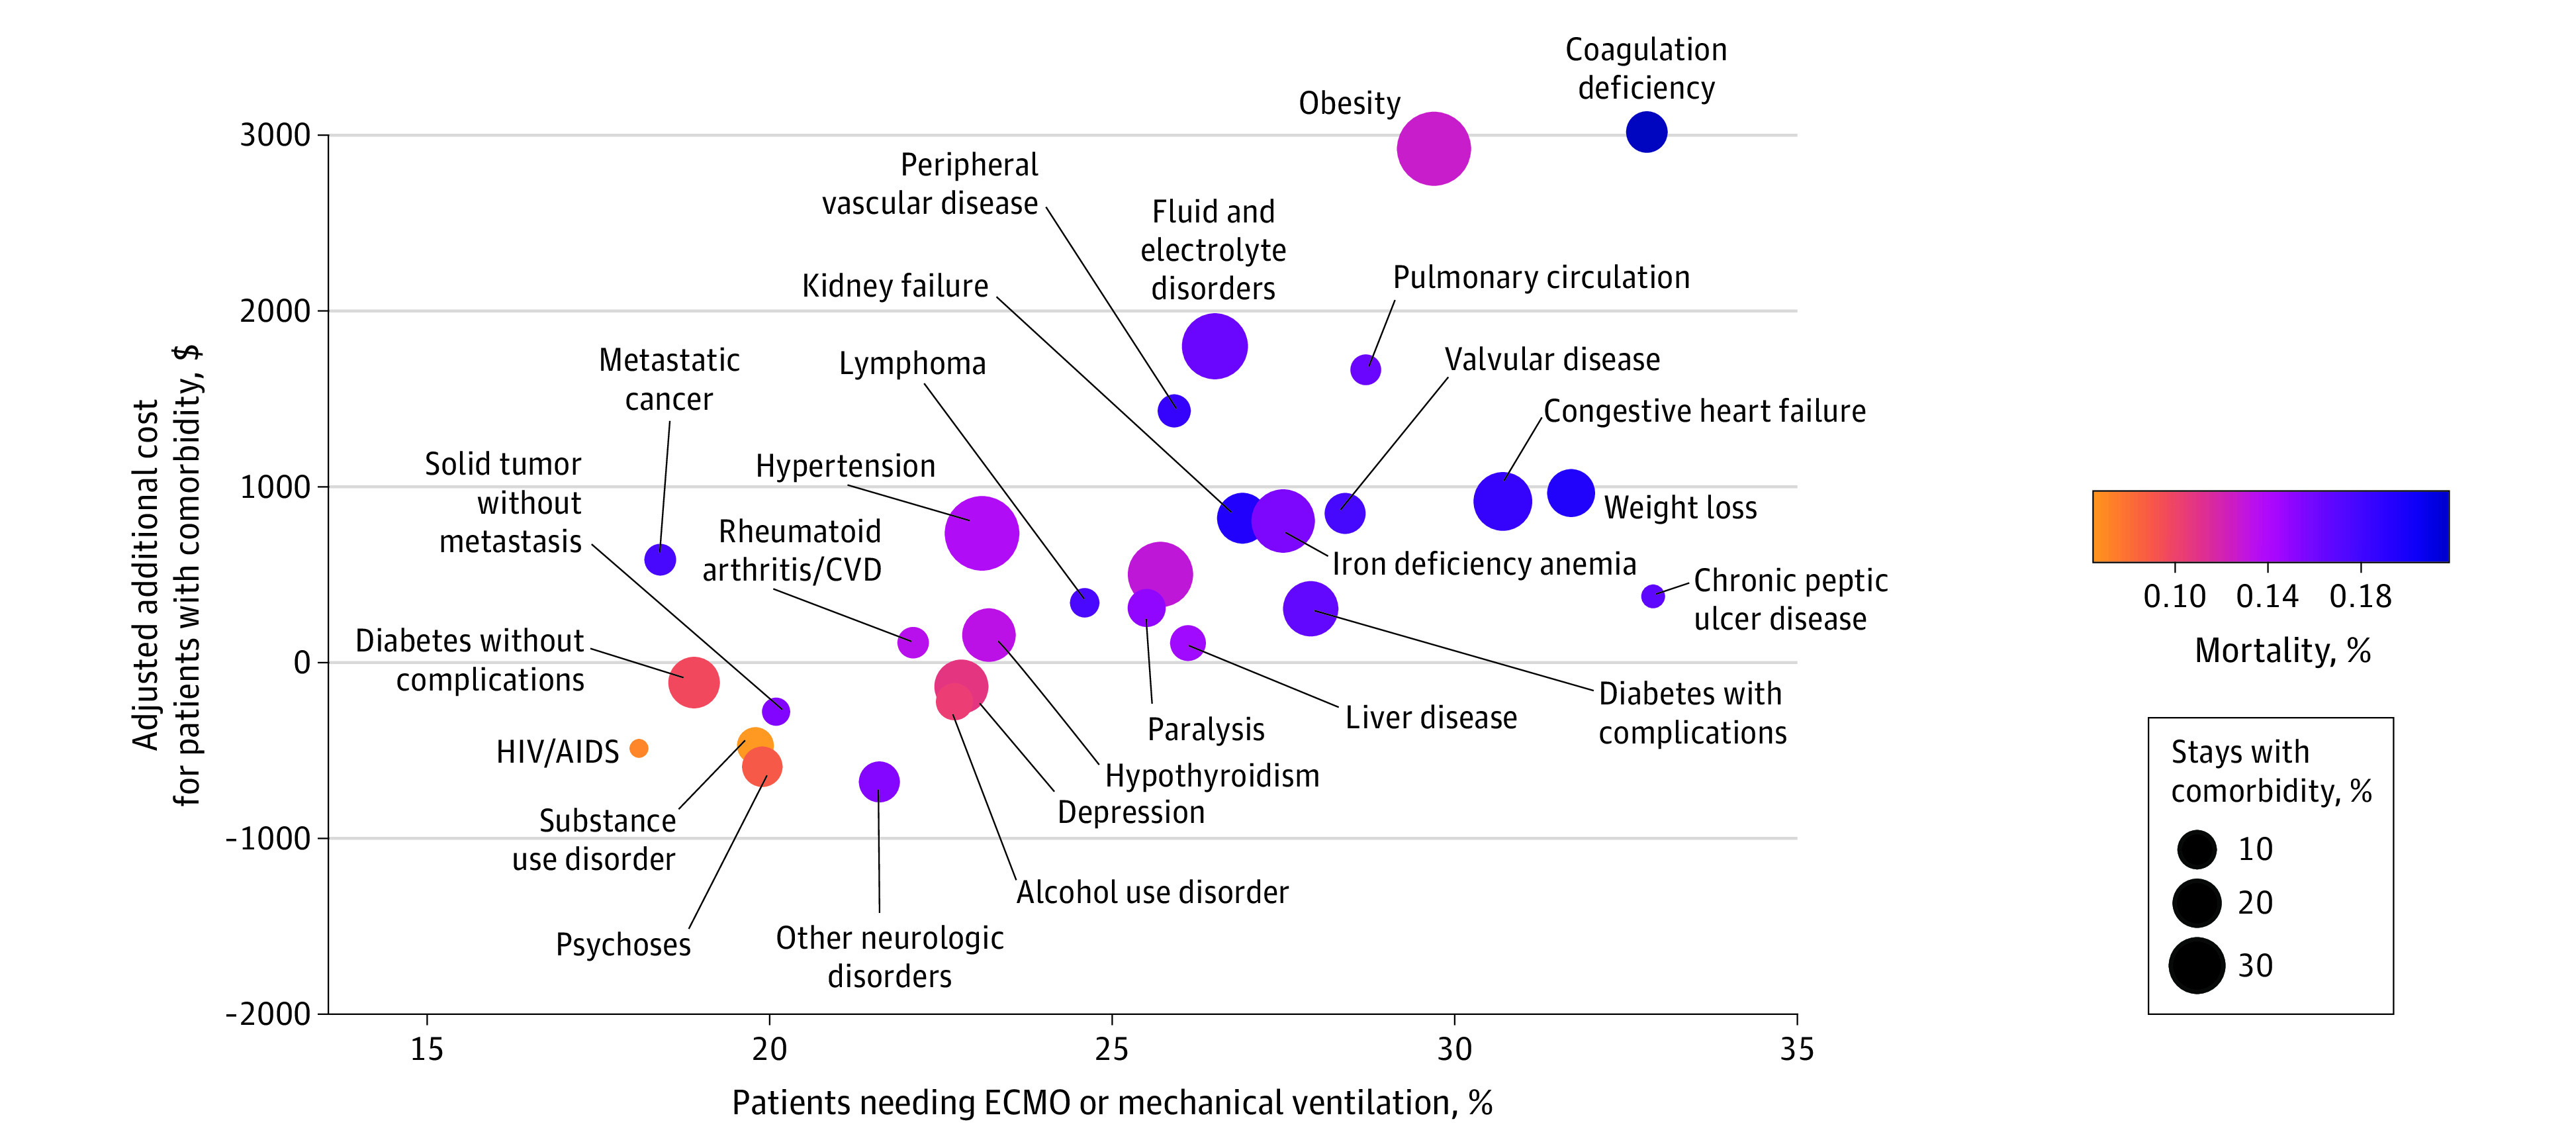
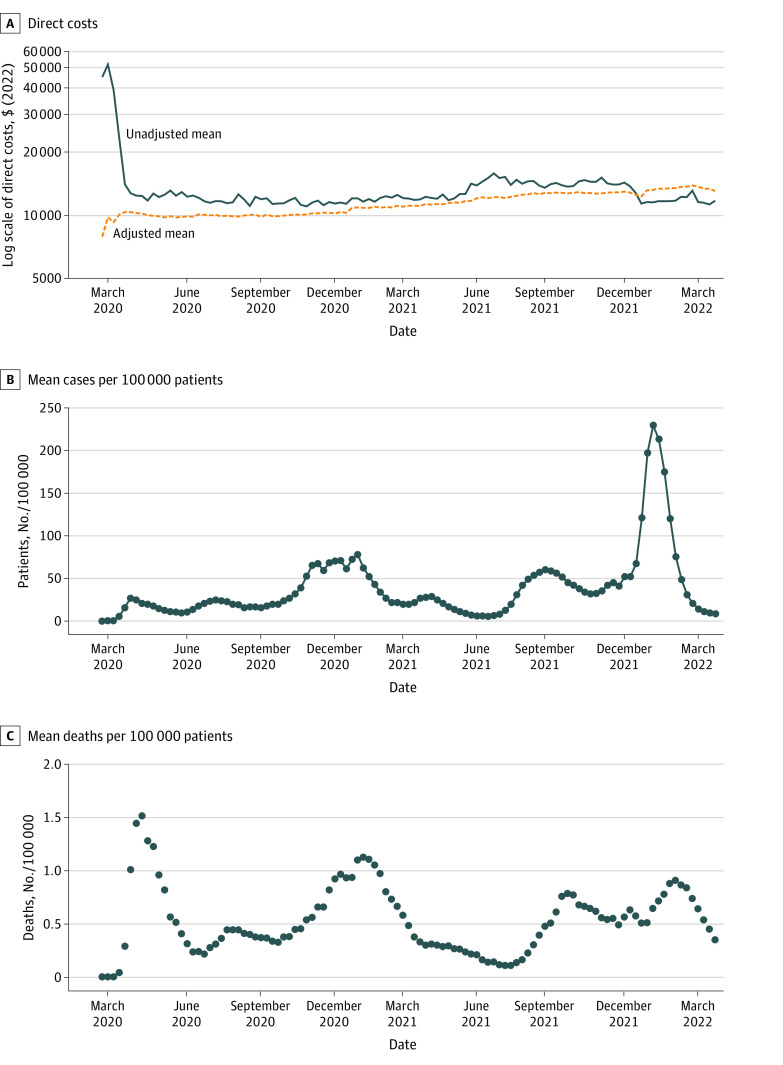
Results: The sample included 1 333 404 stays with a primary or secondary COVID-19 diagnosis from 841 hospitals. The cohort included 692 550 (52%) men, with mean (SD) age of 59.2 (17.5) years. The adjusted mean cost of an inpatient stay was $11 275 (95% CI, $11 252-$11 297) overall, increasing from $10 394 (95% CI, $10 228-$10 559) at the end of March 2020 to $13 072 (95% CI, $12 528-$13 617) by the end of March 2022. Patients with specific comorbidities had significantly higher mean costs than their counterparts: those with obesity incurred an additional $2924 in inpatient stay costs, and those with coagulation deficiency incurred an additional $3017 in inpatient stay costs. Stays during which the patient required extracorporeal membrane oxygenation (ECMO) had an adjusted mean cost of $36 484 (95% CI, $34 685-$38 284).
Conclusions and relevance: In this cross-sectional study, an adjusted mean hospital cost to provide care for patients with COVID-19 increased more than 5 times the rate of medical inflation overall. This appeared to be explained partly by changes in the use of ECMO, which increased over time.
Conflict of interest statement
Figures
References
-
- Johns Hopkins University Center for Systems Science and Engineering . COVID-19 dashboard. March 10, 2023. Accessed January 1, 2023. https://coronavirus.jhu.edu/map.html
-
- Tonna JE, Hanson HA, Cohan JN, et al. Balancing revenue generation with capacity generation: case distribution, financial impact and hospital capacity changes from cancelling or resuming elective surgeries in the US during COVID-19. BMC Health Serv Res. 2020;20(1):1119. doi: 10.1186/s12913-020-05975-z - DOI - PMC - PubMed
Publication types
MeSH terms
LinkOut - more resources
Full Text Sources
Medical
