. 2024 Jan 9;121(2):e2316540120.
doi: 10.1073/pnas.2316540120. Epub 2024 Jan 3.

Gut metabolite L-lactate supports Campylobacter jejuni population expansion during acute infection

Affiliations

Gut metabolite L-lactate supports Campylobacter jejuni population expansion during acute infection

Ritam Sinha et al. Proc Natl Acad Sci U S A. .

Abstract

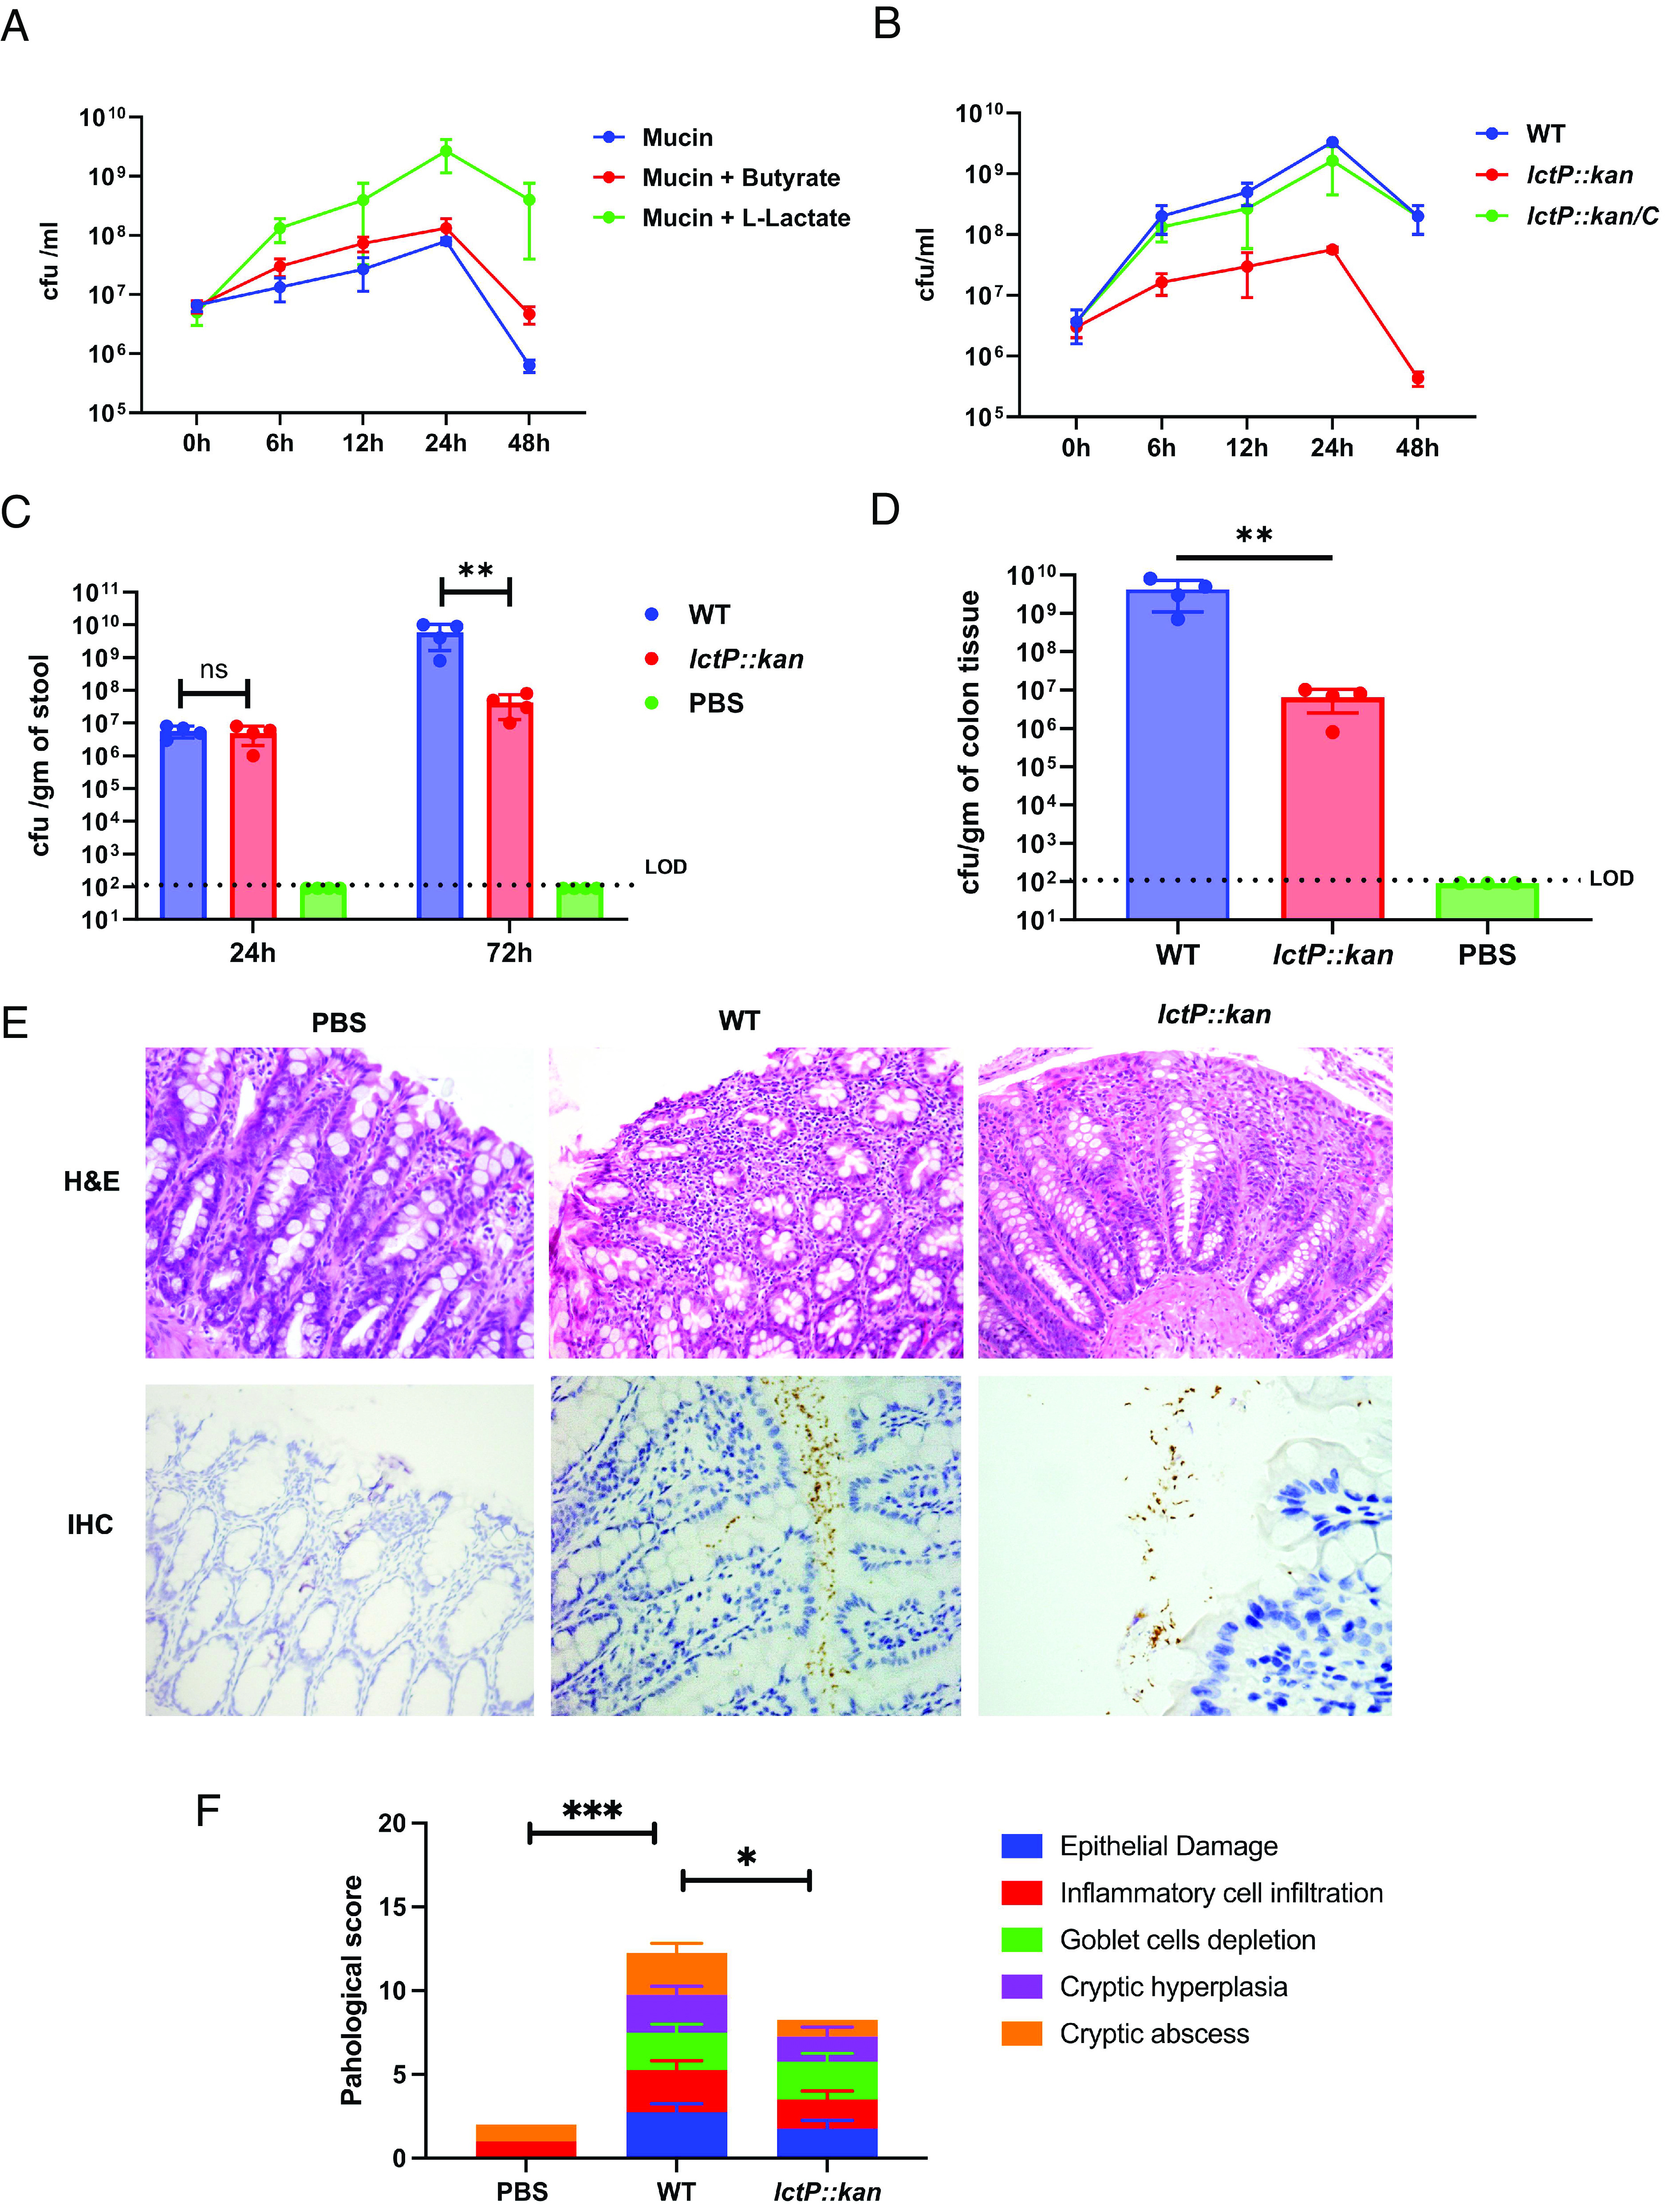
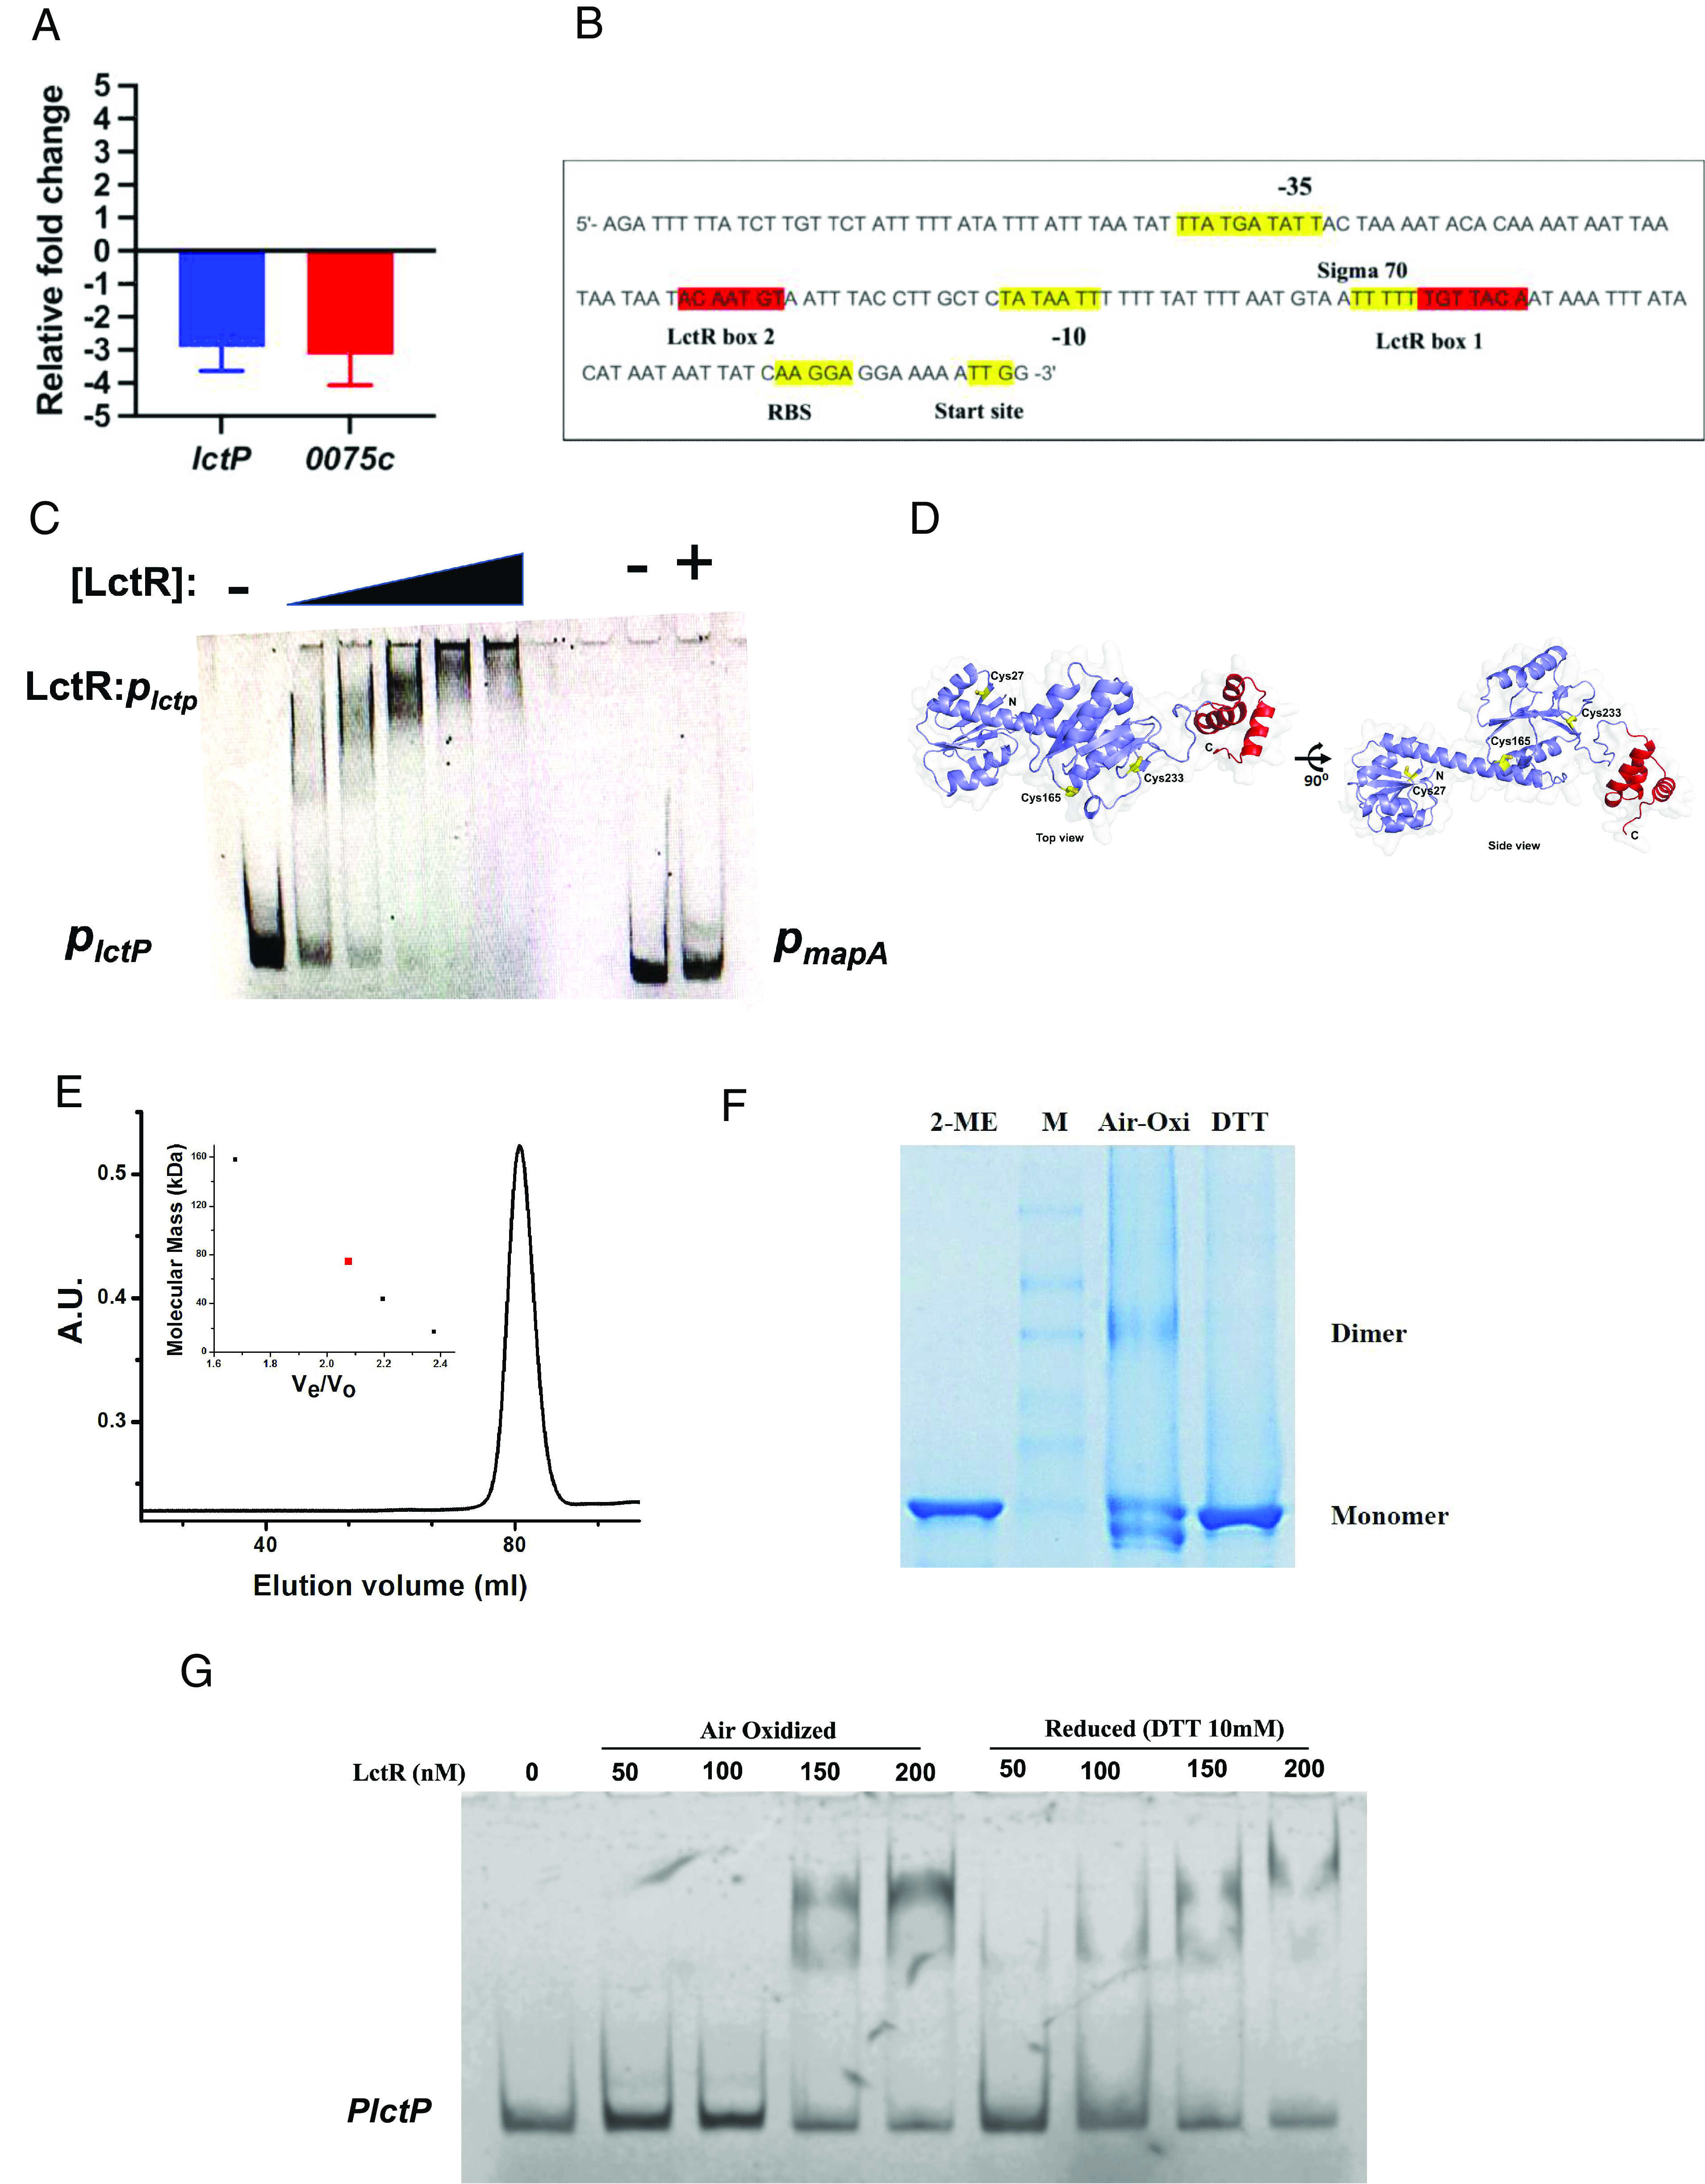
How the microaerobic pathogen Campylobacter jejuni establishes its niche and expands in the gut lumen during infection is poorly understood. Using 6-wk-old ferrets as a natural disease model, we examined this aspect of C. jejuni pathogenicity. Unlike mice, which require significant genetic or physiological manipulation to become colonized with C. jejuni, ferrets are readily infected without the need to disarm the immune system or alter the gut microbiota. Disease after C. jejuni infection in ferrets reflects closely how human C. jejuni infection proceeds. Rapid growth of C. jejuni and associated intestinal inflammation was observed within 2 to 3 d of infection. We observed pathophysiological changes that were noted by cryptic hyperplasia through the induction of tissue repair systems, accumulation of undifferentiated amplifying cells on the colon surface, and instability of HIF-1α in colonocytes, which indicated increased epithelial oxygenation. Metabolomic analysis demonstrated that lactate levels in colon content were elevated in infected animals. A C. jejuni mutant lacking lctP, which encodes an L-lactate transporter, was significantly decreased for colonization during infection. Lactate also influences adhesion and invasion by C. jejuni to a colon carcinoma cell line (HCT116). The oxygenation required for expression of lactate transporter (lctP) led to identification of a putative thiol-based redox switch regulator (LctR) that may repress lctP transcription under anaerobic conditions. Our work provides better insights into the pathogenicity of C. jejuni.

Keywords: Campylobacter jejuni; ferret model; inflammation; lactate.


Conflict of interest statement

Competing interests statement:The authors declare no competing interest.

Figures

Fig. 1.
Fig. 1.
Characterization of ferret as a natural disease model for C. jejuni pathogenesis: (A) C. jejuni 11168 WT loads were determined by CFU counts in different tissue samples day 1 and day 3 postinfection with a dose of 109 CFU/mL (n = 5). (B) The relative abundance of C. jejuni was determined in colonic contents day 1 and day 3 post infection by 16Sr RNA sequencing (PBS n = 3, Infected n = 6). (C) Immunohistochemistry (IHC) with C. jejuni specific antibody was performed to determine C. jejuni localization in colon tissue day 1 and day 3 post infection. Black arrows indicated localization of C. jejuni in infected colonic tissue. Representative images from two independent experiments. Original magnification, 40X. (D) Histology of infected and PBS-shamed ferret colonic tissue. Representative hematoxylin and eosin (H&E) stained images on day 1 and day 3 postinfection. Yellow arrow (epithelial cells), red arrows (intestinal crypts), green arrow (goblet cells), blue arrow (infiltrating leucocytes in lamina propria). Original magnification, 40X. (E) C. jejuni mediated gastroenteritis as measured by histological score of infected and uninfected (PBS) colonic tissue day 1 (D1) and day 3 (D3) postinfection (PBS n = 3, Infected n = 6). (F) Relative fold changes of proinflammatory (IL-8, IL-6, iNOS) and antiinflammatory (IL-10) cytokine genes determined by qRT-PCR analysis of infected colon tissue compared to that of the PBS control group (n = 5). Changes in gene expression were determined by the 2−ΔΔCT method. All error bars show ± SD. Statistical analysis was done by one-way AONOVA. *P < 0.05; **P < 0.01; ***P < 0.001; ****P < 0.000.
Fig. 2.
Fig. 2.
C. jejuni induced pathophysiological changes of colonic tissue during acute stage. (A) Representative image of Alcian blue staining for goblet cells of colonic tissue day 3 post infection. Original magnification, 40X. (B) Representative IHC image of day 3 post infection colonic tissue with α-Smooth Muscle Actin (SMA) specific antibody (to view tissue repair). (C) Representative image of Ki67+ proliferated cell localization and (D) count of Ki67+ cells/crypts in colonic tissue day 3 post infection. (E) Representative IHC image of day 3 post infection colonic tissue with HIF-1α and Claudin-1 specific antibody. Original magnification, 40X. All error bars show ± SD. Statistical analysis was done by unpaired two-tailed t test. *P < 0.05; **P < 0.01; ***P < 0.001; ****P < 0.000.
Fig. 3.
Fig. 3.
Changes of gut microbiota and metabolites after infection with C. jejuni in ferret. (A) Microbial representation at class-level, based on 16 s RNA sequencing, in cecal contents of infected and uninfected (PBS) ferrets day 1 and day 3 post infection. Color coding for classes is shown below the chart. (B) Differentially abundant taxa were found on day 3 between infected and uninfected (PBS) ferrets using DESeq2. As expected, Campylobacter (ZOTU6) and Clostridium sensu stricto 1 (ZOTU13) members were significantly enriched in the infected group compared to the uninfected control group (log2 fold change = 8.93, P-adj = 2.55e-06 and log2 fold change = 25.13, P-adj = 4.85e-16, respectively). On the other hand, Enterococcus durans (ZOTU12) was the only one significantly decreased in the infection group (log2 fold change = −9.53, P-adj = 5.40e-05). (C) Difference of overall metabolites of colon contents between infected and uninfected control animals on day 3 post infection by principal component analysis (PLSDA model). Each circle indicated overall metabolites of each animal, n = 3. Concentrations of selected metabolites of colon contents from infected and uninfected animals on day 3, such as (D) different TCA cycles intermediates and (E) short chain fatty acids, were determined by LC–MS mass spectrometry (n = 3). Error bars represent SD. Statistical analysis was done by unpaired two-tailed t test. *P < 0.05; **P < 0.01; ***P < 0.001; ****P < 0.000.
Fig. 4.
Fig. 4.
lctP operon is essential for pathogenesis of C. jejuni in Ferret. (A) Growth of C. jejuni 11168 WT strain in minimal media containing mucin with and without butyrate (10 mM) and L-lactate (10 mM) over 48 h was determined by CFU counts (n = 3). (B) WT, lctP::kan and complementary lctP::kan/C strains were grown in minimal media containing mucin with L-lactate (10 mM); cfu/mL growth was determined over 48 h (n = 3). Bacterial comparative colonization was determined in 5- to 6-wk old ferrets infected orally with either wild type or lctP::kan (dose of 109 CFU/mL). Bacterial loads in (C) stool and (D) colonic tissue were determined by CFU counts at different time intervals. (PBS n = 3 and infected group n = 4). (E) Representative images of H&E stained day 3 colonic tissue (20X) and IHC with day 3 colonic tissue using C. jejuni specific antibody (40X) (n = 3). (F) Histological scores of colonic tissue (PBS, WT and lctP::kan groups) were determined on day 3 post infection (PBS n = 3, Infected n = 4). LOD indicates the limit of detection. Error bars represent SD. Statistical analysis was done by one-way AONOVA. *P < 0.05; **P < 0.01; ***P < 0.001; ****P < 0.000.
Fig. 5.
Fig. 5.
Host-derived lactate influences the adherence and invasion of C. jejuni in vitro: (A) Relative fluorescence units (RFU) of C. jejuni type strain carrying lctP-gfp fusion plasmid were measured with or without HCT116 cells after 1 h of infection by spectrophometer. (n = 3). Statistical analysis was done by unpaired two-tailed t test. (B) Adherence and invasion ability of WT, lctP::kan and lctP::kan/C was determined after of 1 h of infection in HCT116 cells at an MOI was 10 (n = 3). (C) Extracellular and (D) intracellular L-lactate levels in HCT116 cells were determined after 1 h of infection with WT, lctP::kan and lctP::kan/C by ELISA (n = 3). (E) Extracellular lactate level was determined after treatment with sodium oxamate (30 mM) and 2-deoxy glucose (1 mM) by ELISA (n = 3). (F) Adherence and invasion of WT was determined in sodium oxamate and 2-deoxyglucose and untreated HCT116 cells after 1 h of infection (n = 3). Error bars represent SD. Statistical analysis was done by one-way AONOVA. *P < 0.05; **P < 0.01; ***P < 0.001; ****P < 0.000.
Fig. 6.
Fig. 6.
Redox switch protein LctR binds to the promoter of lctP. (A) Transcription analysis of two lctP operon genes (lctP and 0075c) at 2 h after growth of WT strain in minimal media containing mucin with lactate (10 mM) by quantitative RT-PCR in anaerobic and microaerobic condition. Changes in gene expression of WT strain in anaerobic conditions compared with microaerobic conditions were determined by the 2−ΔΔCT method. Data are represented as the mean value from three independent experiments ± SD. (B) Predicted promoter region of LctP (with important regions, such as –35, −10, and RBS, highlighted in yellow) and two probable LctR binding consensus sequences (5′-TGTTACA-3′, highlighted in red). (C) Determination of purified 6 × His-LctR binding capacity to the promoter region of lctP (PlctP) by EMSA. Increasing amounts of purified 6 × His-LctR were added to binding reaction mixtures containing approximately 0.25 nM either PlctP promoter fragment or the mapA-ctsW (PmapA) intergenic region as a nonspecific control. Results are representative of three biological replicates. (D) A predicted structure of LctR by alphafold program. Three cysteine residues are highlighted in yellow and a predicted HTH domain is highlighted in red. (E) Size exclusion chromatography of purified LctR. LctR eluted from Superdex column showed dimer form in normal condition. (F) The thiol based redox state of LctR was analyzed by incubating with oxidizing (Air oxidation) and reducing (DTT) agent. Redox state of LctR was determined by 10% SDS page in nonreducing condition and Coomassie staining. Representative image of three biological replicates. (G) Determination of LctR binding capacity to the PlctP promoter fragment in oxidized (Air oxidized) and reduced (DTT treated) condition by EMSA. Representative image of three biological replicates.

Update of

References

    1. Patrick M. E., et al. , Features of illnesses caused by five species of Campylobacter, Foodborne Diseases Active Surveillance Network (FoodNet)—2010–2015. Epidemiol. Infect. 146, 1–10 (2018). - PMC - PubMed
    1. Tacconelli E., et al. , Discovery, research, and development of new antibiotics: the WHO priority list of antibiotic-resistant bacteria and tuberculosis. Lancet Infect. Dis. 18, 318–327 (2018). - PubMed
    1. Manfredi R., Nanetti A., Ferri M., Chiodo F., Fatal Campylobacter jejuni bacteraemia in patients with AIDS. J. Med. Microbiol. 48, 601–603 (1999). - PubMed
    1. Fitzgerald C., Campylobacter. Clin. Lab. Med. 35, 289–298 (2015). - PubMed
    1. Young K. T., Davis L. M., Dirita V. J., Campylobacter jejuni: Molecular biology and pathogenesis. Nat. Rev. Microbiol. 5, 665–679 (2007). - PubMed

Substances

LinkOut - more resources