. 2024 Jan 9;121(2):e2306454120.
doi: 10.1073/pnas.2306454120. Epub 2024 Jan 3.

HKDC1, a target of TFEB, is essential to maintain both mitochondrial and lysosomal homeostasis, preventing cellular senescence

Affiliations

HKDC1, a target of TFEB, is essential to maintain both mitochondrial and lysosomal homeostasis, preventing cellular senescence

Mengying Cui et al. Proc Natl Acad Sci U S A. .

Erratum in

Abstract

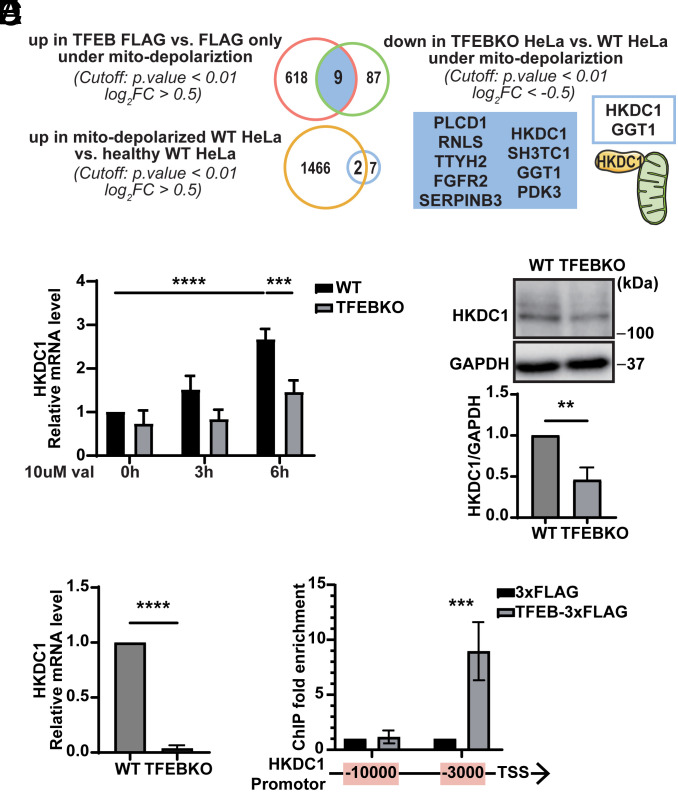
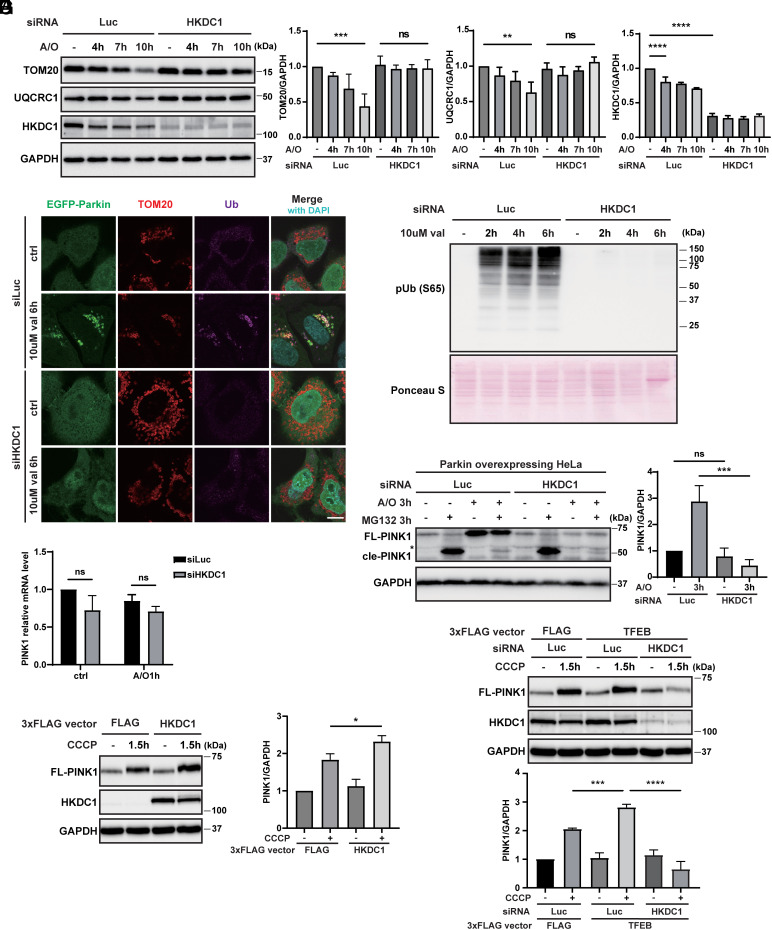
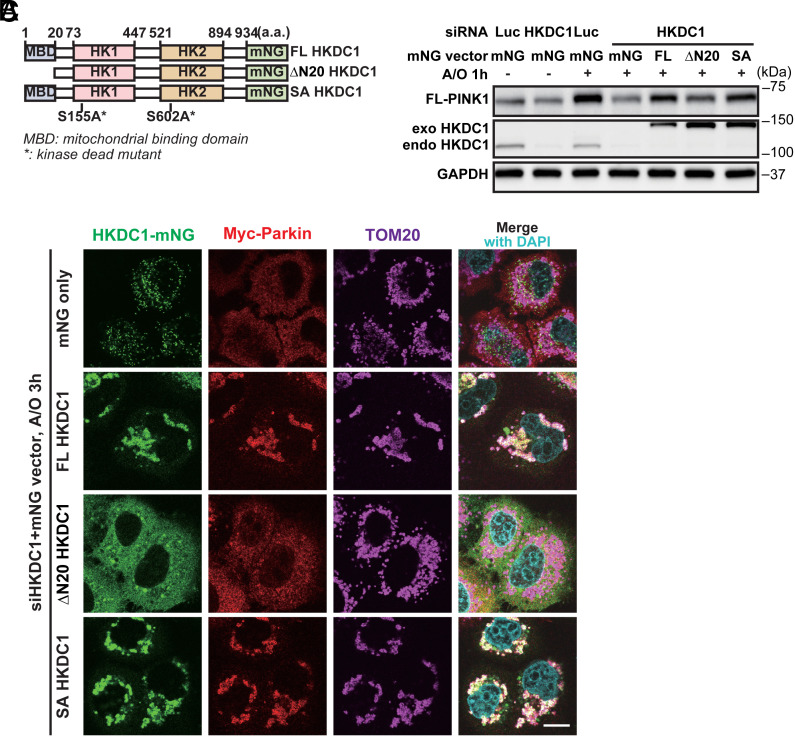
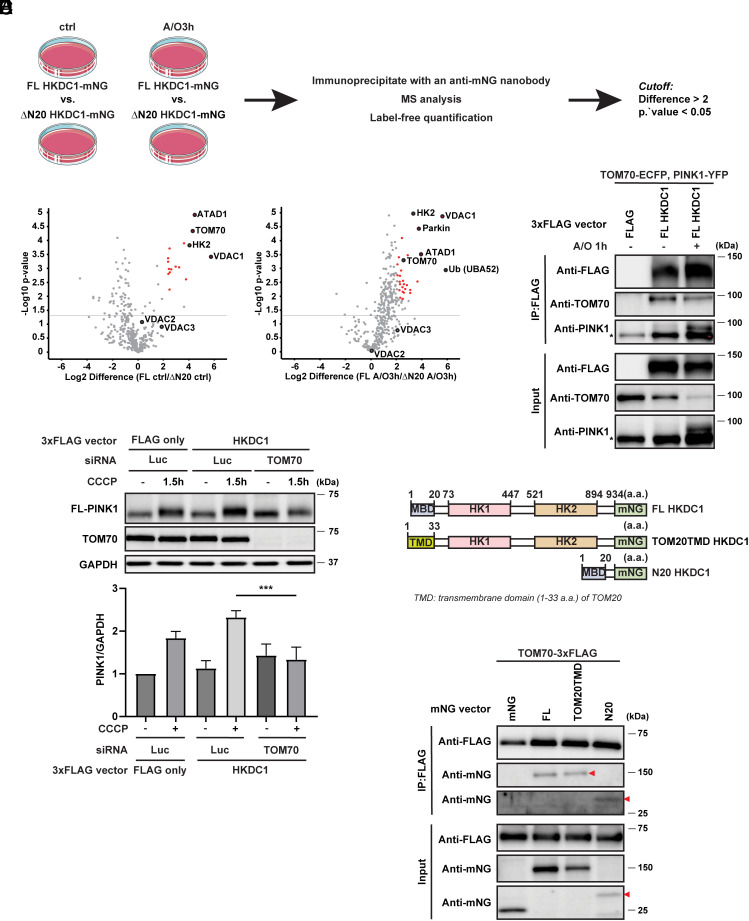
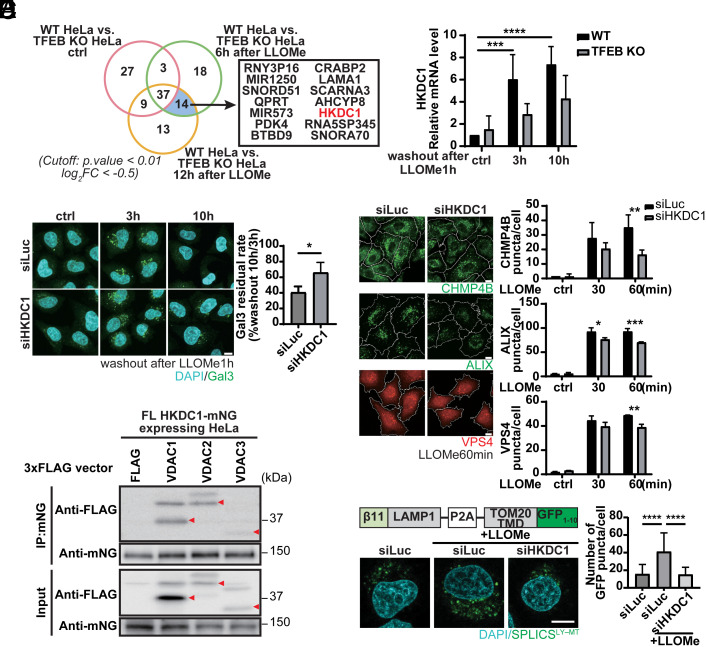
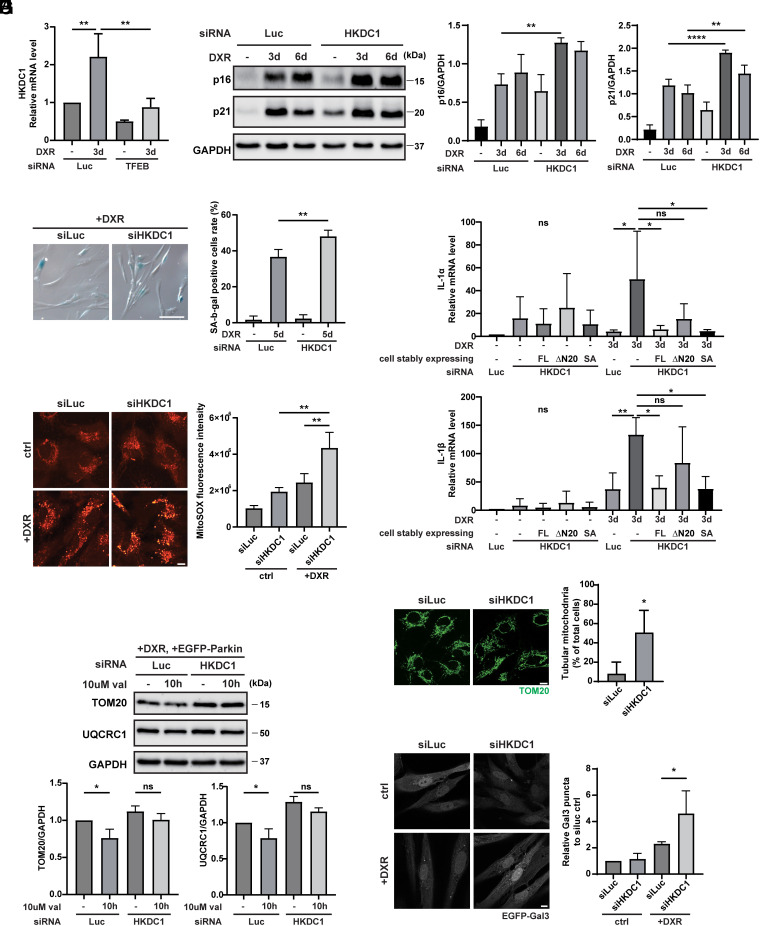
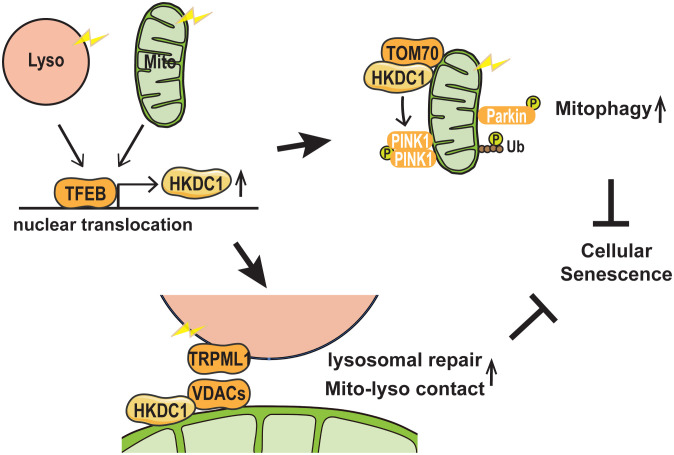
Mitochondrial and lysosomal functions are intimately linked and are critical for cellular homeostasis, as evidenced by the fact that cellular senescence, aging, and multiple prominent diseases are associated with concomitant dysfunction of both organelles. However, it is not well understood how the two important organelles are regulated. Transcription factor EB (TFEB) is the master regulator of lysosomal function and is also implicated in regulating mitochondrial function; however, the mechanism underlying the maintenance of both organelles remains to be fully elucidated. Here, by comprehensive transcriptome analysis and subsequent chromatin immunoprecipitation-qPCR, we identified hexokinase domain containing 1 (HKDC1), which is known to function in the glycolysis pathway as a direct TFEB target. Moreover, HKDC1 was upregulated in both mitochondrial and lysosomal stress in a TFEB-dependent manner, and its function was critical for the maintenance of both organelles under stress conditions. Mechanistically, the TFEB-HKDC1 axis was essential for PINK1 (PTEN-induced kinase 1)/Parkin-dependent mitophagy via its initial step, PINK1 stabilization. In addition, the functions of HKDC1 and voltage-dependent anion channels, with which HKDC1 interacts, were essential for the clearance of damaged lysosomes and maintaining mitochondria-lysosome contact. Interestingly, HKDC1 regulated mitophagy and lysosomal repair independently of its prospective function in glycolysis. Furthermore, loss function of HKDC1 accelerated DNA damage-induced cellular senescence with the accumulation of hyperfused mitochondria and damaged lysosomes. Our results show that HKDC1, a factor downstream of TFEB, maintains both mitochondrial and lysosomal homeostasis, which is critical to prevent cellular senescence.

Keywords: HKDC1; TFEB; cellular senescence; mitochondria–lysosome contact; mitophagy.


Conflict of interest statement

Competing interests statement:T. Yoshimori and S.N. are founders of AutoPhagyGO.

Figures

Fig. 1.
Fig. 1.
HKDC1 is a direct target of TFEB that is upregulated upon mitochondrial depolarization. (A) RNA-seq analysis results are shown in Venn diagrams depicting the numbers of DEGs of these groups: upregulated genes in TFEB-3xFLAG expressing HeLa cells relative to 3xFLAG expressing HeLa cells under mitochondrial depolarization condition, downregulated genes in TFEB KO HeLa cells relative to WT HeLa cells under mitochondria depolarization condition, the overlap of two groups above, and upregulated genes in HeLa cells with depolarized mitochondria relative to healthy HeLa cells. N = 3. (B) Relative mRNA expression of HKDC1 in WT or TFEB KO HeLa cells treated with 10 μM val for 0 h, 3 h, or 6 h. Data were normalized by Glyceraldehyde-3-Phosphate Dehydrogenase (GAPDH) and are expressed relative to WT untreated with val. N = 3. (C and D) Representative western blot (WB) (C. Upper) and quantitated (C. Lower) and relative (D) mRNA expression of HKDC1 in immortalized kidney PTECs extracted from TFEBflox/flox (WT) and TFEBflox/flox; Kap-cre (KO) mice. N = 3. (E) ChIP-qPCR analyses of HeLa cells transiently expressing 3xFLAG or TFEB-3xFLAG in the regions 3,000 or 10,000 bp upstream of HKDC1 TSS. The bar chart shows the amount of immunoprecipitated DNA as detected by qPCR assay. N = 3. Values are represented as the mean ± SD, and P-values (**P < 0.01, ***P < 0.001, ****P < 0.0001) were determined by one-way ANOVA with Tukey’s multiple comparison test (B and E) or unpaired t test (C and D).
Fig. 2.
Fig. 2.
HKDC1 deficiency hampers PINK1/Parkin-mediated mitophagy. (A) Representative WB (Left) and quantification (Right) of TOM20, UQCRC1, and HKDC1 expression in siLuc- or siHKDC1-transfected HeLa cells overexpressing Myc-Parkin treated with A/O for 0, 4, 7, or 10 h. N = 3. (B) Representative images of EGFP-Parkin, TOM20, and Ub detected by immunofluorescence (IF) in siLuc- or siHKDC1-transfected HeLa cells overexpressing EGFP-Parkin treated with or without 10 μM val for 6 h. Nuclei were stained with DAPI. N = 3. (Scale bar, 10 μm.) (C) Expression of p-Ub in siLuc- or siHKDC1-transfected HeLa cells overexpressing EGFP-Parkin treated with 10 μM val for 0, 2, 4, or 6 h and detected by WB. N = 3. Ponceau S staining was performed for loading control. (D) Representative WB of full-length PINK1 (FL-PINK1) and cleaved PINK1 (cle-PINK1) in siLuc- or siHKDC1-transfected HeLa cells overexpressing Myc-Parkin treated with or without A/O and 10 μM MG132 for 3 h. Relative amounts of FL-PINK1 are quantified on the Right. N = 3. The asterisk denotes non-specific bands. (E) Relative mRNA expression of PINK1 in siLuc- or siHKDC1-transfected HeLa cells overexpressing Myc-Parkin treated with or without A/O for 1 h. N = 3. (F) Representative WB (Left) and quantification (Right) of FL-PINK1 in EGFP-Parkin-expressing HeLa cells with transient control 3xFLAG or HKDC1-3xFLAG overexpression treated with or without 7.5 μM CCCP for 1.5 h. N = 3. (G) Representative WB (Upper) and quantification (Lower) of FL-PINK1 in siLuc- or siHKDC1-transfected HeLa cells overexpressing EGFP-Parkin with transient control 3xFLAG or TFEB-3xFLAG overexpression treated with or without 7.5 μM CCCP for 1.5 h. N = 3. Values are represented as the mean ± SD, and P-values (*P < 0.05, **P < 0.01, ***P < 0.001, ****P < 0.0001) were determined by one-way ANOVA with Tukey’s multiple comparison test.
Fig. 3.
Fig. 3.
Localization of HKDC1 in mitochondria is required for PINK1 accumulation and Parkin recruitment. (A) Schematic domain structure of FL HKDC1, ∆N20 HKDC1, and SA HKDC1, showing the N-terminal MBD site, two HK domains, and the mNG tag. a.a. represents amino acids. (B) Representative images of mNG-HKDC1, Myc-Parkin, and TOM20 detected by IF in siHKDC1-transfected HeLa cells overexpressing mNG, FL HKDC1-mNG, ∆N20 HKDC1-mNG, or SA HKDC1-mNG, and treated with A/O for 3 h. Nuclei were stained with DAPI. N = 3. (Scale bar, 10 μm.) (C) Representative WB of FL-PINK1, exogenous (exo) and endogenous (endo) HKDC1 in siLuc- or siHKDC1-transfected HeLa cells overexpressing Myc-Parkin and either mNG, FL HKDC1–mNG, ∆N20 HKDC1–mNG, or SA HKDC1–mNG, and treated with A/O for 1 h. N = 3.
Fig. 4.
Fig. 4.
HKDC1 interacts with the PINK1 import receptor TOM70 on mitochondria. (A) Experimental strategy for interactome analysis to identify proteins that interact with HKDC1 on mitochondria. (B) Volcano plots showing the distribution of quantified immunoprecipitated proteins from FL HKDC1-mNG-expressing cells vs. ∆N20 HKDC1-mNG-expressing cells under steady condition (Left) or mitochondrial depolarization condition (Right). Red puncta indicate candidates with a difference more than twofold and a Student’s t test P-value < 0.05. N = 3. (C) Representative immunoblots of FLAG, TOM70, and PINK1 in EGFP-Parkin-expressing HeLa cells transiently expressing TOM70-ECFP, PINK1-YFP, and 3xFLAG or FL HKDC1-3xFLAG treated with or without A/O for 1 h followed by immunoprecipitation with antibody against FLAG. N = 3. The asterisk denotes non-specific bands. (D) Representative WB (Upper) and quantification (Lower) of FL-PINK1 in siLuc- or siTOM70-treated HeLa cells overexpressing EGFP-Parkin with transient control 3xFLAG or HKDC1-3xFLAG overexpression treated with or without 7.5 μM CCCP for 1.5 h. N = 3. (E) Schematic domain structure of FL HKDC1, TOM20TMD HKDC1, and N20 HKDC1, showing the N-terminal MBD site or TMD site, two HK domains, and the mNG tag. a.a. represents amino acids. (F) Representative immunoblots of FLAG and mNG in EGFP-Parkin-expressing HeLa cells transiently expressing TOM70-3xFLAG and mNG, FL HKDC1-mNG, TOM20TMD HKDC1-mNG, or N20 HKDC1-mNG followed by immunoprecipitation with antibody against FLAG. N = 3. Red arrowheads denote TOM20TMD HKDC1-mNG or N20 HKDC1-mNG. Values are represented as the mean ± SD, and P-values (***P < 0.001) were determined by one-way ANOVA with Tukey’s multiple comparison test.
Fig. 5.
Fig. 5.
Complexes of HKDC1 with VDACs regulate mitochondria–lysosome contact and are essential for lysosomal repair. (A) RNA-seq analysis results are shown in Venn diagrams depicting the numbers of DEGs from WT vs. TFEB KO HeLa cells with or without treatment with LLOMe for 1 h followed by washout for 6 h or 12 h. N = 4. (B) Validation of qPCR-detected HKDC1 expression in WT or TFEB KO HeLa cells treated with LLOMe for 1 h followed by washout for 3 h or 10 h. N = 3. (C) Representative Gal3-antibody immunostaining images (Left) and quantification (Right) of damaged lysosomes in HKDC1 knockdown HeLa cells treated with LLOMe for 1 h followed by washout for 3 h or 10 h. Nuclei were stained with DAPI. N = 3. (Scale bar, 10 μm.) (D) Representative IF images (Left) and quantification (Right) of CHMP4B, ALIX, or VPS4 puncta in siLuc- or siHKDC1-transfected HeLa cells treated with 1 mM LLOMe for 0, 30, or 60 min. N = 3. (Scale bar, 10 μm.) (E) VDAC1-, VDAC2-, and VDAC3-3xFLAG were transiently expressed in HeLa cells stably expressing FL HKDC1–mNG. HKDC1-mNG was immunoprecipitated with mNG agarose beads. N = 3. Red arrowheads represent VDAC1, 2, and 3, respectively. (F) Schematic domain structure (Left Upper) of SPLICS reporter to detect lysosome–mitochondria (LY-MT) contact sites. Representative images (Left Lower) and quantification (Right) of SPLICS GFP punctate spots in siLuc- or siHKDC1-treated HeLa cells with or with LLOMe for 2 h. Nuclei were stained with DAPI. N (number of analyzed cells) ≥ 30. (Scale bar, 10 µm.) Values are represented as the mean ± SD, and P-values (*P < 0.05, **P < 0.01, ***P < 0.001, ****P < 0.0001) were determined by one-way ANOVA with Tukey’s multiple comparison test (B, D, and F) or unpaired t test (C).
Fig. 6.
Fig. 6.
Mitochondrial and lysosomal homeostasis maintained by HKDC1 counteracts cellular senescence. (A) qPCR-determined relative mRNA expression of HKDC1 in TFEB knockdown cells with or without DXR treatment for 3 d. N = 3. (B) Representative WB (Left) and quantification (Right) of p16 and p21 in siLuc- or siHKDC1-transfected RPE1 cells treated with 150 ng/mL DXR for 0, 3, or 6 d. N = 3. (C) Representative staining images (Left) and quantification (Right) of SA-β-gal–positive cells in siLuc- or siHKDC1-treated senescent RPE1 cells induced by DXR treatment for 5 d. N = 3. (Scale bar, 100 μm.) (D) qPCR-determined relative mRNA expression of IL-1α and IL-1β in siLuc- or siHKDC1-transfected RPE1 cells stably expressing FL HKDC1-mNG, ∆N20 HKDC1-mNG or SA HKDC1-mNG and treated with or without DXR for 3 d. N = 3. (E) Representative images (Left) and quantification (Right) of ROS with MitoSOX staining in siLuc- or siHKDC1-transfected RPE1 cells treated with or without 150 ng/mL DXR for 3 d. N = 3. (Scale bar, 10 μm.) (F) Representative images (Left) and quantification (Right) of mitochondrial morphology in siLuc- or siHKDC1-transfected RPE1 cells in the absence of DXR treatment detected by immunostaining with TOM20 antibody. N = 3. (Scale bar, 10 μm.) (G) Representative WB (Upper) and quantification (Lower) of TOM20 and UQCRC1 in siLuc- or siHKDC1-transfected RPE1 cells treated with 150 ng/mL DXR for 3 d, and with or without val for 10 h. N = 3. (H) Representative images (Left) and quantification (Right) of Gal3 puncta in siLuc- or siHKDC1-transfected RPE1 cells stably overexpressing GFP-Gal3 with or without DXR treatment. N = 3. (Scale bar, 10 μm.) Values are represented as the mean ± SD, and P-values (*P < 0.05, **P < 0.01, ****P < 0.0001) were determined by one-way ANOVA with Tukey’s multiple comparison test (AE, G, and H) or unpaired t test (F).
Fig. 7.
Fig. 7.
Schematic model of HKDC1-mediated organelle maintenance. Both mitochondrial and lysosomal stress stimulate TFEB nuclear translocation, followed by increased HKDC1 expression. HKDC1 stabilizes PINK1 through interaction with TOM70, thereby facilitating PINK1/Parkin-dependent mitophagy. Additionally, HKDC1 and the VDAC proteins with which it interacts are important for repair of damaged lysosomes and maintaining mitochondria–lysosome contact. HKDC1 prevents DNA damage–induced cellular senescence by maintaining mitochondrial and lysosomal homeostasis.

References

    1. Deus C. M., Yambire K. F., Oliveira P. J., Raimundo N., Mitochondria-lysosome crosstalk: From physiology to neurodegeneration. Trends Mol. Med. 26, 71–88 (2020). - PubMed
    1. Monteleon C. L., et al. , Lysosomes support the degradation, signaling, and mitochondrial metabolism necessary for human epidermal differentiation. J. Invest. Dermatol. 138, 1945–1954 (2018). - PMC - PubMed
    1. Zhang X., et al. , MCOLN1 is a ROS sensor in lysosomes that regulates autophagy. Nat. Commun. 7, 12109 (2016). - PMC - PubMed
    1. Demers-Lamarche J., et al. , Loss of mitochondrial function impairs lysosomes. J. Biol. Chem. 291, 10263–10276 (2016). - PMC - PubMed
    1. Bussi C., et al. , Lysosomal damage drives mitochondrial proteome remodelling and reprograms macrophage immunometabolism. Nat. Commun. 13, 7338 (2022). - PMC - PubMed

MeSH terms

Substances

LinkOut - more resources