

Biological signatures of the International Prognostic Index in diffuse large B-cell lymphoma
- PMID: 38170757
- PMCID: PMC10987882
- DOI: 10.1182/bloodadvances.2023011425
Biological signatures of the International Prognostic Index in diffuse large B-cell lymphoma
Abstract
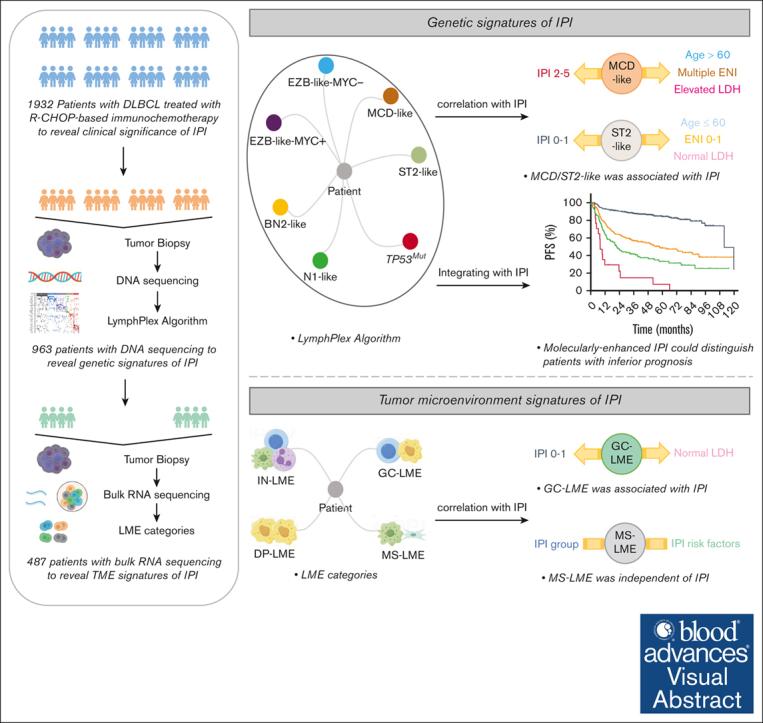
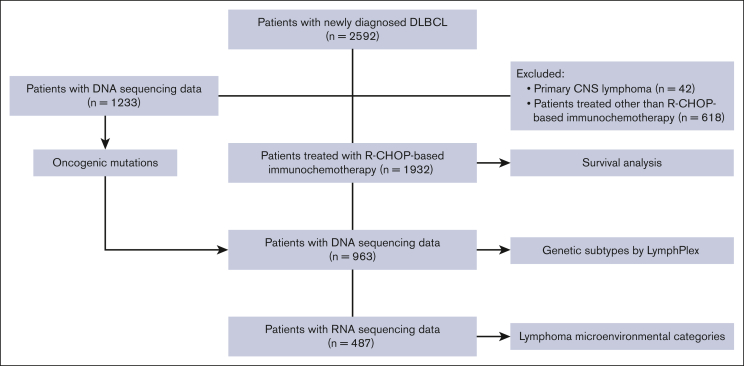
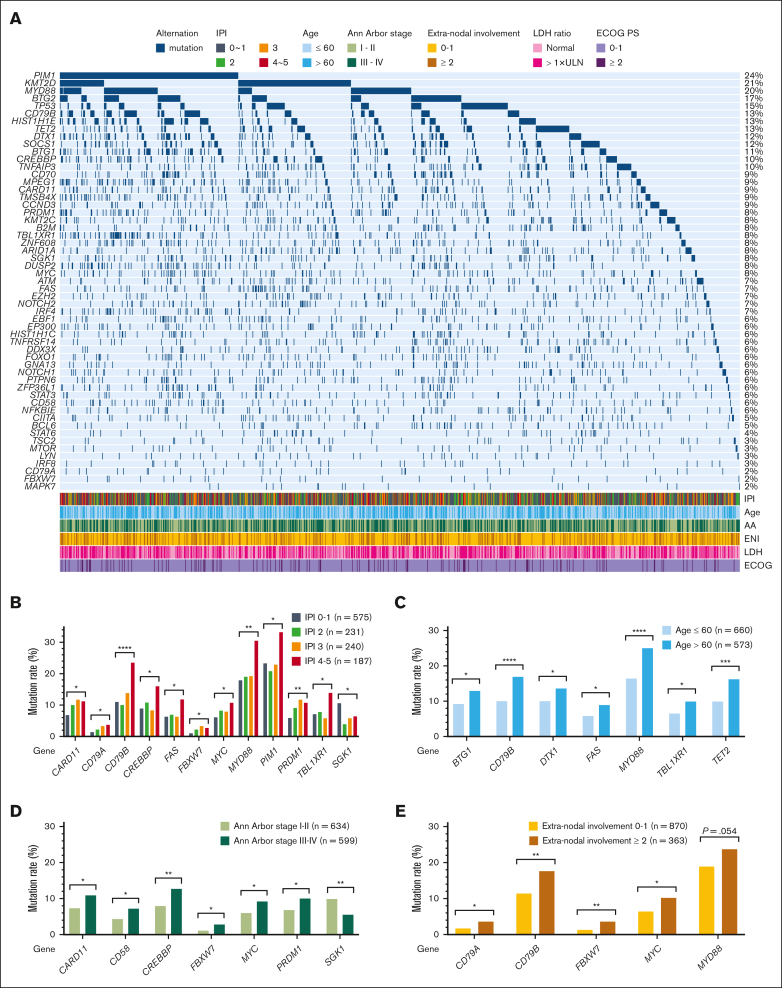
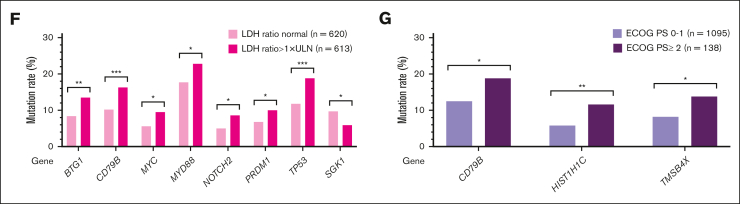
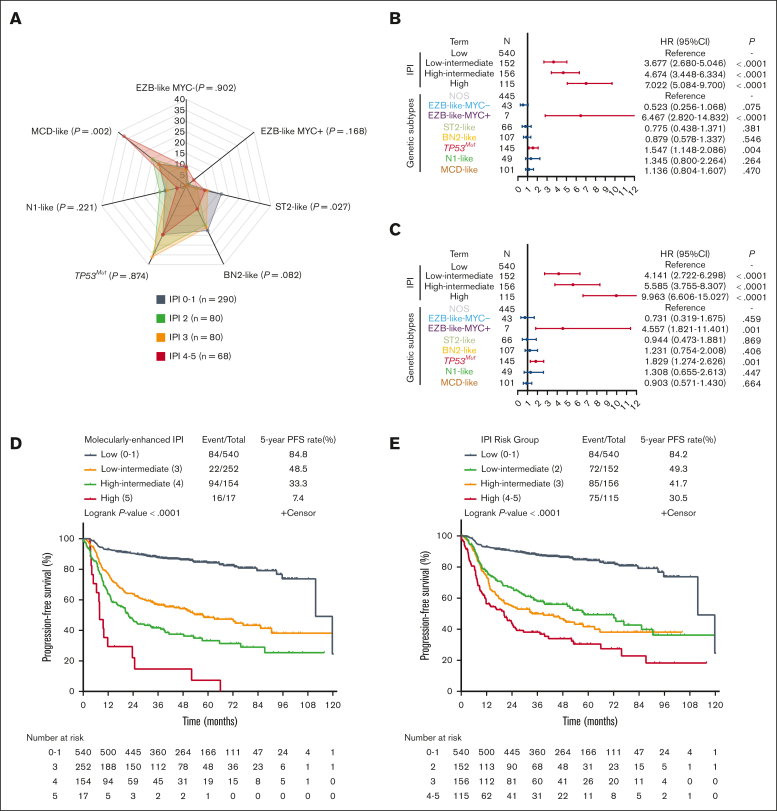
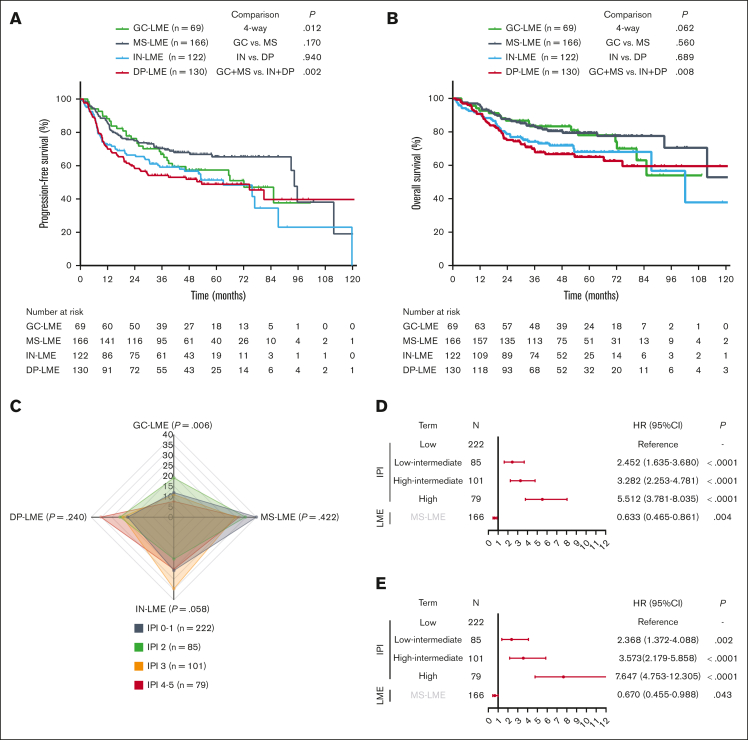
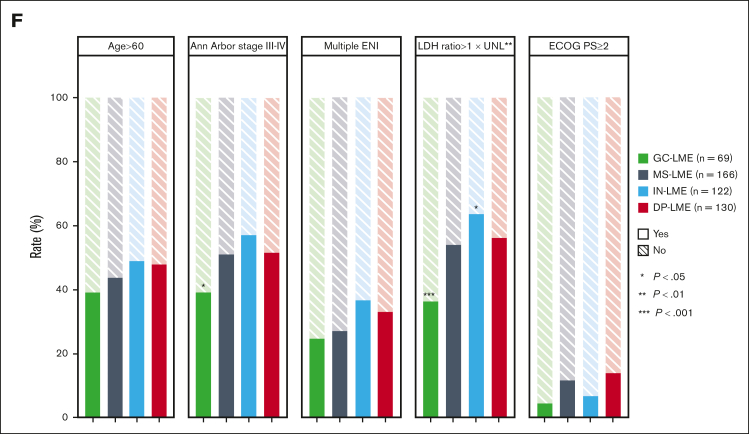
Diffuse large B-cell lymphoma (DLBCL) is a highly aggressive subtype of lymphoma with clinical and biological heterogeneity. The International Prognostic Index (IPI) shows great prognostic capability in the era of rituximab, but the biological signatures of IPI remain to be discovered. In this study, we analyzed the clinical data in a large cohort of 2592 patients with newly diagnosed DLBCL. Among them, 1233 underwent DNA sequencing for oncogenic mutations, and 487 patients underwent RNA sequencing for lymphoma microenvironment (LME) alterations. Based on IPI scores, patients were categorized into 4 distinct groups, with 5-year overall survival of 41.6%, 55.3%, 71.7%, and 89.7%, respectively. MCD-like subtype was associated with age of >60 years, multiple extranodal involvement, elevated serum lactate dehydrogenase (LDH), and IPI scores ranging from 2 to 5, whereas ST2-like subtype showed an opposite trend. Patients with EZB-like MYC+ and TP53Mut subtypes exhibited poor clinical outcome independent of the IPI; integrating TP53Mut into IPI could better distinguish patients with dismal survival. The EZB-like MYC-, BN2-like, N1-like, and MCD-like subtypes had inferior prognosis in patients with IPI scores of ≥2, indicating necessity for enhanced treatment. Regarding LME categories, the germinal center-like LME was more prevalent in patients with normal LDH and IPI scores of 0 to 1. The mesenchymal LME served as an independent protective factor, whereas the germinal center-like, inflammatory, and depleted LME categories correlated with inferior prognosis for IPI scores of 2 to 5. In summary, our work explored the biological signatures of IPI, thus providing useful rationale for future optimization of the IPI-based treatment strategies with multi-omics information in DLBCL.
© 2024 by The American Society of Hematology. Licensed under Creative Commons Attribution-NonCommercial-NoDerivatives 4.0 International (CC BY-NC-ND 4.0), permitting only noncommercial, nonderivative use with attribution. All other rights reserved.
Conflict of interest statement
Conflict-of-interest disclosure: The authors declare no competing financial interests.
Figures


Similar articles
-
Clinical characteristics and outcomes of patients with diffuse large B cell lymphoma treated with R-CHOP-like or CHOP-like regimens: an 8-year experience from a single center.Ann Palliat Med. 2020 Jul;9(4):1442-1452. doi: 10.21037/apm-19-589. Epub 2020 Jul 2. Ann Palliat Med. 2020. PMID: 32648457
-
Simplified algorithm for genetic subtyping in diffuse large B-cell lymphoma.Signal Transduct Target Ther. 2023 Apr 10;8(1):145. doi: 10.1038/s41392-023-01358-y. Signal Transduct Target Ther. 2023. PMID: 37032379 Free PMC article.
-
Assessment of CD37 B-cell antigen and cell of origin significantly improves risk prediction in diffuse large B-cell lymphoma.Blood. 2016 Dec 29;128(26):3083-3100. doi: 10.1182/blood-2016-05-715094. Epub 2016 Oct 19. Blood. 2016. PMID: 27760757 Free PMC article.
-
Prognostic impact of germinal center B-cell-like and non-germinal center B-cell-like subtypes of bone marrow involvement in patients with diffuse large B-cell lymphoma treated with R-CHOP.Medicine (Baltimore). 2018 Nov;97(45):e13046. doi: 10.1097/MD.0000000000013046. Medicine (Baltimore). 2018. PMID: 30407302 Free PMC article.
-
Treatment approach to newly diagnosed diffuse large B-cell lymphoma.Semin Hematol. 2015 Apr;52(2):107-18. doi: 10.1053/j.seminhematol.2015.01.001. Epub 2015 Jan 15. Semin Hematol. 2015. PMID: 25805590 Review.
Cited by
-
Prognostic Value of Metabolic Tumor Volume and Heterogeneity Index in Diffuse Large B-Cell Lymphoma.Medicina (Kaunas). 2025 Jul 29;61(8):1370. doi: 10.3390/medicina61081370. Medicina (Kaunas). 2025. PMID: 40870414 Free PMC article.
-
Characteristics and predictive model for diffuse large B-cell lymphoma with early chemoimmunotherapy failure.Front Immunol. 2025 Jun 16;16:1553850. doi: 10.3389/fimmu.2025.1553850. eCollection 2025. Front Immunol. 2025. PMID: 40589747 Free PMC article.
-
Comparative effectiveness of 6x R-CHOP21 versus 6x R-CHOP21 + 2 R for patients with advanced-stage diffuse large B-cell lymphoma.Blood Cancer J. 2024 Sep 12;14(1):157. doi: 10.1038/s41408-024-01137-0. Blood Cancer J. 2024. PMID: 39266543 Free PMC article.
-
Development and validation of a prognostic nomogram for diffuse large B-cell lymphoma: a multicenter cohort study from Northern China.Clin Transl Oncol. 2025 May 23. doi: 10.1007/s12094-025-03955-5. Online ahead of print. Clin Transl Oncol. 2025. PMID: 40408065
-
Prognostic value of CA125 in diffuse large B-cell lymphoma.Front Oncol. 2025 Mar 7;15:1548399. doi: 10.3389/fonc.2025.1548399. eCollection 2025. Front Oncol. 2025. PMID: 40123900 Free PMC article.
References
-
- International Non-Hodgkin's Lymphoma Prognostic Factors Project A predictive model for aggressive non-Hodgkin's lymphoma. N Engl J Med. 1993;329(14):987–994. - PubMed
-
- Xu PP, Huo YJ, Zhao WL. All roads lead to targeted diffuse large B-cell lymphoma approaches. Cancer Cell. 2022;40(2):131–133. - PubMed
-
- Miao Y, Medeiros LJ, Li Y, Li J, Young KH. Genetic alterations and their clinical implications in DLBCL. Nat Rev Clin Oncol. 2019;16(10):634–652. - PubMed
