. 2024 Jan 5;10(1):eadi2689.
doi: 10.1126/sciadv.adi2689. Epub 2024 Jan 3.

Transcriptional determinants of lipid mobilization in human adipocytes

Affiliations

Transcriptional determinants of lipid mobilization in human adipocytes

Alison C Ludzki et al. Sci Adv. .

Abstract

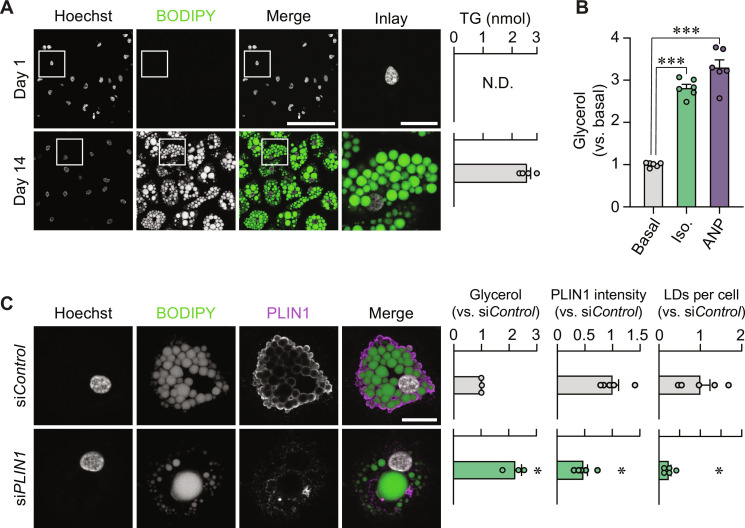
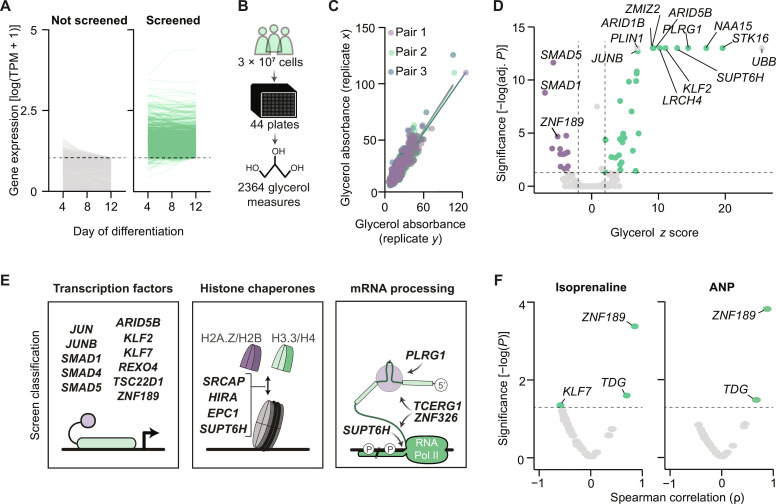
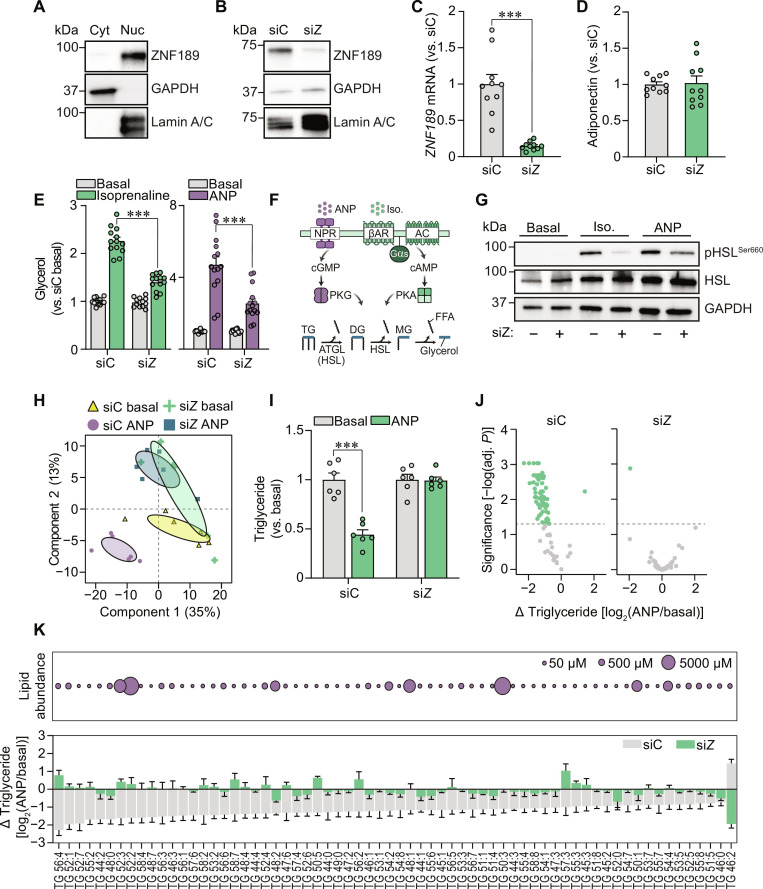
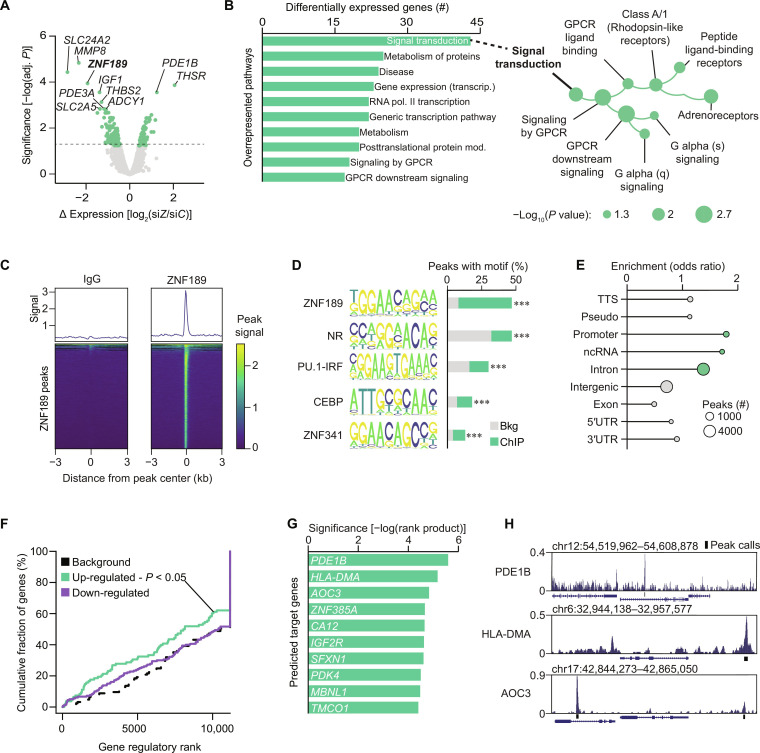
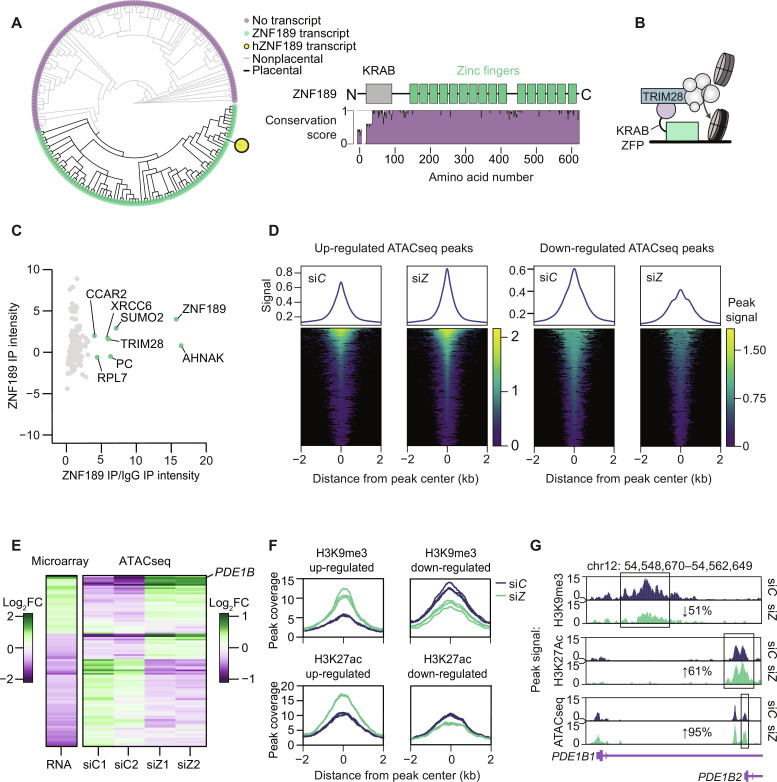
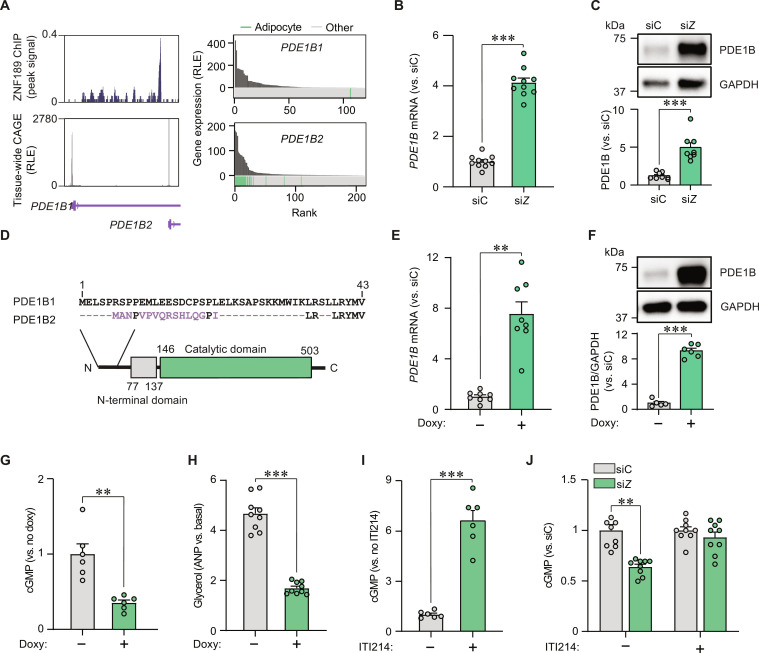
Defects in adipocyte lipolysis drive multiple aspects of cardiometabolic disease, but the transcriptional framework controlling this process has not been established. To address this, we performed a targeted perturbation screen in primary human adipocytes. Our analyses identified 37 transcriptional regulators of lipid mobilization, which we classified as (i) transcription factors, (ii) histone chaperones, and (iii) mRNA processing proteins. On the basis of its strong relationship with multiple readouts of lipolysis in patient samples, we performed mechanistic studies on one hit, ZNF189, which encodes the zinc finger protein 189. Using mass spectrometry and chromatin profiling techniques, we show that ZNF189 interacts with the tripartite motif family member TRIM28 and represses the transcription of an adipocyte-specific isoform of phosphodiesterase 1B (PDE1B2). The regulation of lipid mobilization by ZNF189 requires PDE1B2, and the overexpression of PDE1B2 is sufficient to attenuate hormone-stimulated lipolysis. Thus, our work identifies the ZNF189-PDE1B2 axis as a determinant of human adipocyte lipolysis and highlights a link between chromatin architecture and lipid mobilization.


Figures

Fig. 1.
Fig. 1.. Setting up a human adipocyte screening system.
(A) Representative images of cells stained with Hoechst (nuclei) and BODIPY (lipid droplets) at days 1 (top) and 14 (bottom) after adipogenic induction. Scale bars, 100 μm (merge) and 20 μm (inlay). Triglyceride (TG) quantification from the same time points is shown to the right. N.D., not detectable. (B) Isoprenaline (Iso.) and ANP responsiveness of adipocytes. Results are displayed as glycerol fold change versus unstimulated cells (basal). ***P < 0.001 from Tukey’s post hoc test after a one-way analysis of variance (ANOVA). (C) Representative immunofluorescence images of adipocytes transfected with nontargeting siControl or PLIN1-targeting siRNA (siPLIN1). Cells were stained with Hoechst, BODIPY, and PLIN1 antibody. Scale bar, 20 μm. Glycerol release, PLIN1 intensity, and lipid droplets (LDs) per cell are presented to the right versus siControl. *P < 0.05 from a Welch’s two-tailed t test. Replicates are highlighted by dots and are based on at least three independent experiments. Bar charts are presented as means ± SEM.
Fig. 2.
Fig. 2.. Perturbation screening identifies 37 regulators of lipolysis.
(A) Expression of genes from Dharmacon’s transcriptional regulator siRNA library measured at three time points during adipogenesis. Genes with tags per million (TPM) > 10 at day 12 of differentiation were selected for screening. (B) Schematic representation of the lipolysis screen. (C) Pearson correlations for replicate pairs of glycerol measures from the lipolysis screen. (D) Thirty-seven hits from the lipolysis screen are highlighted in purple (stimulators) and green (suppressors). P values reflect Dunnet’s post hoc test after a one-way ANOVA. (E) Classification of lipolysis screen hits from (D). (F) Volcano plots displaying Spearman’s correlations between gene expression of screen hits and isoprenaline and ANP-stimulated lipolysis. Measures were performed in subcutaneous WAT samples (n = 12).
Fig. 3.
Fig. 3.. ZNF189 regulates hormone-stimulated lipolysis.
(A and B) Representative Western blots of ZNF189, glyceraldehyde-3-phosphate dehydrogenase (GAPDH) (cytosolic), and Lamin A/C (nuclear) in cytosolic (Cyt) and nuclear (Nuc) adipocyte fractions (A) and nuclear fractions from adipocytes electroporated with siRNAs targeting ZNF189 (siZ) or nontargeting control (siC) (B). (C to E) Gene expression (C), adiponectin secretion (D), and glycerol levels (E) of siC and siZ adipocytes. Glycerol was measured in conditioned media following a 3-hour incubation under basal or stimulated conditions using either isoprenaline or ANP. (F) Overview of the ANP and isoprenaline signaling pathways. NPR, natriuretic peptide receptor; βAR, beta-adrenergic receptor; Gαs, Gs alpha subunit, AC = adenylate cyclase, PKG/PKA, protein kinase G and A; DG, diglyceride; MG, monoglyceride. (G) Representative Western blots for HSL phosphorylated at serine-660 (activating phospho-site; pHSLSer660), total HSL (HSL), and GAPDH from basal, isoprenaline- and ANP-treated siC and siZ cells. (H) Principal components analysis of 307 lipid species measured by shotgun lipidomics of basal and ANP-stimulated siC and siZ adipocytes. Confidence ellipses display 95% confidence intervals. (I) Total triglycerides for the samples in (H) presented as fold change versus same siRNA basal companion. (J and K) Individual triglyceride species comparing siC versus siZ adipocytes. Volcano plots for ANP responsiveness of all triglycerides are shown in (J), and lipid abundance and ANP responsiveness are highlighted for the species with altered responsiveness following ZNF189 depletion in (K). In (J), adjusted P reflects FDR correction on multiple comparisons analyses performed using limma. Bar charts are presented as means ± SEM. In (C) to (E) and (I), replicates are highlighted by dots. For targeted analyses, data are based on at least three independent experiments. ***P < 0.001 for Welch’s t test [(C) and (I)] or Tukey’s multiple comparisons test (E).
Fig. 4.
Fig. 4.. ZNF189 is a sequence-specific transcriptional repressor.
(A) Volcano plot for transcriptomic analysis of ZNF189-depleted adipocytes (siZ) versus control cells (siC). Adj. P reflects FDR correction on multiple comparisons analyses performed by limma. (B) Overrepresentation analysis for results from (A). (C) Peak density plots of average peak values shown atop heatmaps of all ZNF189 peaks in immunoglobulin G (IgG) (left) and ZNF189 (right) chromatin immunoprecipitation followed by sequencing (ChIPseq). Scores are peak signal relative to IgG. (D) Top five enriched known motifs by homer analysis of ChIPseq peaks identified in (C). ***P < 0.001. (E) Binding distribution of ChIPseq peaks from (C). Enrichment per genomic region was assessed with hypergeometric testing and regions enriched with P < 0.05 are shown in green. (F) Activating or repressing function prediction by BETA. P value reflects gene activation (up-regulated) or repression (down-regulated) prediction for ZNF189 by a Kolmogorov-Smirnov test. (G) Direct gene target prediction by BETA. Values are −log(rank product), which reflect a P value for the combined score for binding potential. (H) ChIP signal at the top three BETA-predicted target genes. TTS, transcription termination site; 3′UTR, 3′ untranslated region; ncRNA, noncoding RNA; GPCR, G protein–coupled receptor.
Fig. 5.
Fig. 5.. ZNF189 contains a KRAB domain and interacts with TRIM28.
(A) Left: Phylogenetic tree showing gain of ZNF189 gene in placentals (eutheria). Right: ZNF189 protein conservation (Valdar scores from 10 homologs) aligned with ZNF189 protein domains (Uniprot O75820). (B) Schematic overview of the KRAB-TRIM28 protein complex showing ZNF189 interacting with DNA and the TRIM28 complex. TRIM28 is depicted maintaining closed chromatin via a protein complex. (C) Normalized protein intensities from MS on ZNF189 immunoprecipitation (IP) samples (n = 4). (D) Peak density plots and heatmaps for increased and decreased ATACseq peaks in control (siC) and siZNF189 (siZ) cells (n = 2). (E) Fold change [log2(FC)] from the microarray and ATACseq for genes with significant regulation by both assays. RNA data reflects fold changes versus siC and ATACseq data reflects fold changes versus the mean of the comparison condition. (F) Peak coverage plots for regulated H3K9me3 and H3K27ac peaks by CUT&Tag (n = 3). (G) Average peak signal for chromatin profiling at the PDE1B locus, which contains two promoters encoding PDE1B1 and PDE1B2.
Fig. 6.
Fig. 6.. The ZNF189-PDE1B2 axis regulates adipocyte lipolysis.
(A) Left: ZNF189 ChIP signal shown above tissue-wide cap analysis of gene expression signals [expressed as relative log expression (RLE)] at the two PDE1B promoters (encoding PDE1B1 and PDE1B2). Right: Gene expression of PDE1B1 and PDE1B2 across tissue/cell samples from the FANTOM5 database. Adipose samples are highlighted in green. (B and C) PDE1B mRNA (B) and protein (C) levels for siZNF189 (siZ) versus control cells (siC). (D) Sequence alignments for PDE1B1 and PDE1B2 shown above protein domains from InterPro. Purple characters represent deviations from the canonical protein isoform. Conserved protein domains are indicated with colored boxes. (E to H) PDE1B mRNA (E) and protein (F) as well as cGMP (G) and glycerol (H) in cells engineered to overexpress PDE1B2 under a doxycycline (doxy)-inducible promoter. In (G) and (H), cells were incubated with ANP. (I and J) Effects of the PDE1 inhibitor ITI214 on ANP-stimulated cGMP levels in untransfected (I) or siC versus siZ adipocytes (J). Bar charts are expressed relative to the indicated controls and are presented as means ± SEM. In these panels, replicates are highlighted by dots and are based on at least three independent experiments. Statistical analyses were performed using Welch’s two-tailed t test. **P < 0.01 and ***P < 0.001.

References

    1. Schweiger M., Schreiber R., Haemmerle G., Lass A., Fledelius C., Jacobsen P., Tornqvist H., Zechner R., Zimmermann R., Adipose triglyceride lipase and hormone-sensitive lipase are the major enzymes in adipose tissue triacylglycerol catabolism. J. Biol. Chem. 281, 40236–40241 (2006). - PubMed
    1. Grabner G. F., Xie H., Schweiger M., Zechner R., Lipolysis: Cellular mechanisms for lipid mobilization from fat stores. Nat. Metab. 3, 1445–1465 (2021). - PubMed
    1. Reilly S. M., Saltiel A. R., Adapting to obesity with adipose tissue inflammation. Nat. Rev. Endocrinol. 13, 633–643 (2017). - PubMed
    1. Markussen L. K., Rondini E. A., Johansen O. S., Madsen J. G. S., Sustarsic E. G., Marcher A.-B., Hansen J. B., Gerhart-Hines Z., Granneman J. G., Mandrup S., Lipolysis regulates major transcriptional programs in brown adipocytes. Nat. Commun. 13, 3956 (2022). - PMC - PubMed
    1. Rydén M., Jocken J., van Harmelen V., Dicker A., Hoffstedt J., Wirén M., Blomqvist L., Mairal A., Langin D., Blaak E., Arner P., Comparative studies of the role of hormone-sensitive lipase and adipose triglyceride lipase in human fat cell lipolysis. Am. J. Physiol. Endocrinol. Metab. 292, 1847–1855 (2007). - PubMed

Publication types