. 2024 Jan 3;16(728):eade2774.
doi: 10.1126/scitranslmed.ade2774. Epub 2024 Jan 3.

Splicing modulators impair DNA damage response and induce killing of cohesin-mutant MDS and AML

Affiliations

Splicing modulators impair DNA damage response and induce killing of cohesin-mutant MDS and AML

Emily C Wheeler et al. Sci Transl Med. .

Abstract

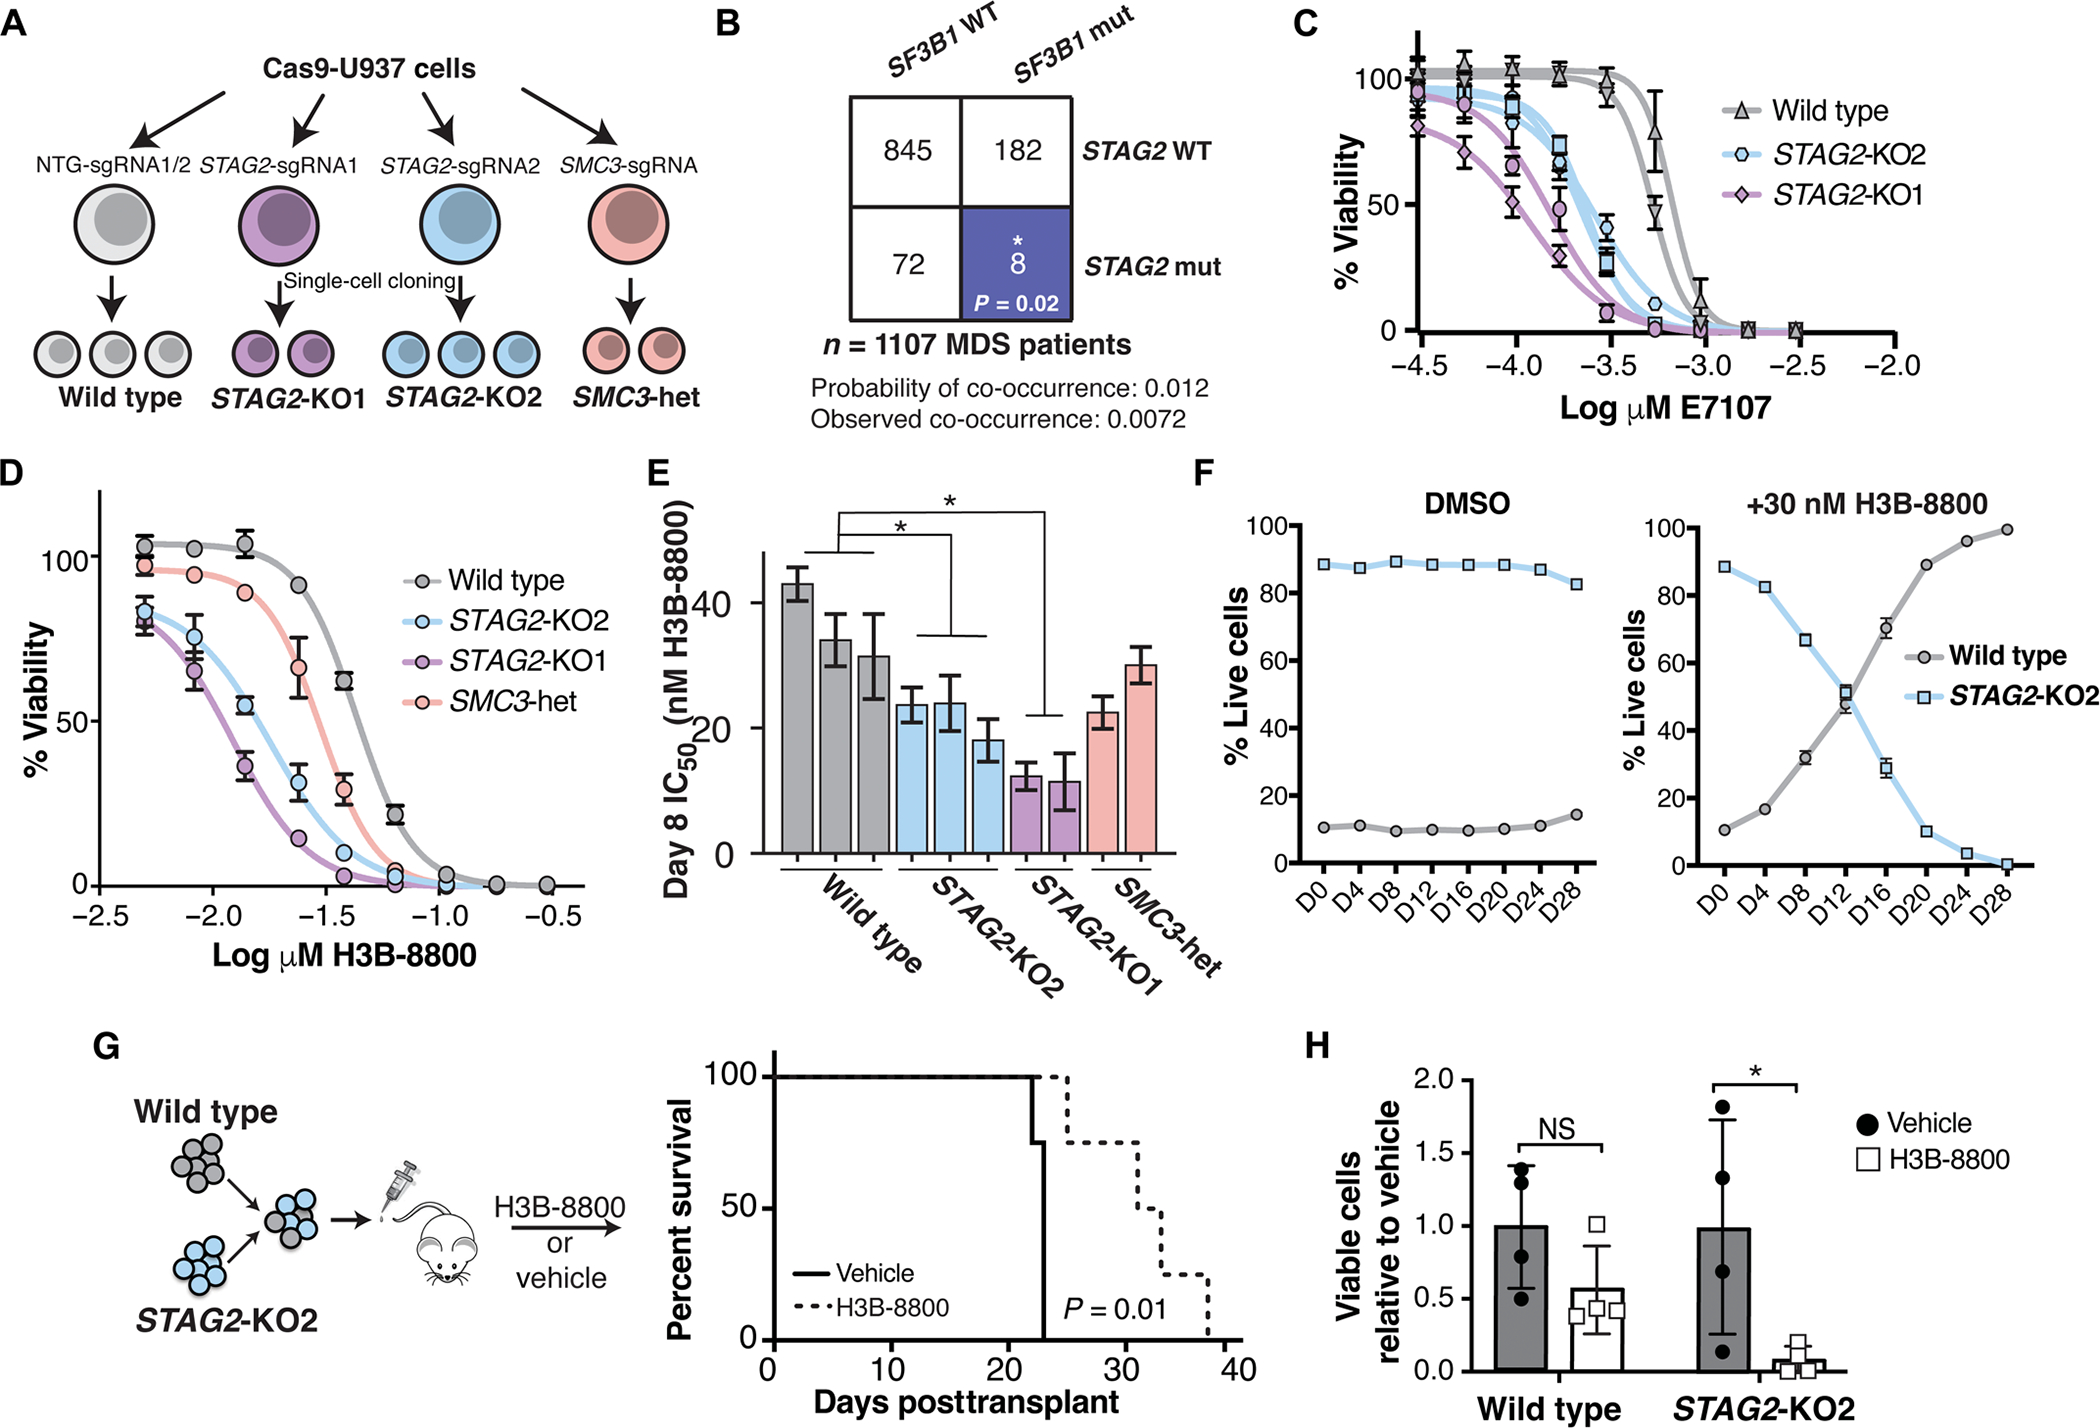
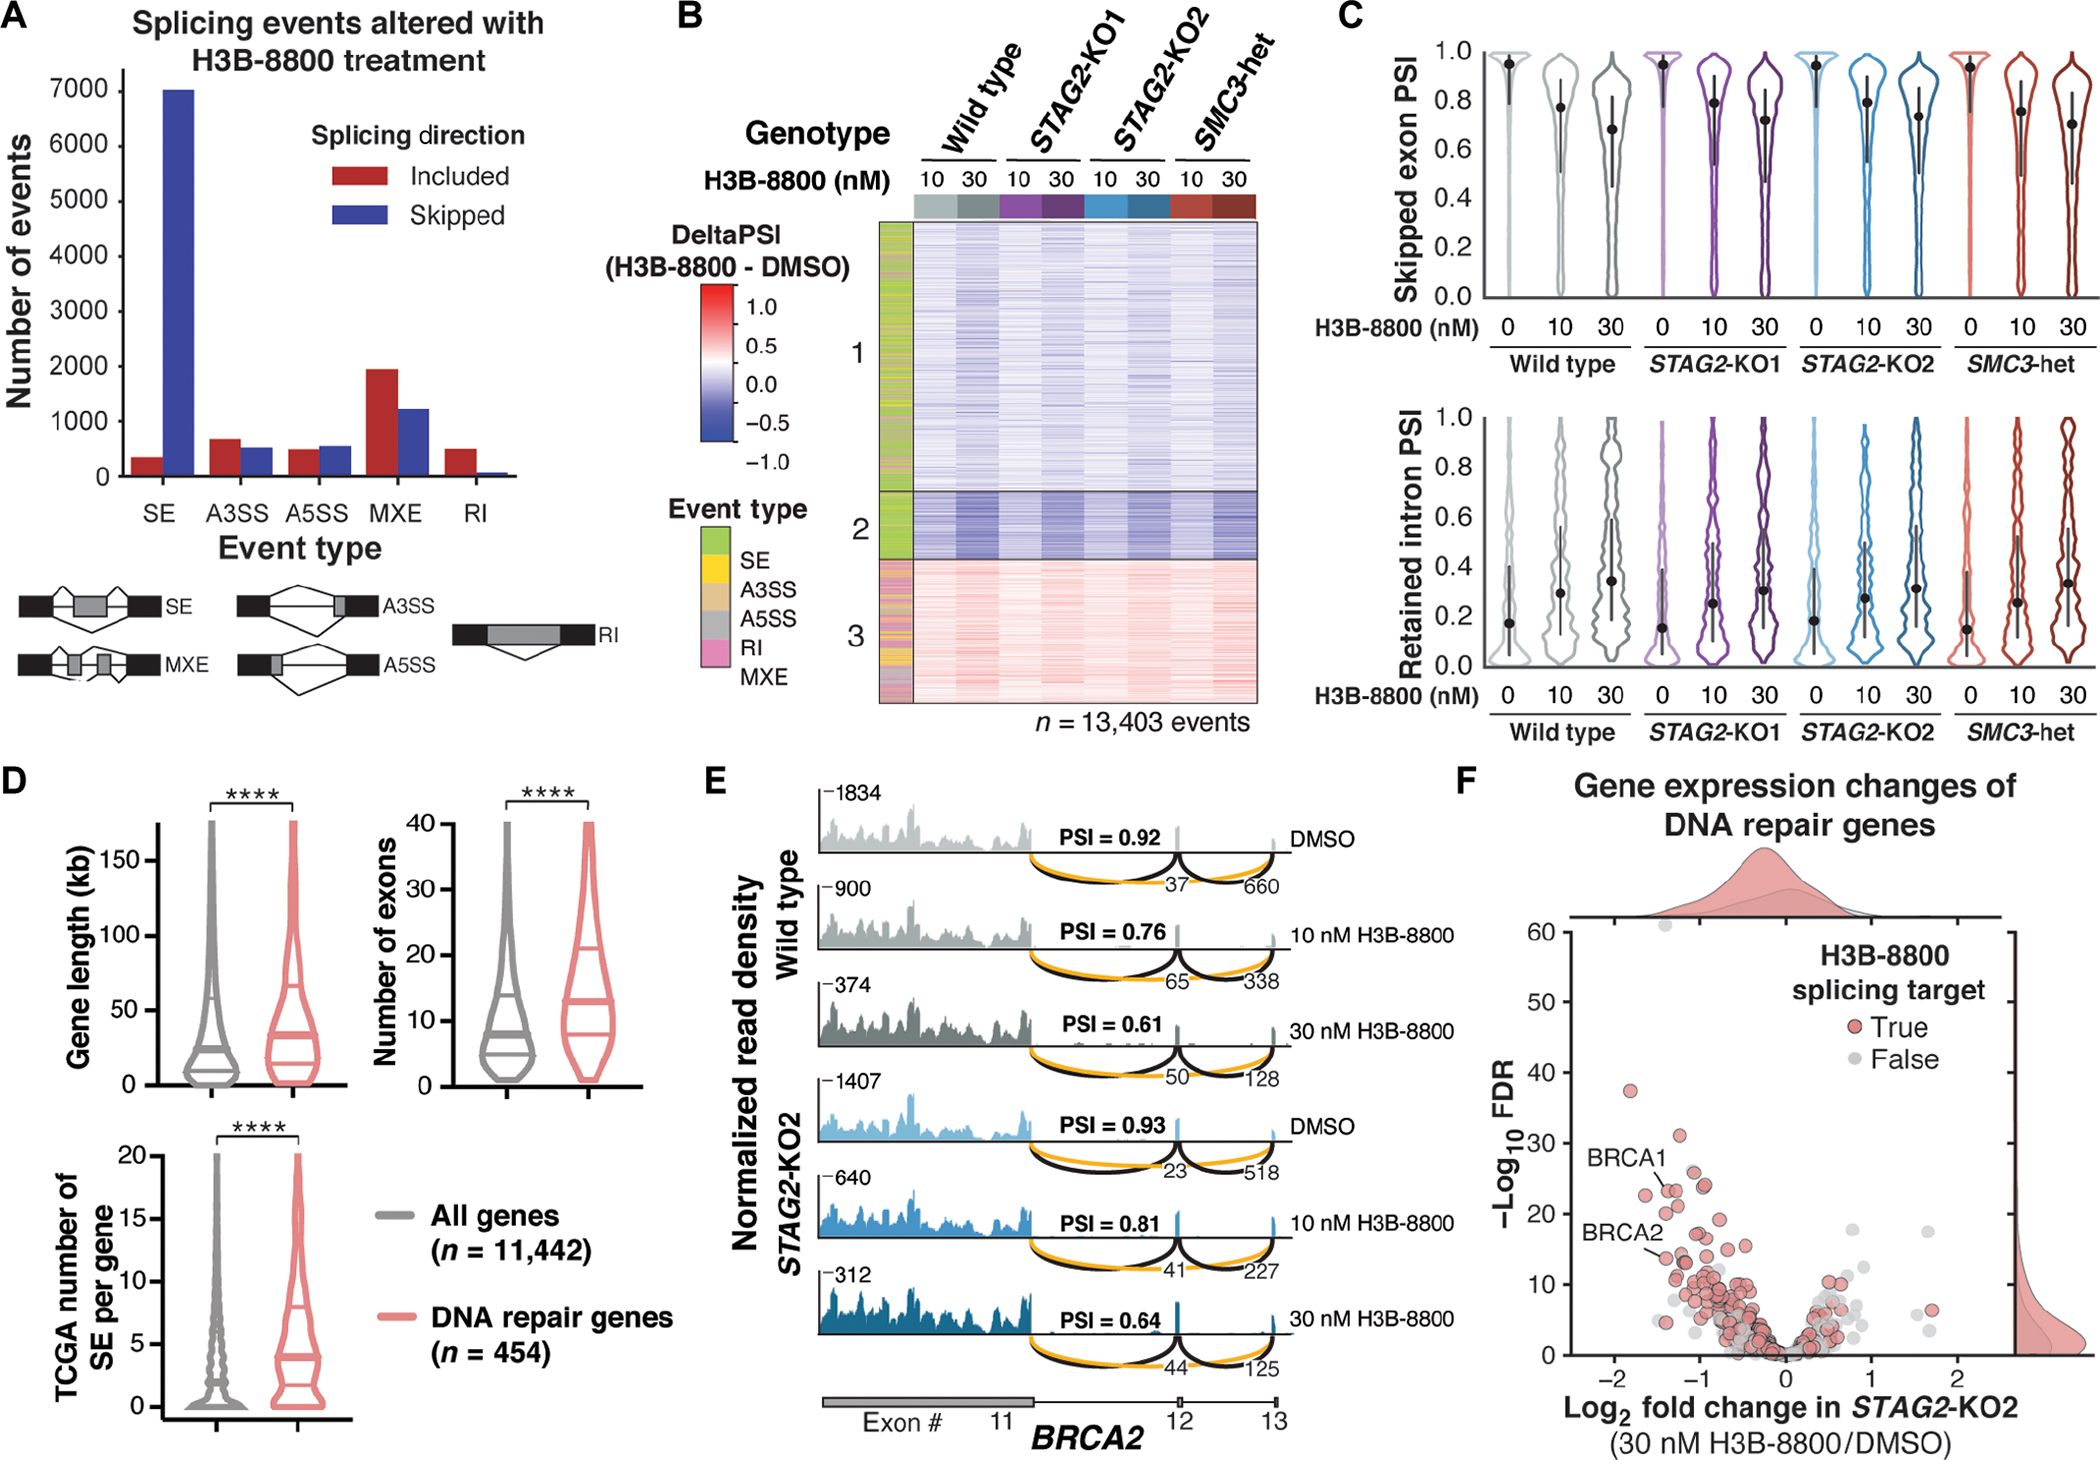
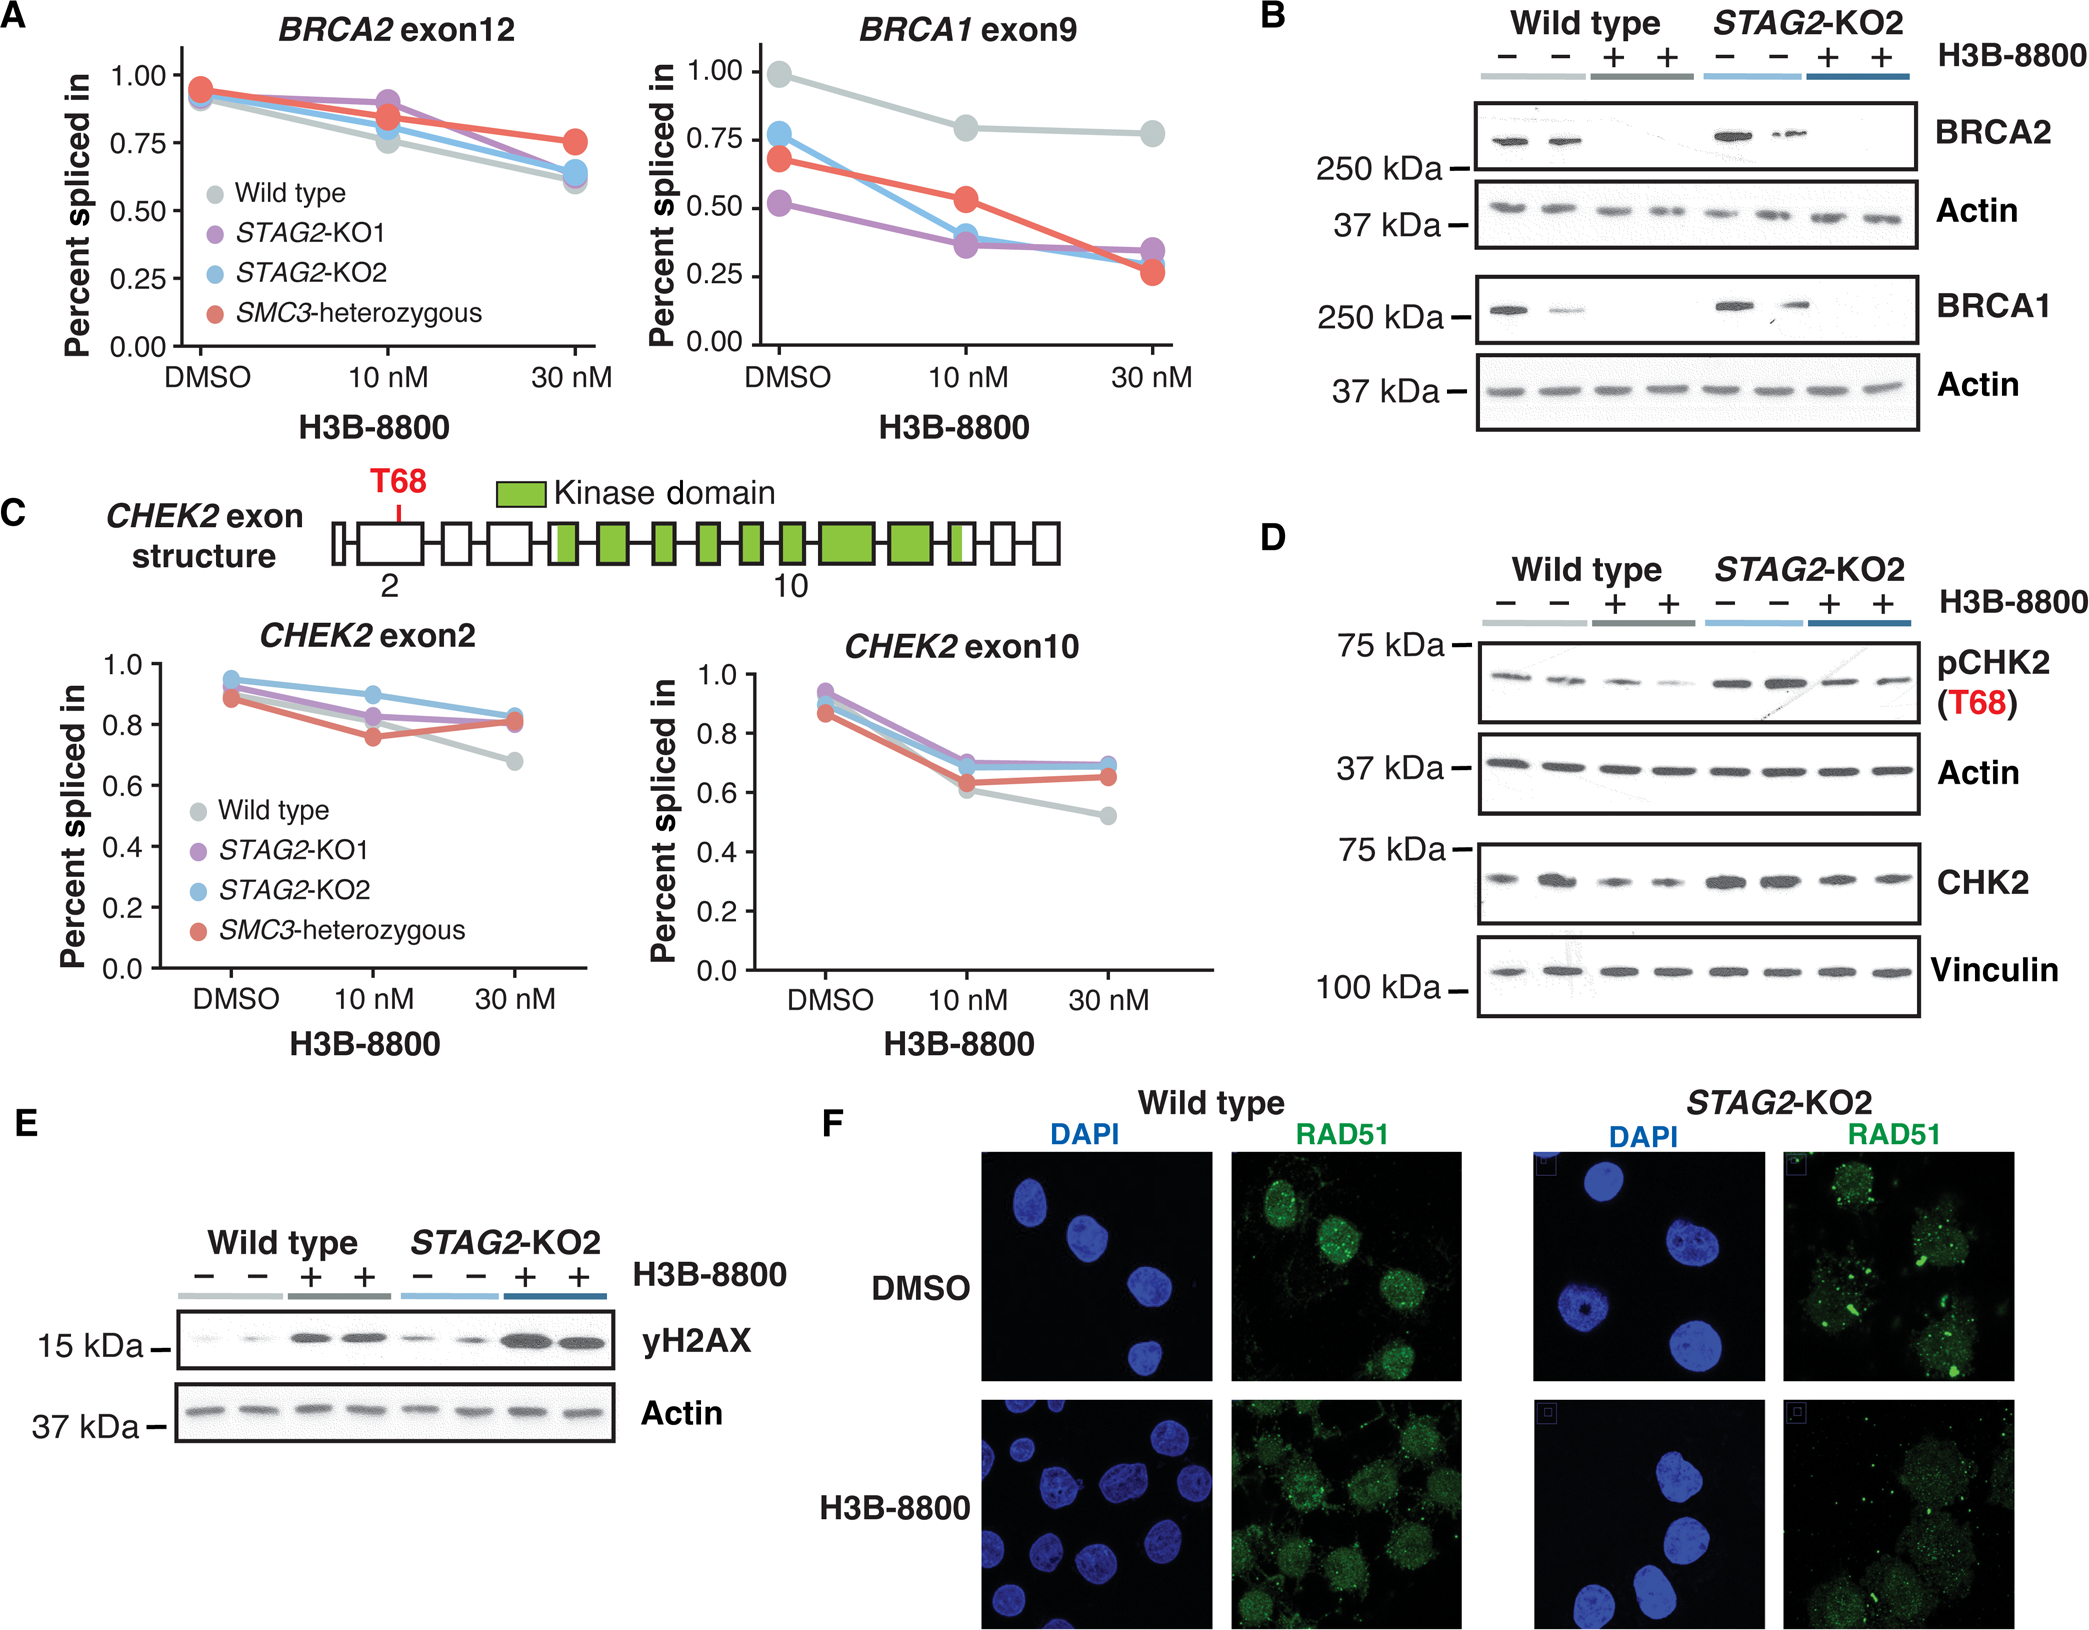
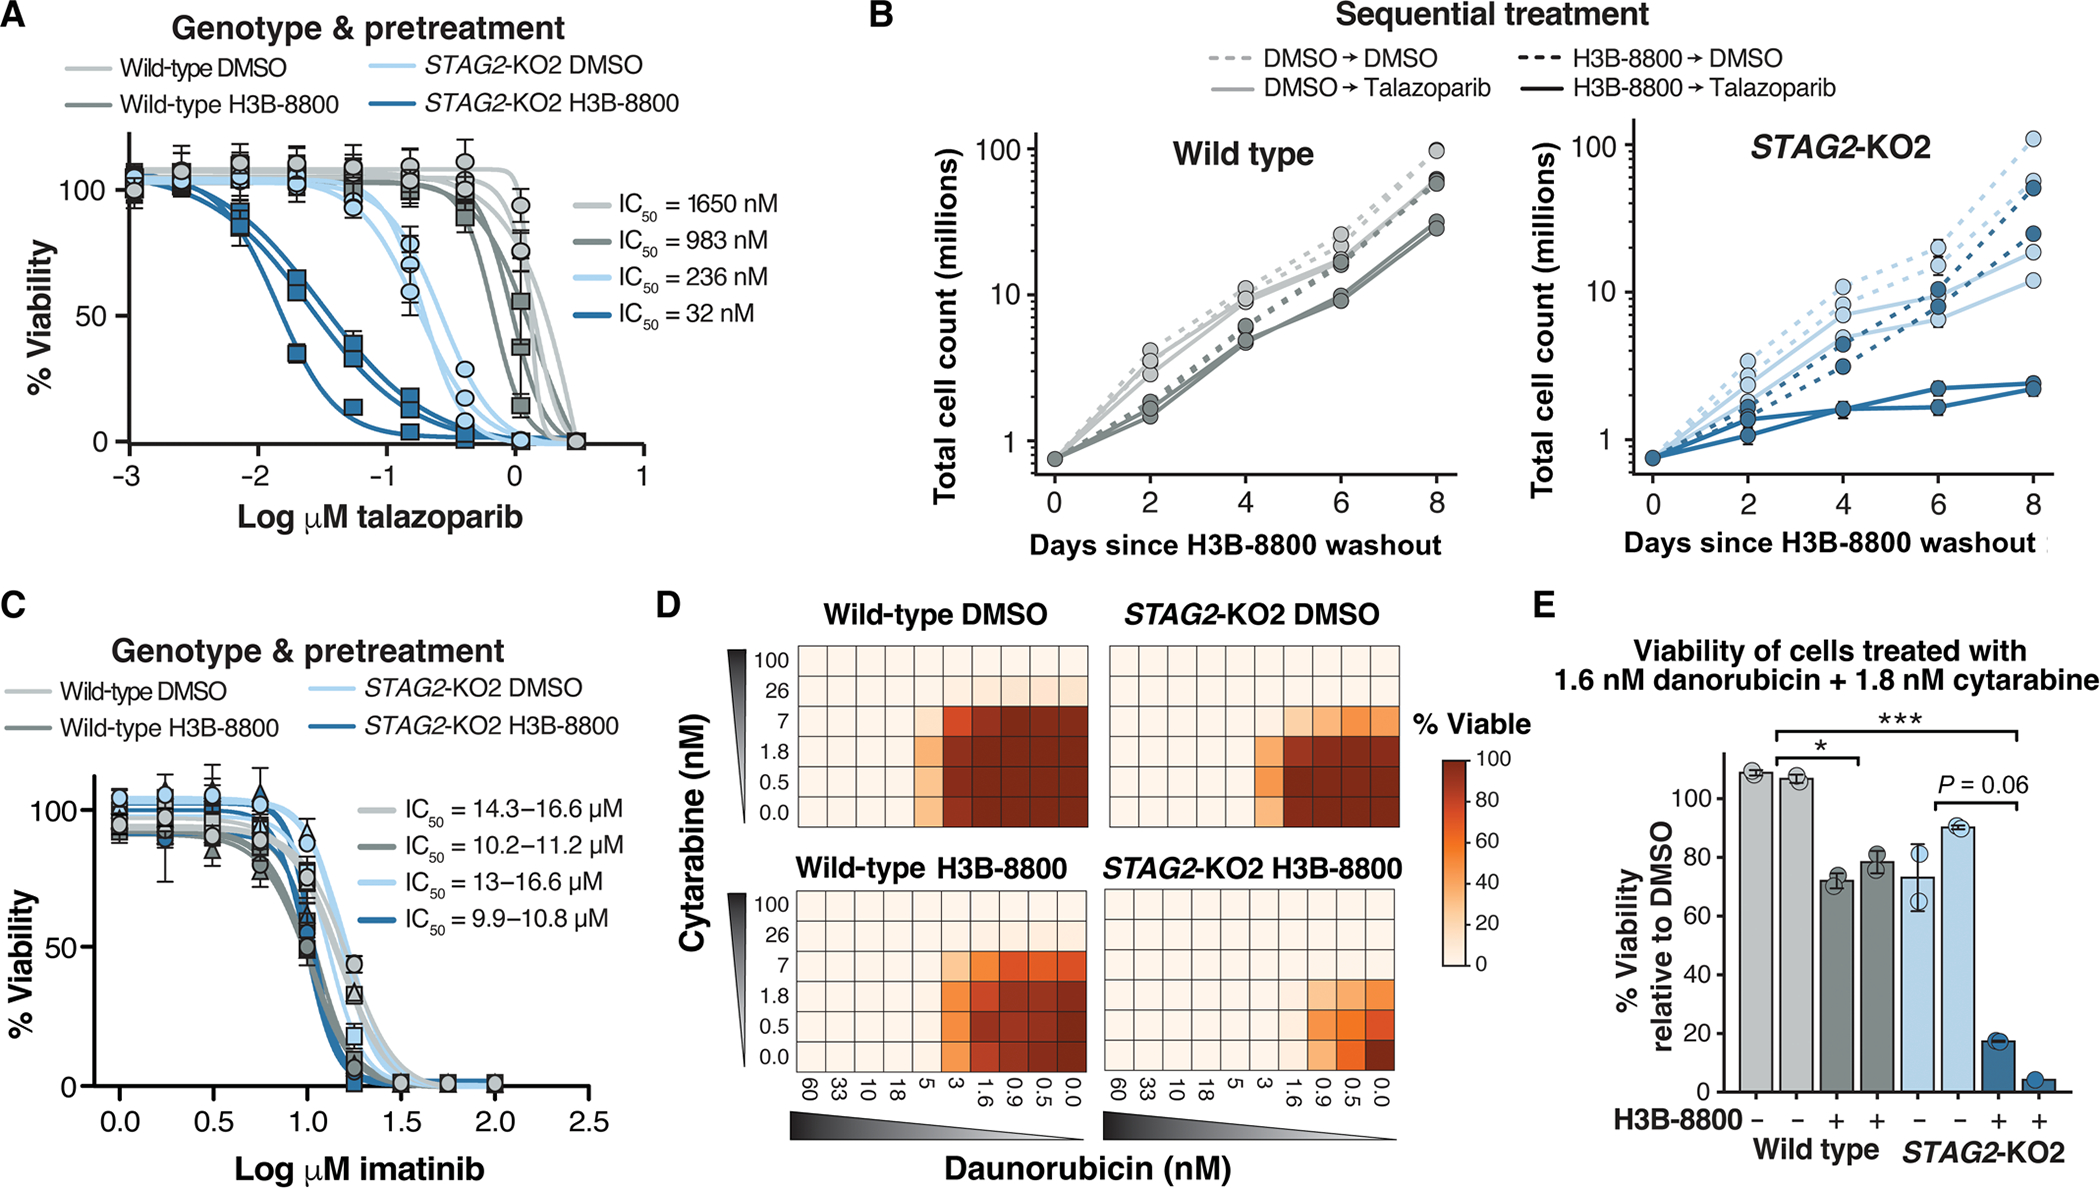
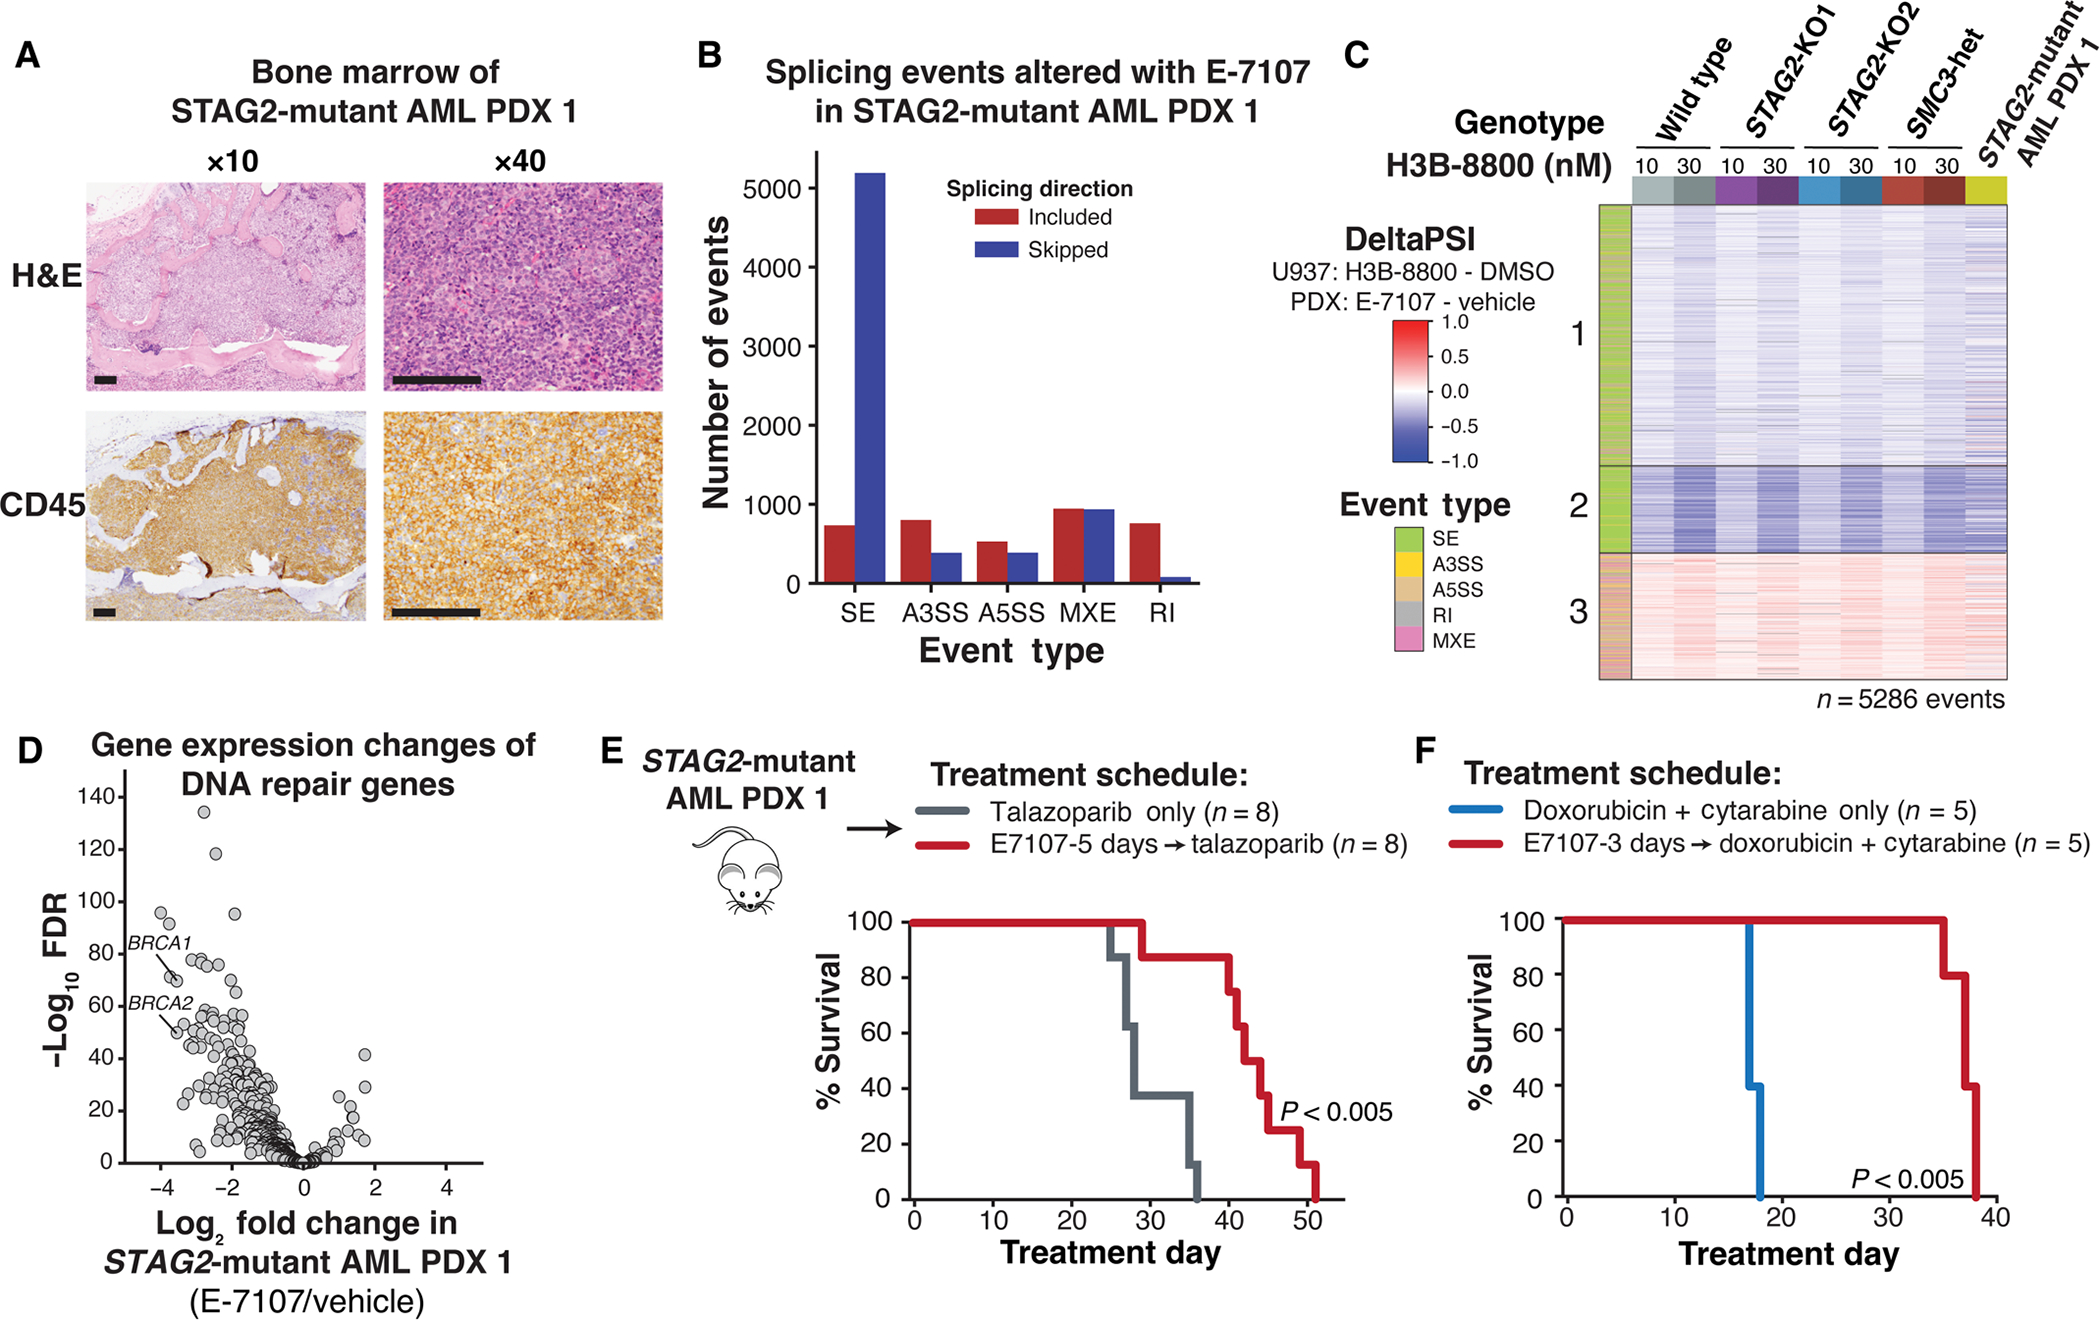
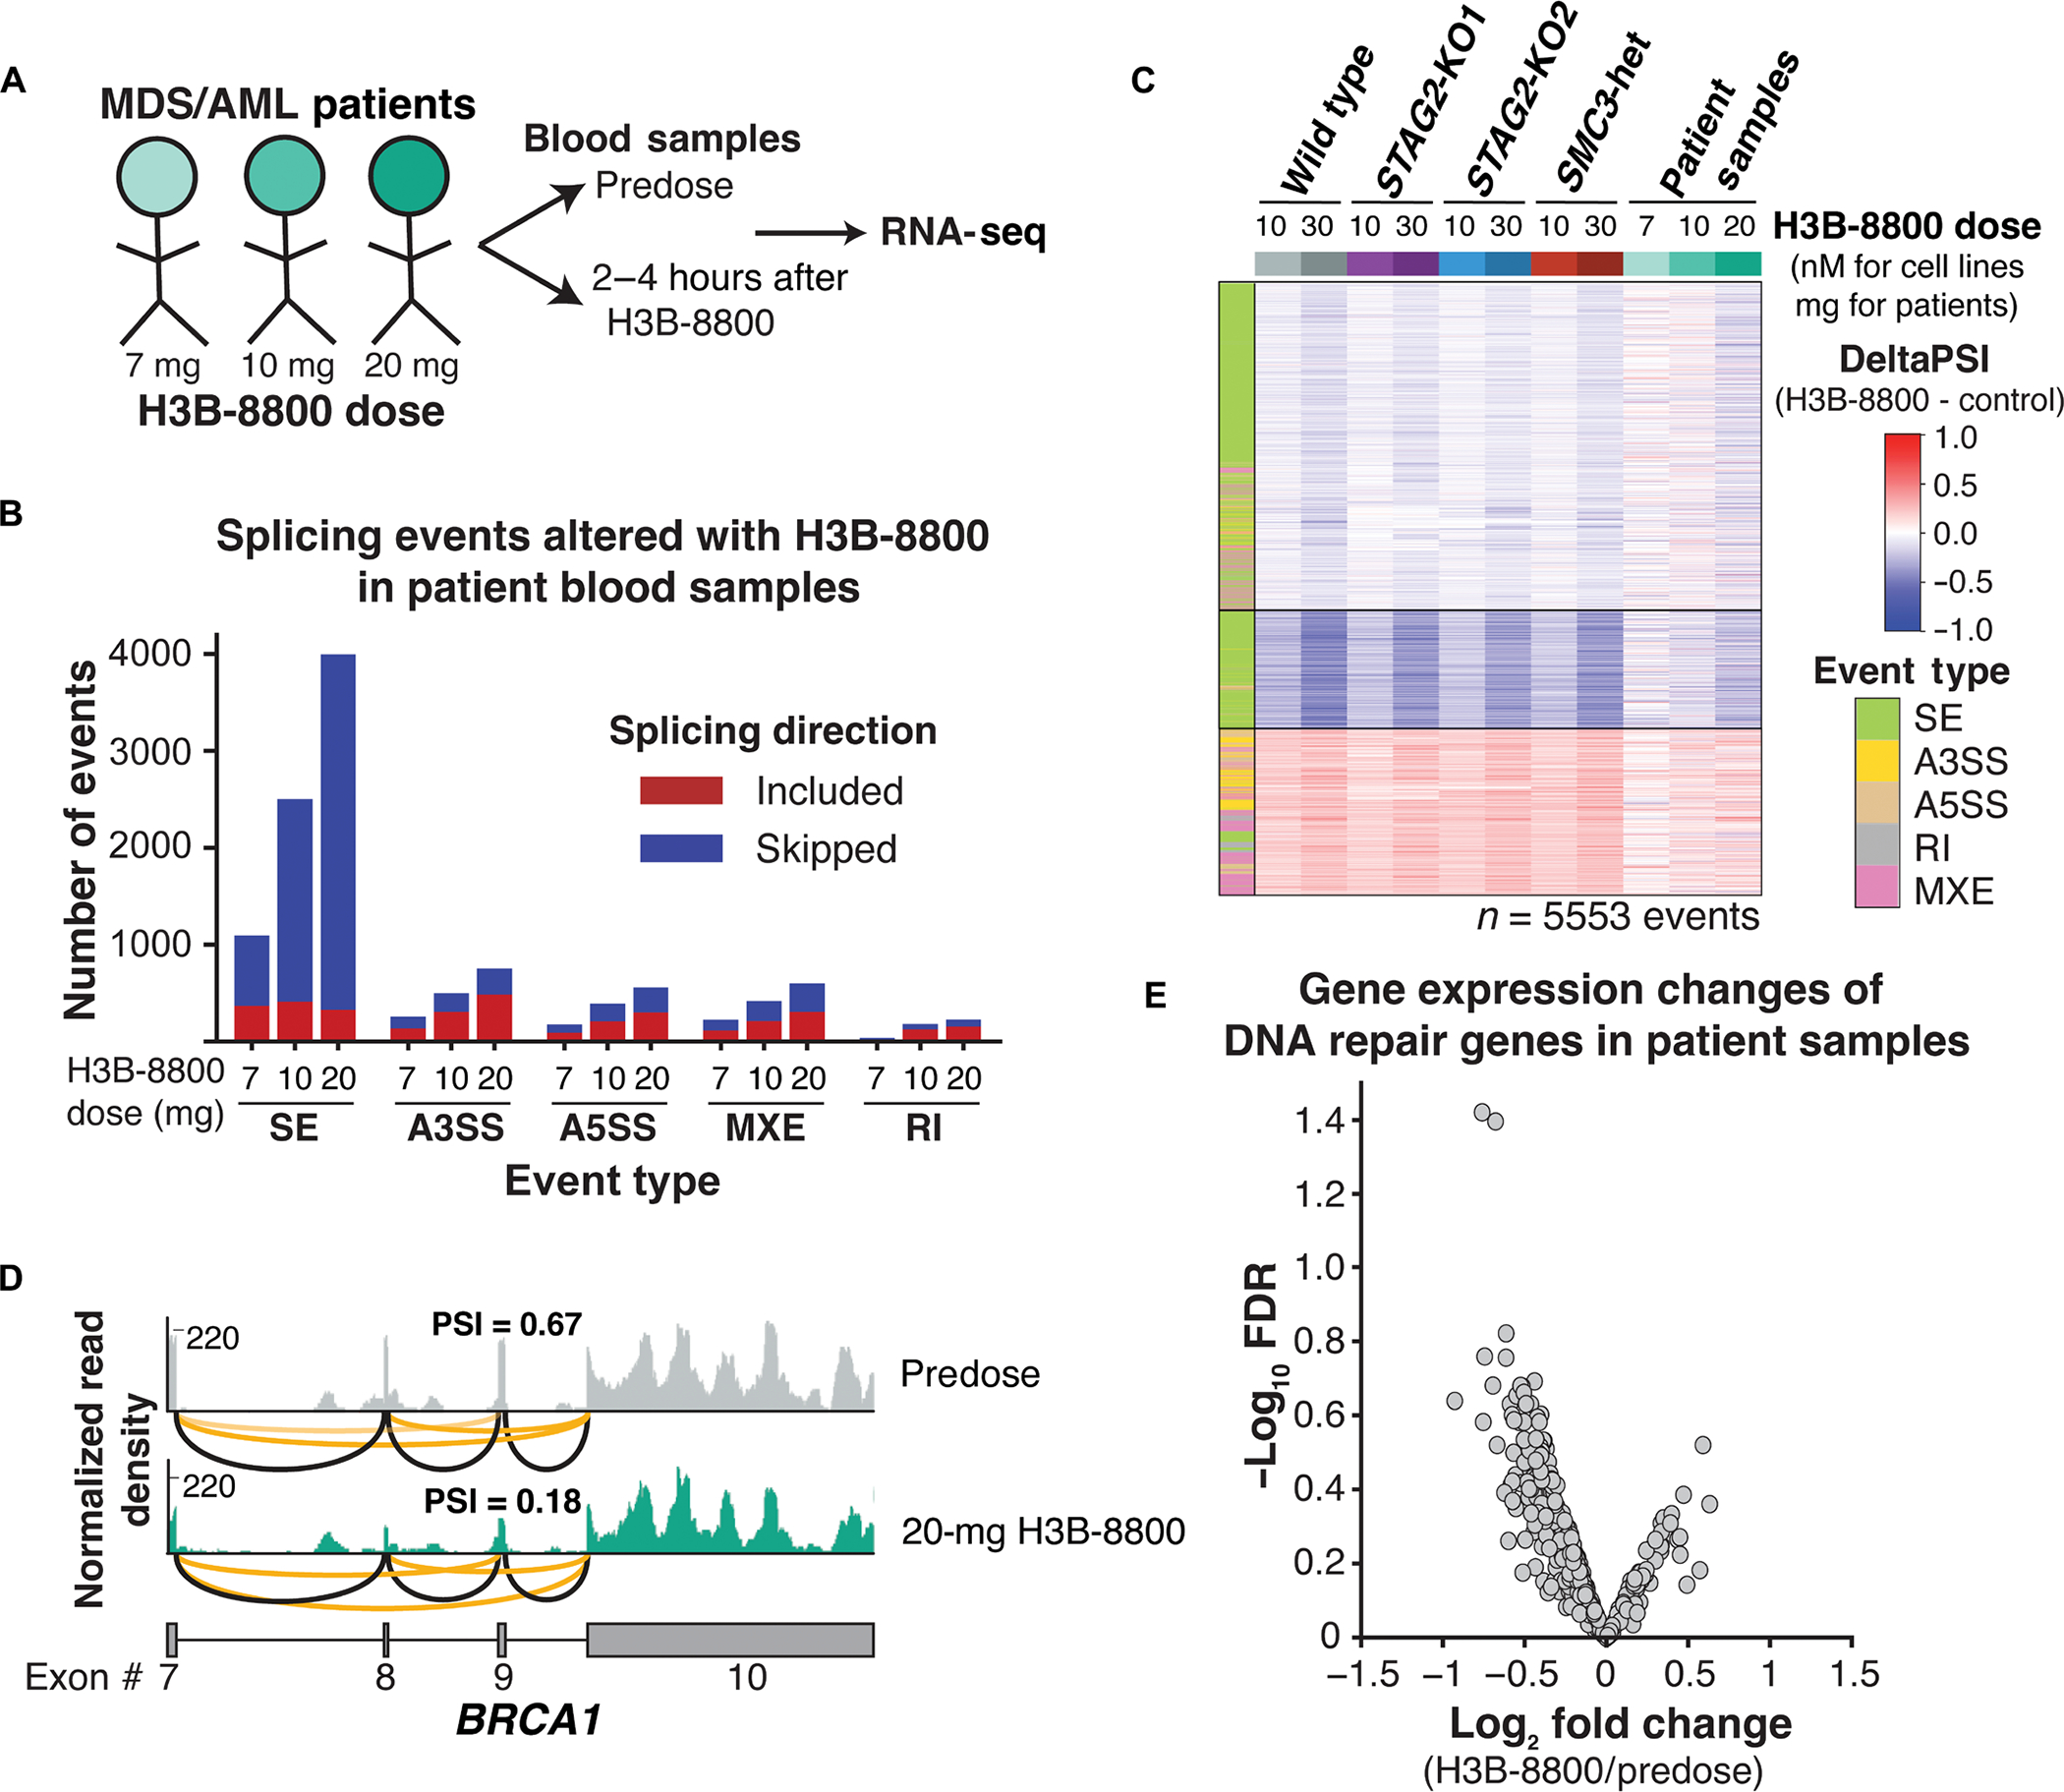
Splicing modulation is a promising treatment strategy pursued to date only in splicing factor-mutant cancers; however, its therapeutic potential is poorly understood outside of this context. Like splicing factors, genes encoding components of the cohesin complex are frequently mutated in cancer, including myelodysplastic syndromes (MDS) and secondary acute myeloid leukemia (AML), where they are associated with poor outcomes. Here, we showed that cohesin mutations are biomarkers of sensitivity to drugs targeting the splicing factor 3B subunit 1 (SF3B1) H3B-8800 and E-7107. We identified drug-induced alterations in splicing, and corresponding reduced gene expression, of a number of DNA repair genes, including BRCA1 and BRCA2, as the mechanism underlying this sensitivity in cell line models, primary patient samples and patient-derived xenograft (PDX) models of AML. We found that DNA damage repair genes are particularly sensitive to exon skipping induced by SF3B1 modulators due to their long length and large number of exons per transcript. Furthermore, we demonstrated that treatment of cohesin-mutant cells with SF3B1 modulators not only resulted in impaired DNA damage response and accumulation of DNA damage, but it sensitized cells to subsequent killing by poly(ADP-ribose) polymerase (PARP) inhibitors and chemotherapy and led to improved overall survival of PDX models of cohesin-mutant AML in vivo. Our findings expand the potential therapeutic benefits of SF3B1 splicing modulators to include cohesin-mutant MDS and AML.


Figures

Fig. 1.
Fig. 1.. Cohesin-mutant cells are sensitive to SF3B1-targeting compounds.
(A) Schematic of isogenic AML cell lines used in this study. U937 cells expressing Cas9 were nucleofected with single-guide RNAs (sgRNAs) targeting STAG2, SMC3, or nontargeting (NTG) sgRNAs. Two independent sgRNAs were used for STAG2 (KO1 and KO2) and NTG, and a single sgRNA was used to target SMC3. Independent single-cell–derived clones were used as biological replicates in this study. (B) Co-occurrence of SF3B1 and STAG2 mutations in a cohort of patients with MDS from the Dana-Farber Cancer Institute. Expected and observed probability of co-occurrence is listed. Blue color indicates a significant mutually exclusive relationship between SF3B1 and STAG2 mutations. *P < 0.05 (Z test). WT, wild type; mut, mutant. (C) Drug dose-response curves of E-7107–treated WT and STAG2-KO U937 clones on day 12 of treatment. Error bars represent SD of measurements of three technical replicates. (D) Drug dose-response curves of a representative set of wild-type and cohesin-mutant U937 cells treated with H3B-8800 for 8 days. Error bars represent SD of measurements in technical triplicates. (E) Quantification of IC50 among biological replicates (n = 2 or 3) of wild-type and cohesin-mutant U937 cells on day 8 of treatment with H3B-8800 tested in technical triplicates. STAG2-KO1 and STAG2-KO2 clones have a significantly lower IC50 than wild-type cells with H3B-8800 treatment (Kruskal-Wallis with post hoc test, P = 0.05). Error bars represent the 95% confidence interval of the IC50 calculated from technical triplicates of each cell line. (F) Competition assay with wild-type (mCherry) and STAG2-KO2 (GFP) U937 cells mixed in a 1:10 ratio in the presence of DMSO or H3B-8800 (30 nM) in vitro. % Live GFP+ or mcherry+ cells were determined using flow cytometry. error bars represent Sd of measurements of technical triplicates. (G) Schematic of the in vivo drug treatment of NSGS mice injected with wild-type (mcherry) and STAG2-Ko2 (GFP+) U937 cells mixed in a 1:1 ratio. Treatment with h3B-8800 or vehicle control was started 7 days posttransplant. Kaplan-Meier survival analysis was performed; P = 0.01. n = 4 mice per group. (H) leukemia burden in mice treated with h3B-8800 or vehicle was assessed in the spleens of animals at the time of sacrifice. % Live GFP+ or mcherry+ cells were determined using flow cytometry. Mean ± Sd is shown. P < 0.05 (Student’s t test). n = 4 mice per group.
Fig. 2.
Fig. 2.. H3B-8800 treatment induces mis-splicing and down-regulation of DNA damage repair genes.
(A) Total number and directionality of splicing alterations induced by 6-hour H3B-8800 treatment in all U937 cell lines. Events are categorized by event type and direction of regulation in H3B-8800–treated relative to DMSO-treated cells. SE, skipped exon; A3SS, alternative 3′ splice site; A5SS, alternative 5′ splice site; MXE, mutually exclusive exon; RI, retained intron. (B) Heatmap of ΔPSI scores for H3B-8800–regulated exons [from (A)] across all conditions separated into three k-means clusters. Each comparison consists of two (STAG2-KO1 and SMC3-heterozygous) or three (STAG2-KO2 and wild type) independent single-cell clones for each concentration of drug compared with DMSO controls within the same genotype. Columns are organized by genotype and concentration of H3B-8800. Color bar on the left indicates the type of splicing event that was called. PSI, percent spliced in. (C) Violin plots showing the distribution of PSI scores for H3B-8800–regulated skipped exons (top) and retained introns (bottom) under each treatment condition tested. Dot represents the median, and bars extend from the first to third quartile range. (D) Violin plots depicting the gene length, number of exons, and number of skipped exons in TCGA comparing DNA repair genes (n = 454) with all expressed protein-coding genes (n = 11,442). Pan-cancer TCGA exon skipping events collated from ExonSkipDB (29). Horizontal lines in violin plots depict the median and first and third quartiles. ****P < 0.0001, Mann-Whitney test. (E) RNA-seq–normalized read density and splice junction track of exon skipping in BRCA2 exon12 from one representative replicate of wild-type and STAG2-KO2 cells treated with DMSO and 10 or 30 nM H3B-8800 for 6 hours. Average PSI scores from three biological replicate samples of exon12 are shown. Average number of reads supporting exon skipping (orange line) and exon inclusion (black line) are reported. (F) Volcano plot of gene expression changes in DNA repair genes in STAG2-KO2 cells treated with 30 nM H3B-8800 relative to DMSO-treated controls. Average log2 fold change of three biological replicates of STAG2-KO2 versus wild-type U937 cells is shown. DNA repair genes that contain H3B-8800–regulated splicing changes are highlighted in red.
Fig. 3.
Fig. 3.. Mis-splicing of DNA repair genes alters protein function and results in accumulation of DNA damage.
(A) average PSI scores of BRCA2 exon12 and BRCA1 exon9 are plotted for each genotype and drug condition. data points represent the mean of biological triplicates (wild type and STAG2-KO2) or duplicates (STAG2-KO1 and SMC3-heterozygous) for each treatment condition. (B) Western blot analysis of BCRA1 and BRCA2 protein expression in wild-type and STAG2-KO2 cells treated with 50 nM H3B-8800 or DMSO for 3 days. each lane represents an independent single-cell clone of U937 cells transduced with a nontargeting sgRNA (wild type) or sgRNA targeting STAG2. actin was used as a loading control. (C) Schematic of CHEK2 exon structure (top) with the Thr68 phosphorylation residue highlighted in red and the annotated kinase domain shown in green. Percent spliced in scores of exon2 and exon10 are shown for each treatment condition. data points represent the mean of biological triplicates (wild type and STAG2-KO2) or duplicates (STAG2-KO1 and SMC3-heterozygous) for each treatment condition. (D) Western blot analysis of pCHK2 and total CHK2 protein in wild-type and STAG2-KO2 cells treated for 3 days with 50 nM H3B-8800 or DMSO. each lane represents an independent single-cell clone of U937 cells transduced with a nontargeting sgRNA (wild type) or sgRNA targeting STAG2. Vinculin and actin were used as loading controls. (E) Western blot analysis of γh2aX protein in wild-type and STAG2-KO2 cells treated for 3 days with 50 nM H3B-8800 or DMSO. each lane represents an independent single-cell clone of U937 cells transduced with a nontargeting sgRNA (wild type) or sgRNA targeting STAG2. actin was used as a loading control. (F) representative images of cells treated with 50 nM H3B-8800 or DMSO control for 24 hours and stained for DNA/nuclei (DAPI, blue) and RAD51 (green).
Fig. 4.
Fig. 4.. Splicing modulation sensitizes cohesin-mutant AML cell lines to killing by talazoparib and chemotherapy.
(A) drug dose-response curves of wild-type and STAG2-KO2 cells pretreated with 50 nM H3B-8800 or DMSO for 3 days, followed by drug washout and 8 days of treatment with talazoparib. error bars represent Sd of technical triplicate measurements for each biological triplicate sample (n = 3 per genotype and condition). (B) Growth curves depicting total number of wild type (left) or STAG2-KO2 cells (right) pretreated with DMSO or H3B-8800 (50 nM) for 3 days, followed by treatment with talazoparib (50 nM) or DMSO for 8 days. error bars represent Sd of technical duplicate measurements for each biological replicate sample (n = 2 per genotype and condition). (C) drug dose-response curves of wild-type and STAG2-KO2 cells pretreated with 50 nM H3B-8800 or DMSO for 3 days, followed by drug washout and 8 days of treatment with imatinib. error bars represent SD of technical triplicate measurements for each biological replicate sample (n = 2 per genotype and condition). (D) heatmap of cell viabilities for wild-type and STAG2-KO2 cells pretreated with DMSO (top) or 50 nM H3B-8800 (bottom) for 3 days, followed by treatment with a combination of daunorubicin and cytarabine for 8 days. cell viabilities are normalized to DMSO-treated controls on each plate (0 nM cytarabine and 0 nM daunorubicin). Values shown are the average of two technical replicate samples for one representative biological replicate sample. (E) Bar plot of percent viable cells after combination treatment with 1.6 nM daunorubicin and 1.8 nM cytarabine relative to DMSO-treated controls. cells received either 3 days of 50 nM H3B-8800 (dark bars) or DMSO control (light bars) before chemotherapy. data points show technical replicates n = 2 per condition (except biological replicate 2 of H3B-8800 treated STAG2-KO2 cells n = 1). each bar represents an independent biological replicate sample. P = 0.008 (Kruskal-Wallis), *P < 0.05, ***P < 0.001 in post hoc analysis using the Dunn’s test.
Fig. 5.
Fig. 5.. Low-dose splicing modulation combined with talazoparib or chemotherapy targets PDX AML in vivo.
(A) Morphologic evaluation of bone marrow of STAG2-mutant AMl1 patient–derived xenograft shows infiltration with human leukemia blasts. images were stained using hematoxylin and eosin (H&E) (top) and hCD45-targeting antibody (bottom) and imaged at ×10 and ×40 (scale bars, 0.125 mm) original magnification. (B) Total number and directionality of significant (FDR < 0.05, ΔPSI >5%) splicing alterations differentially called in STAG2-mutant human AML1 PDX cells isolated from bone marrow of NSGS mice treated with E-7107 compared with vehicle for 5 days in vivo. Splicing events are categorized by event type and direction of regulation in E-7107 versus vehicle-treated mice. SE, skipped exon; A3SS, alternative 3′ splice site; A5SS, alternative 5′ splice site; MXE, mutually exclusive exon; RI, retained intron. N = 3 mice per condition. (C) heatmap of ΔPSI scores for H3B-8800–regulated exons called from U937 cells (Fig. 2B) that are expressed in STAG2-mutant AML PdX1 treated with E-7107 in vivo. each comparison consists of two (STAG2-KO1 and SMC3-heterozygous) or three (STAG2-KO2, wild type, and STAG2-mutant PDX) independent biological replicates compared with either DMSO or vehicle-treated controls. color bar on the left indicates the type of splicing event that was called, and column colors are labeled by genotype and drug treatment on the right. (D) Volcano plot depicting differential gene expression of DNA repair genes in STAG2-mutant human AML1 PDX cells isolated from the bone marrow of NSGS mice treated with E-7107 versus vehicle for 5 days in vivo. N = 3 mice per condition. (E) Schematic of in vivo E-7107 drug treatment and survival analysis of STAG2-mutant AML1 PDX model (other mutations include BCOR/RUNX1/U2AF1/DNMT3A). Treatment of mice assigned to two treatment arms was initiated 3 weeks after bone marrow transplantation: talazoparib only (n = 8) or E-7107 for 5 days followed by talazoparib (n = 8). Survival data were combined from two independent experiments. P < 0.005 (log-rank test). (F) Survival analysis of STAG2-mutant AML1 PDX mice treated with 3 days of E-7107 followed by combination chemotherapy (5 + 3 doxorubicin + cytarabine) or combination chemotherapy alone (n = 5 mice per arm). P < 0.005 (log-rank test).
Fig. 6.
Fig. 6.. Splicing changes and down-regulation of DNA repair genes are conserved in patients with MDS and AML.
(A) Schematic of samples collected from patients with MDS and AML treated with three different doses of H3B-8800 on clinical trial (clinicalTrials.gov identifier NCT02841540). (B) Total number and directionality of significant (FDR < 0.05, ΔPSI >5%) splicing alterations differentially called in each patient sample pre– and post–H3B-8800. Patients are sorted on the x axis according to increasing doses of H3B-8800. Splicing events are categorized by event type and direction of regulation in H3B-8800 versus pretreatment sample. SE, skipped exon; A3SS, alternative 3′ splice site; A5SS, alternative 5′ splice site; MXE, mutually exclusive exon; RI, retained intron. (C) heatmap of ΔPSI scores for H3B-8800–regulated splicing changes called from U937 cells (Fig. 3a) that are expressed in patient samples. Patient samples are sorted by increasing dose of H3B-8800 received. color bar on the left indicates the type of splicing event that was called, and column colors are labeled by genotype and drug treatment. (D) RNA-seq–normalized read density and splice junction track of exon skipping in BRCA1 exon9 from the pre- and posttreatment sample in the patient who received 20 mg of H3B-8800. Black lines indicate constitutive splicing junctions, and orange lines indicate splice junctions that contain exon skipping. (E) Volcano plot depicting differential gene expression of DNA repair genes from a paired analysis of all patients pre– and post–H3B-8800 treatment.

References

    1. Losada A, Cohesin in cancer: Chromosome segregation and beyond. Nat. Rev. Cancer 14, 389–393 (2014). - PubMed
    1. Jann JC, Tothova Z, Cohesin mutations in myeloid malignancies. Blood 138, 649–661 (2021). - PMC - PubMed
    1. Antony J, Chin CV, Horsfield JA, Cohesin mutations in cancer: Emerging therapeutic targets. Int. J. Mol. Sci. 22, (2021). - PMC - PubMed
    1. Heimbruch KE, Meyer AE, Agrawal P, Viny AD, Rao S, A cohesive look at leukemogenesis: The cohesin complex and other driving mutations in AML. Neoplasia 23, 337–347 (2021). - PMC - PubMed
    1. Kon A, Shih LY, Minamino M, Sanada M, Shiraishi Y, Nagata Y, Yoshida K, Okuno Y, Bando M, Nakato R, Ishikawa S, Sato-Otsubo A, Nagae G, Nishimoto A, Haferlach C, Nowak D, Sato Y, Alpermann T, Nagasaki M, Shimamura T, Tanaka H, Chiba K, Yamamoto R, Yamaguchi T, Otsu M, Obara N, Sakata-Yanagimoto M, Nakamaki T, Ishiyama K, Nolte F, Hofmann WK, Miyawaki S, Chiba S, Mori H, Nakauchi H, Koeffler HP, Aburatani H, Haferlach T, Shirahige K, Miyano S, Ogawa S, Recurrent mutations in multiple components of the cohesin complex in myeloid neoplasms. Nat. Genet. 45, 1232–1237 (2013). - PubMed

MeSH terms