. 2024 Jan 2;36(1):116-129.e7.
doi: 10.1016/j.cmet.2023.12.013.

Serine synthesis via reversed SHMT2 activity drives glycine depletion and acetaminophen hepatotoxicity in MASLD

Affiliations

Serine synthesis via reversed SHMT2 activity drives glycine depletion and acetaminophen hepatotoxicity in MASLD

Alia Ghrayeb et al. Cell Metab. .

Abstract

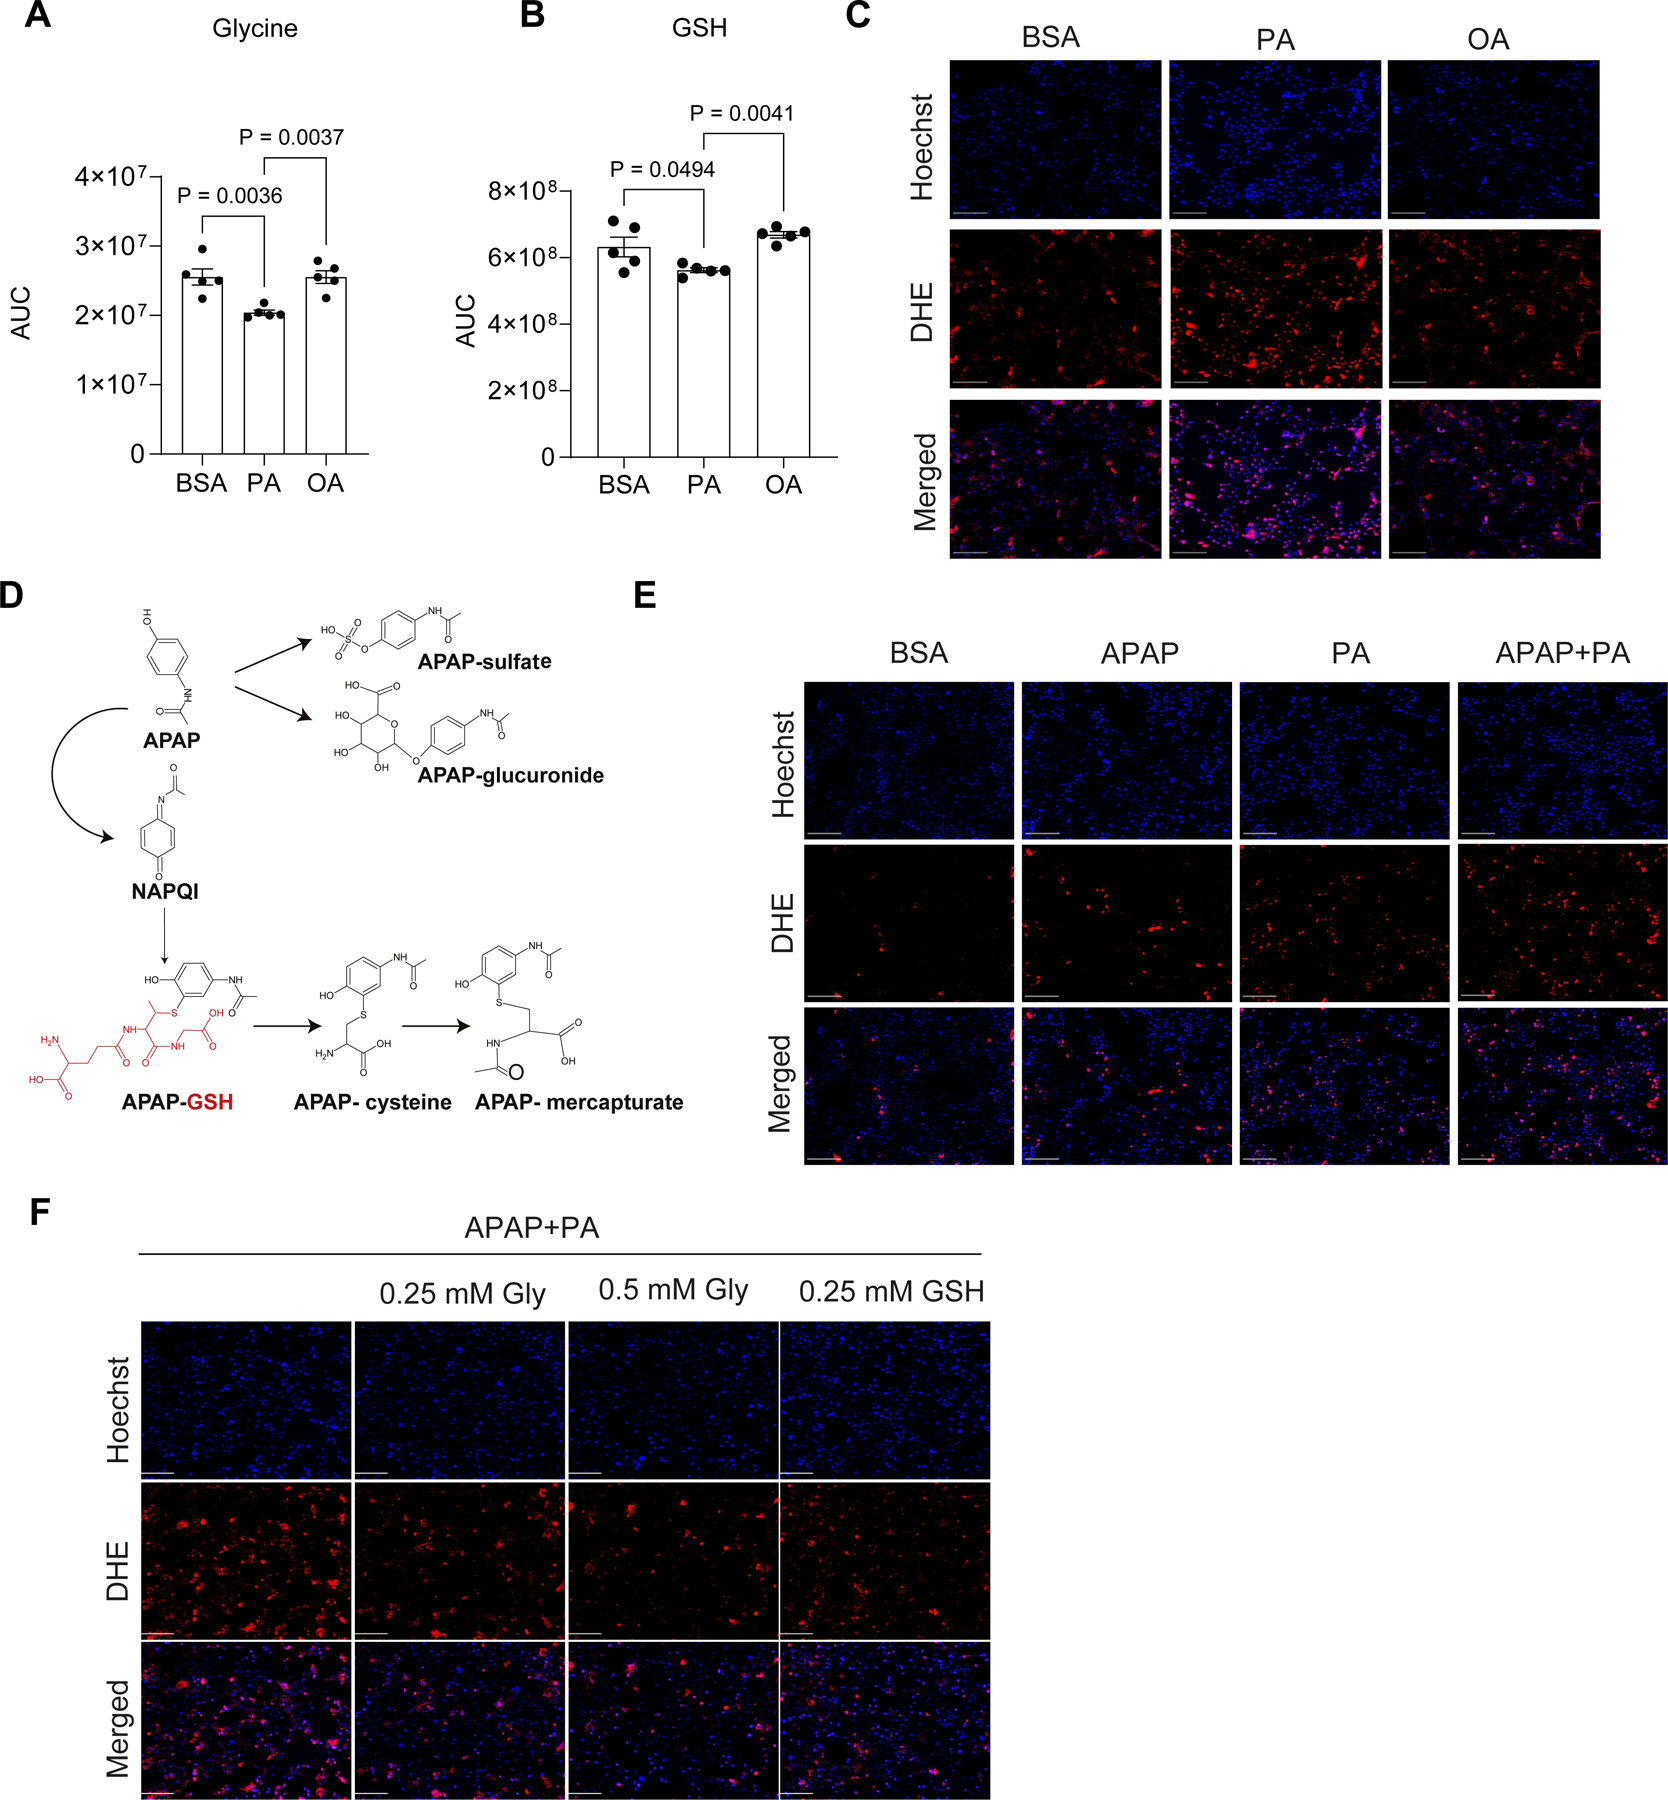
Metabolic dysfunction-associated steatotic liver disease (MASLD) affects one-third of the global population. Understanding the metabolic pathways involved can provide insights into disease progression and treatment. Untargeted metabolomics of livers from mice with early-stage steatosis uncovered decreased methylated metabolites, suggesting altered one-carbon metabolism. The levels of glycine, a central component of one-carbon metabolism, were lower in mice with hepatic steatosis, consistent with clinical evidence. Stable-isotope tracing demonstrated that increased serine synthesis from glycine via reverse serine hydroxymethyltransferase (SHMT) is the underlying cause for decreased glycine in steatotic livers. Consequently, limited glycine availability in steatotic livers impaired glutathione synthesis under acetaminophen-induced oxidative stress, enhancing acute hepatotoxicity. Glycine supplementation or hepatocyte-specific ablation of the mitochondrial SHMT2 isoform in mice with hepatic steatosis mitigated acetaminophen-induced hepatotoxicity by supporting de novo glutathione synthesis. Thus, early metabolic changes in MASLD that limit glycine availability sensitize mice to xenobiotics even at the reversible stage of this disease.

Keywords: MASLD; SHMT; acetaminophen hepatotoxicity; glutathione; glycine; one-carbon metabolism; xenobiotic.


Conflict of interest statement

Declaration of interests E.G. is a founder and shareholder at MetaboMed Ltd, Israel. Y.E.C. is the founder and O.R. is a scientific advisor at Diapin Therapeutics LLC. They are the inventors of PCT/US2019/046052 (Tri-peptides and treatment of metabolic, cardiovascular, and inflammatory disorders).

Figures

Figure 1:
Figure 1:. Downregulation of one carbon metabolism in mice with hepatic steatosis.
C57BL/6 mice were fed a standard chow diet (CD) or Western diet (WD) for 10 weeks. (A–B) Liver enzymes measured in the plasma, (A) ALT and (B) AST (n=6–7 in the CD group and n=5 in the WD group). (C) Gross liver morphology. (D) H&E and Oil Red O (ORO) imaging (scale bars: 20 μm). (E–F) Principal component analysis (PCA) of 1,200 chromatographic feature intensities detected in the (E) liver (n=7 in the CD group and n=5 in the WD group) and (F) 1,081 in the plasma (n=20 in the CD group and n=12 in the WD group) colored by group. (G–H) Volcano plots showing the relative changes in metabolite levels between the experimental groups in the (G) liver (324 metabolites; n=7 in the CD group and n=5 in the WD group) and (H) plasma (260 metabolites; n=20 in the CD group and n=12 in the WD group). Metabolites with non-significant differences are represented in grey, metabolites with significant differences (−log p-value >1.3) are represented in black and methylated metabolites significantly different among CD and WD fed mice are represented in red. (IJ) Pathway enrichment analysis based on significantly altered metabolites among WD and CD fed mice in the (I) liver and (J) plasma. (KL) Glycine levels in the (K) liver (n=7 in the CD group and n=5 in the WD group) and (L) plasma (n=20 in the CD group and n=12 in the WD group) measured using LC-MS. (M) Heat map representing the levels of downstream glycine metabolites in WD or CD fed mice. (N–O) Ratio of serine to glycine in the (N) liver (n=7 in the CD group and n=5 in the WD group) and (O) plasma (n=20 in the CD group and n=12 in the WD group). Data are mean ± SEM. Each point represents an individual mouse. P values were determined by two-tailed Student’s t-test.
Figure 2:
Figure 2:. Increased serine synthesis causes glycine depletion in hepatic steatosis.
13C2 glycine tracing in CD and WD fed mice. (A) Schematic representation of the experimental design. (B–E) Quantification of glycine and serine isotopologues in the (B, D) liver (n=7 in the CD group and n=5 in the WD group, n=5 in the CD-glycine group and n=5 in the WD-glycine group) and (C, E) plasma (n=20 in CD, n=12 in WD, n=5 in CD-glycine and n=4 in WD-glycine group). (F) Schematic representation of glycine contribution to serine synthesis via SHMT and the glycine cleavage system including the possible number of 13C2-glycine-derived carbons in each serine isotopologue. (G) The ratio of the weighted sum of serine isotopologues to labeled glycine in the plasma, calculated by multiplying each serine isotoplouge with the number of 13C2 glycine molecules needed for synthesis, as follows: ((M+1) nmol/ml X 1) + ((M+2) nmol/ml X 1) + ((M+3) nmol/ml X 2) (n=5 in the CD group and n=4 in the WD group). (HK) Metabolic analysis of the liver and plasma 70 minutes following SHMT inhibitor administration (n=3 in the vehicle group and n=4 in the SHMT inhibitor group). (L) Immunoblotting of SHMT2 in livers from Shmt2fl/fl Alb-Cre (+) mice and Shmt2fl/fl Alb-Cre (−) littermate controls. (M) Circulating levels of glycine measured using LC-MS in Shmt2fl/fl Alb-Cre (+) mice and Shmt2fl/fl Alb-Cre (−) littermate controls (n=3). Each point represents an individual mouse. Data are mean ± SEM. P values determined by two-tailed Student’s t-test (B, G–K, M) or one-way analysis of variance (ANOVA), followed by Tukey’s test (C–E).
Figure 3:
Figure 3:. Lipid loading decreases intracellular glycine and GSH and increases sensitivity to APAP in cultured hepatocytes.
(A–C) AML12 cells were incubated with BSA, 200 μM palmitate (PA) or oleic acid (OA) for 24 hrs. (A, B) Levels of the indicated metabolites were determined by LC-MS. (C) Superoxide was visualized with dihydroethidium (DHE, red) and nuclei were stained with Hoechst (blue) in live cells (scale bar: 50 μm). (D) Schematic representation of APAP metabolism in the liver. (E) DHE (red) and Hoechst (blue) staining in live cells 12 hours following the indicated treatments (scale bar: 50 μm). (F) Superoxide was visualized with DHE (red) and nuclei were stained with Hoechst (blue) in cells incubated for 12 hours in glycine depleted medium with the indicated treatments (scale bar: 50 μm). All graphs and images are representative of three independent experiments with at least three wells in each experiment. Data are mean ± SEM. P values were determined by one-way ANOVA, followed by Tukey’s test (A–B).
Figure 4:
Figure 4:. Mice with hepatic steatosis display decreased GSH recovery, increased oxidative stress and hepatotoxicity.
(A) Schematic representation of the experimental design. APAP (300 mg/kg) was administered intraperitoneally (I.P.) to CD and WD fed mice. (B) Plasma levels of ALT and (C) AST (n=9 in the CD group and n=6 in the WD group). (D) Gross liver morphology, (E) H&E staining (scale bars: 100 μm), and (F) histological scores of hemorrhage 24 hours following APAP injection (n=7 in the CD group and n=6 in the WD group). (G) Hepatic GSH levels determined by LC-MS at indicated time points (0 hour: n=12 in the CD group and n=7 in the WD group; 3 hours: n=11 in the CD group and n=5 in the WD group; 6 hours: n=11 in the CD group and n=7 in the WD group; 12 hours: n=5 per group). (H) GSSG/GSH ratio calculated from GSH and GSSG levels measured using LC-MS 12 hours following APAP administration (n=5 per group). (I) qPCR analysis of Nqo1 and Hmox1 expression relative to Gapdh 6 hours following APAP administration in livers from CD or WD fed mice (n=6 in the CD group and n=7 in the WD group). Data are mean ± SEM. Each point represents an individual mouse. P values were determined by two-tailed Student’s t-test (B, C, G–I).
Figure 5:
Figure 5:. Glycine rescues hepatic GSH levels and mitigates APAP hepatotoxicity in hepatic steatosis.
(A) Schematic representation of the experimental design. WD fed mice were orally administrated (gavage) with 1 g/kg glycine following APAP injection (300 mg/kg). (B–C) Liver glycine and GSH levels 6 hours following APAP and glycine administration as determined by LC-MS (n=7 in the saline group and APAP groups, n=6 in the APAP+Gly group). (D) Relative levels of 13C isotopologues 6 hours following APAP and 13C2 glycine administration (n=4). (E–F) Redox stress index and 4-HNE conjugated to GSH as measured using LC-MS (n=7 in the saline and APAP groups, n=6 in the APAP+Gly group). (G) Immunoblotting for γ-H2AX in liver lysates 24 hours following APAP and glycine administration with relative quantification. β-actin was used as loading control (n=4 in the APAP group, and n=5 in the APAP+Gly group). (H–I) Liver enzymes in the plasma 24 hours following administration of APAP and glycine (n=4–5 in the saline group, n=7 in the APAP group, and n=11–15 in the APAP+Gly group). (J) Liver morphology, (K) representative H&E histology in the liver (scale bar: 200 μm), and (L) histological score of hemorrhage and necrosis 24 hours following APAP and glycine administration (n=4 in in the saline group, n=7 in the APAP group, and n=10 in the APAP+Gly group). (M) Mice were video-recorded 24 hours after APAP administration and the percent time spent mobile was determined (n=6 in the APAP group, and n=8 in the APAP+Gly group). Data are mean ± SEM. Each point represents an individual mouse. P values were determined by one-way ANOVA followed by Tukey’s test (BC, EF, HI) or two-tailed Student’s t-test (LM).
Figure 6:
Figure 6:. Hepatocyte-specific loss of SHMT2 mitigates APAP toxicity in hepatic steatosis.
(A) Schematic representation of the experimental design. WD fed Shmt2fl/fl and Shmt2HKO mice were administered 300 mg/kg APAP. (BD) LC-MS analysis of the indicated metabolites 6 hours following APAP injection (n=3). (E) Immunoblotting for γ-H2AX relative to GAPDH in liver lysates 24 hours following APAP (n=4). (F) Plasma ALT 24 hours following APAP administration (n=8 Shmt2fl/fl Alb-Cre(−) and n=13 in Shmt2fl/fl Alb-Cre(+)). (G) Representative liver morphology and H&E histology (scale bar: 100um), and (H) histological score of hemorrhage and necrosis 24 hours following APAP administration n=8 Shmt2fl/fl Alb-Cre (−) and n=13 in Shmt2fl/fl Alb-Cre (+)). (I) Mice were video-recorded 24 hours after APAP administration and percent time spent mobile was assessed (n=7 Shmt2fl/fl Alb-Cre(−) and n=11 Shmt2fl/fl Alb-Cre(+)). Data are mean ± SEM. Each point represents an individual mouse. P values were determined by two-tailed Student’s t-test (BF, HI).

References

    1. Younossi Z, Anstee QM, Marietti M, Hardy T, Henry L, Eslam M, George J, and Bugianesi E (2018). Global burden of NAFLD and NASH: trends, predictions, risk factors and prevention. Nature reviews. Gastroenterology & hepatology 15, 11–20. 10.1038/nrgastro.2017.109. - DOI - PubMed
    1. Friedman SL, Neuschwander-Tetri BA, Rinella M, and Sanyal AJ (2018). Mechanisms of NAFLD development and therapeutic strategies. Nature medicine 24, 908–922. 10.1038/s41591-018-0104-9. - DOI - PMC - PubMed
    1. Gaggini M, Carli F, Rosso C, Buzzigoli E, Marietti M, Della Latta V, Ciociaro D, Abate ML, Gambino R, Cassader M, et al. (2018). Altered amino acid concentrations in NAFLD: Impact of obesity and insulin resistance. Hepatology 67, 145–158. 10.1002/hep.29465. - DOI - PubMed
    1. Hasegawa T, Iino C, Endo T, Mikami K, Kimura M, Sawada N, Nakaji S, and Fukuda S (2020). Changed Amino Acids in NAFLD and Liver Fibrosis: A Large Cross-Sectional Study without Influence of Insulin Resistance. Nutrients 12. 10.3390/nu12051450. - DOI - PMC - PubMed
    1. Wittemans LBL, Lotta LA, Oliver-Williams C, Stewart ID, Surendran P, Karthikeyan S, Day FR, Koulman A, Imamura F, Zeng L, et al. (2019). Assessing the causal association of glycine with risk of cardio-metabolic diseases. Nature communications 10, 1060. 10.1038/s41467-019-08936-1. - DOI - PMC - PubMed

Publication types

LinkOut - more resources