. 2024 Jun 1;31(6):931-952.
doi: 10.5551/jat.64578. Epub 2023 Dec 29.

Validation of Estimated Small Dense Low-Density Lipoprotein Cholesterol Concentration in a Japanese General Population

Affiliations

Validation of Estimated Small Dense Low-Density Lipoprotein Cholesterol Concentration in a Japanese General Population

Keisuke Endo et al. J Atheroscler Thromb. .

Abstract

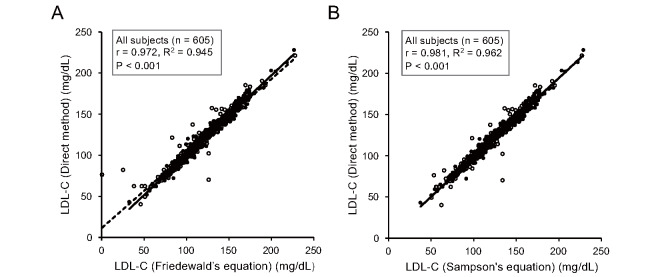
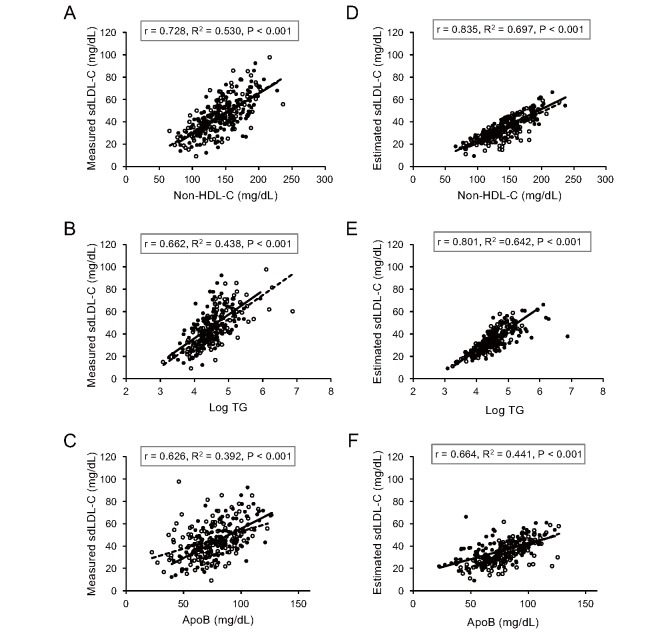
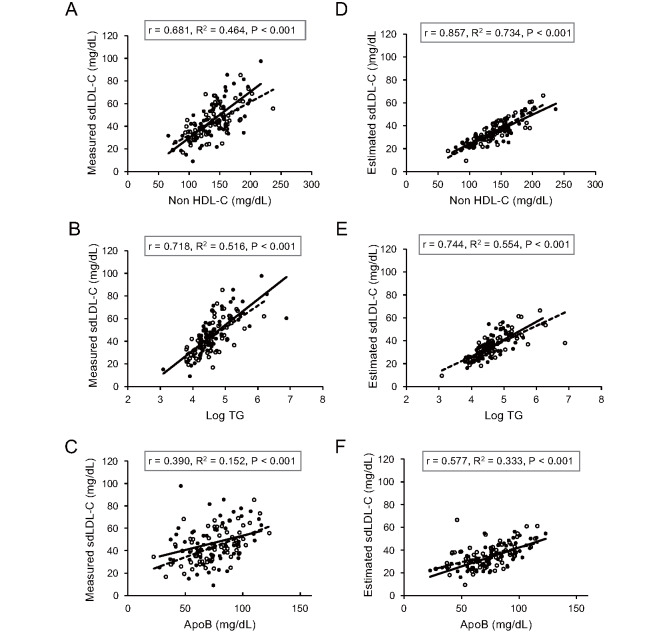
Aim: A high level of directly measured small dense low-density lipoprotein cholesterol (sdLDL-C) is a strong risk factor for atherosclerotic cardiovascular disease. A method for estimating sdLDL-C by using Sampson's equation that includes levels of total cholesterol, high-density lipoprotein cholesterol (HDL-C), non-HDL-C and triglycerides (TG) has recently been proposed. We investigated the validation and exploration of estimated sdLDL-C level.

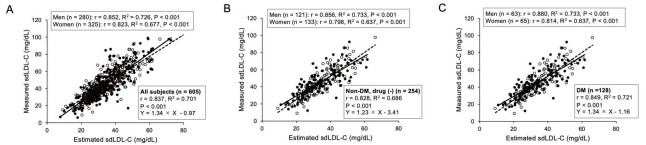
Methods: The associations between measured and estimated sdLDL-C levels were investigated in 605 Japanese subjects (men/women: 280/325; mean age: 65±15 years) who received annual health check-ups in the Tanno-Sobetsu Study, a population-based cohort.

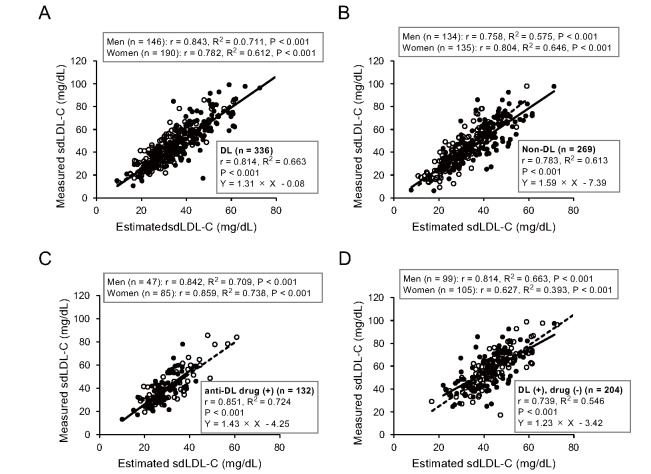
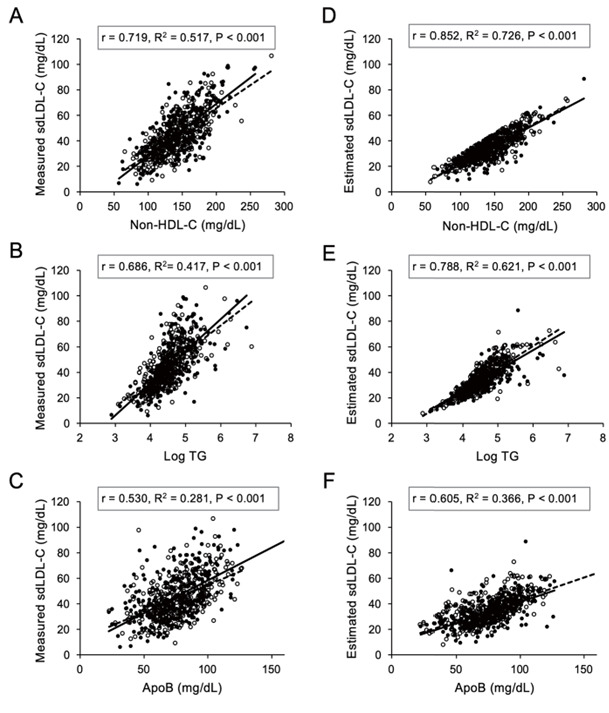
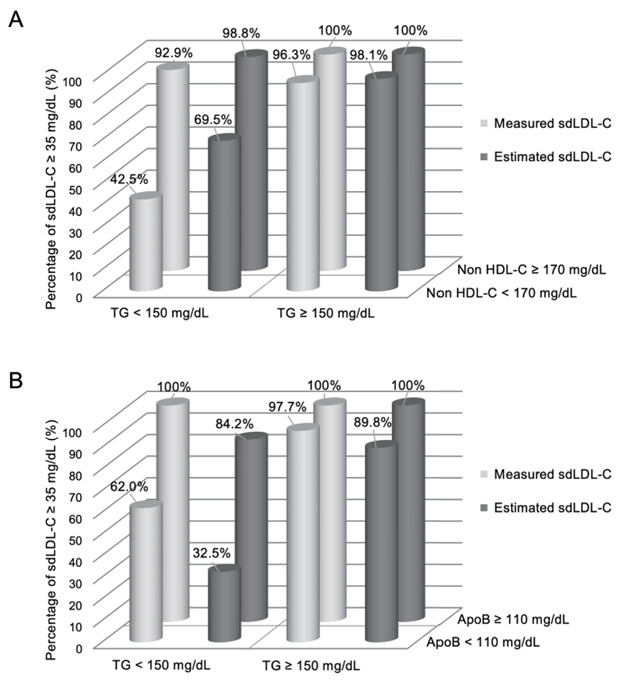
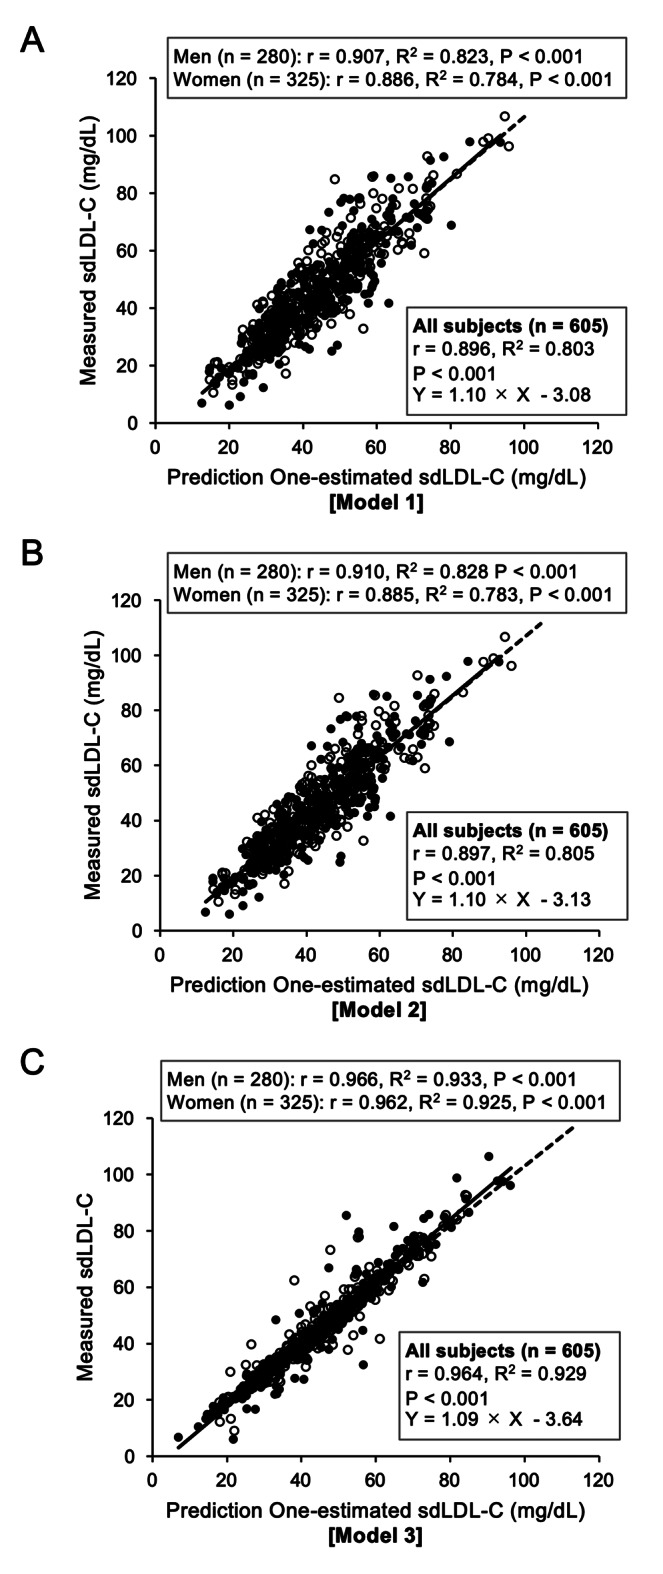
Results: Estimated sdLDL-C level was highly correlated with measured sdLDL-C level in all subjects (R2=0.701), nondiabetic subjects without any medication (n=254, R2=0.686) and subjects with diabetes mellitus (n=128, R2=0.721). Multivariable regression analysis showed that levels of non-HDL-C, TG and γ-glutamyl transpeptidase (γGTP) were independent predictors of measured sdLDL-C level. In a stratification of the LDL window, all of the subjects with a combination of high non-HDL-C (≥ 170 mg/dL) and high TG (≥ 150 mg/dL) had high levels of measured and estimated sdLDL-C (≥ 35 mg/dL). Furthermore, machine learning-based estimation of sdLDL-C level by artificial intelligence software, Prediction One, was substantially improved by using components of Sampson's equation (R2=0.803) and by using those components with the addition of γGTP and deletion of TC (R2=0.929).

Conclusions: sdLDL-C level estimated by Sampson's equation can be used instead of measured sdLDL-C level in general practice. By building multiple machine learning models of artificial intelligence, a more accurate and practical estimation of sdLDL-C level might be possible.

Keywords: Artificial intelligence; Machine learning; Sampson’s equation; Small dense low-density lipoprotein cholesterol; Validation.


Conflict of interest statement

The authors declare that they have no competing interests.

Figures

Supplementary Fig.1. Correlations of levels of LDL-C
A, B. Levels of low-density lipoprotein cholesterol (LDL-C) measured by a direct assay method were plotted against levels of LDL-C calculated by Friedewald’s equation (A) or Sampson’s equation (B) in all subjects (n=605, men/women: 280/325). Open circles and broken regression line: men; closed circles and solid regression line: women.
Fig.1. Correlations between measured and estimated sdLDL-C levels
A-C. Levels of directly measured small dense low-density lipoprotein cholesterol (sdLDL-C) were plotted against levels of estimated sdLDL-C calculated by Sampson’s equation in all subjects (n=605, men/women: 280/325) (A), in nondiabetic subjects without any medication (n=254, men/women: 121/133) (B) and in subjects with diabetes mellitus (DM) (n=128, men/women: 63/65) (C). Open circles and broken regression line: men; closed circles and solid regression line: women.
Supplementary Fig.2. Correlations of measured and estimated sdLDL-C levels in subjects with dyslipidemia A, B
Levels of measured small dense low-density lipoprotein cholesterol (sdLDL-C) were plotted against levels of estimated sdLDL-C in subjects with dyslipidemia (DL) (A) and non-DL (B). C, D. Levels of measured sdLDL-C were plotted against levels of estimated sdLDL-C in subjects with DL in the presence (C) and absence (D) of treatment with anti-DL drugs. Open circles and broken regression line: men; closed circles and solid regression line: women.
Fig.2. Correlations of measured and estimated sdLDL-C levels with lipid profiles
A-C. Levels of measured small dense low-density lipoprotein cholesterol (sdLDL-C) were plotted against levels of non-high-density lipoprotein cholesterol (non-HDL-C) (A), logarithmically transformed (Log) triglycerides (TG) (B) and apolipoprotein B (ApoB) (C) in all subjects (n=605, men/women: 280/325). D-F. Levels of estimated sdLDL-C were plotted against levels of non-HDL-C (D), Log TG (E) and ApoB (F) in all subjects. Open circles and broken regression line: men; closed circles and solid regression line: women.
Supplementary Fig.3. Correlations of measured and estimated sdLDL-C levels with lipid profiles in nondiabetic subjects without any medication
A-C. Levels of measured small dense low-density lipoprotein cholesterol (sdLDL-C) were plotted against levels of non-high-density lipoprotein cholesterol (non-HDL-C) (A), logarithmically transformed (Log) triglycerides (TG)(B) and apolipoprotein B (ApoB) (C) in nondiabetic subjects without any medication (n=254, men/women: 121/133). D-F. Levels of estimated sdLDL-C were plotted against levels of non-HDL-C (D), TG (E) and ApoB (F) in nondiabetic subjects without any medication. Open circles and broken regression line: men; closed circles and solid regression line: women.
Supplementary Fig.4. Correlations of measured and estimated sdLDL-C levels with lipid profiles in subjects with diabetes mellitus
A-C. Levels of measured small dense low-density lipoprotein cholesterol (sdLDL-C) were plotted against levels of non-high-density lipoprotein cholesterol (non-HDL-C) (A), logarithmically transformed (Log) triglycerides (TG) (B) and apolipoprotein B (ApoB) (C) in subjects with diabetes mellitus (n=128, men/women: 63/65). D-F. Levels of estimated sdLDL-C were plotted against levels of non-HDL-C (D), TG (E) and ApoB (F) in subjects with diabetes mellitus. Open circles and broken regression line: men; closed circles and solid regression line: women.
Fig.3. Stratification of high levels of measured and estimated sdLDL-C in the LDL window
A. Percentages of subjects with high levels of measured and estimated small dense low-density lipoprotein cholesterol (sdLDL-C) (≥ 35 mg/dL) in the low-density lipoprotein (LDL) window stratified by low (L-) and high (H-) levels of non-high-density lipoprotein cholesterol (non-HDL-C) (<170 mg/dL and ≥ 170 mg/dL) and triglycerides (TG) (<150 mg/dL and ≥ 150 mg/dL) in all subjects. The LDL window comprised four groups: L-non-HDL-C/L-TG (n=426), L-non-HDL-C/H-TG (n=54), H-non-HDL-C/L-TG (n=85) and H-non-HDL-C/H-TG (n=40). B. Percentages of subjects with high levels of measured and estimated sdLDL-C (≥ 35 mg/dL) in the LDL window stratified by apoprotein B (ApoB) (<110 mg/dL and ≥ 110 mg/dL) and L- and H-TG in all subjects. The LDL window comprised four groups: L-ApoB/L-TG (n=492), L- ApoB/H-TG (n=88), H-ApoB/L-TG (n=19) and H- ApoB/H-TG (n=6).
Fig.4. Correlations between measured and Prediction One-estimated sdLDL-C levels
A-C. Levels of directly measured small dense low-density lipoprotein cholesterol (sdLDL-C) were plotted against levels of Prediction One-estimated sdLDL-C using Model 1 (A), Mode 2 (B) and Model 3 (C) in all subjects (n=605, men/women: 280/325). Model 1: Components of Sampson’s equation including TC, HDL-C, non-HDL-C and TG. Model 2: Model 1 + γGTP=TC, HDL-C, non-HDL-C, TG and γGTP. Model 3: Model 2 – TC=HDL-C, non-HDL-C, TG and γGTP. Open circles and broken regression line: men; closed circles and solid regression line: women.

Similar articles

Cited by

References

    1. Siri-Tarino PW, Krauss RM: The early years of lipoprotein research: from discovery to clinical application. J Lipid Res, 2016; 57: 1771-1777 - PMC - PubMed
    1. Hirano T: Pathophysiology of Diabetic Dyslipidemia. J Atheroscler Thromb, 2018; 25: 771-782 - PMC - PubMed
    1. Krauss RM: Small dense low-density lipoprotein particles: clinically relevant? Curr Opin Lipidol, 2022; 33: 160-166 - PMC - PubMed
    1. Austin MA, Breslow JL, Hennekens CH, Buring JE, Willett WC, Krauss RM: Low-density lipoprotein subclass patterns and risk of myocardial infarction. Jama, 1988; 260: 1917-1921 - PubMed
    1. Hirano T, Ito Y, Saegusa H, Yoshino G: A novel and simple method for quantification of small, dense LDL. J Lipid Res, 2003; 44: 2193-2201 - PubMed

Publication types