. 2024 Jan 3;14(1):1.
doi: 10.1038/s41398-023-02722-w.

Aberrant resting-state co-activation network dynamics in major depressive disorder

Collaborators, Affiliations

Aberrant resting-state co-activation network dynamics in major depressive disorder

Ziqi An et al. Transl Psychiatry. .

Abstract

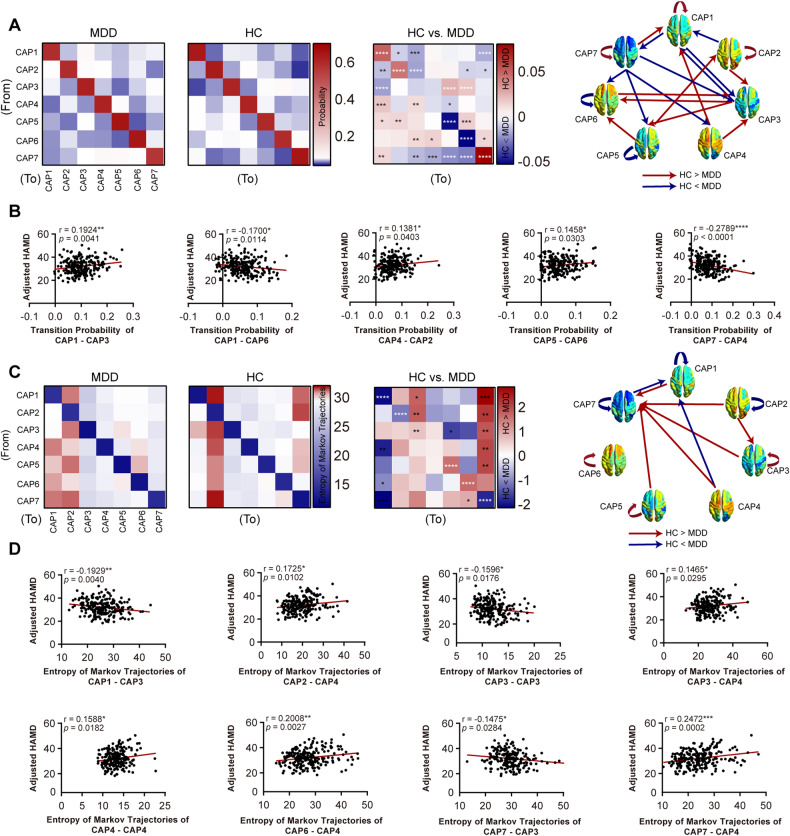
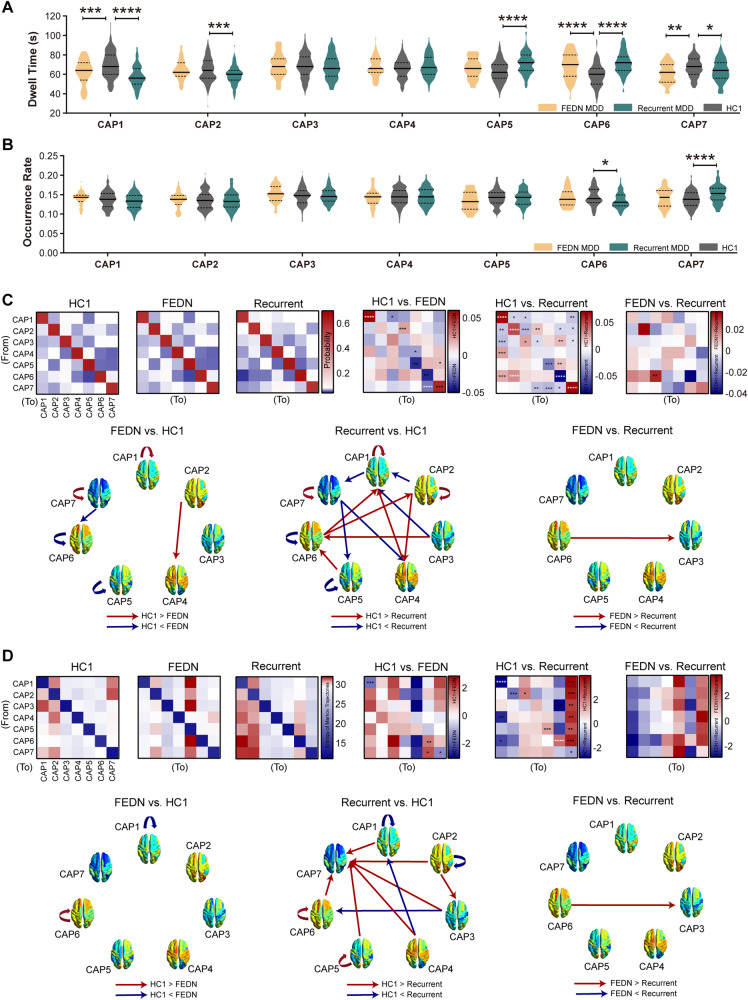
Major depressive disorder (MDD) is a globally prevalent and highly disabling disease characterized by dysfunction of large-scale brain networks. Previous studies have found that static functional connectivity is not sufficient to reflect the complicated and time-varying properties of the brain. The underlying dynamic interactions between brain functional networks of MDD remain largely unknown, and it is also unclear whether neuroimaging-based dynamic properties are sufficiently robust to discriminate individuals with MDD from healthy controls since the diagnosis of MDD mainly depends on symptom-based criteria evaluated by clinical observation. Resting-state functional magnetic resonance imaging (fMRI) data of 221 MDD patients and 215 healthy controls were shared by REST-meta-MDD consortium. We investigated the spatial-temporal dynamics of MDD using co-activation pattern analysis and made individual diagnoses using support vector machine (SVM). We found that MDD patients exhibited aberrant dynamic properties (such as dwell time, occurrence rate, transition probability, and entropy of Markov trajectories) in some transient networks including subcortical network (SCN), activated default mode network (DMN), de-activated SCN-cerebellum network, a joint network, activated attention network (ATN), and de-activated DMN-ATN, where some dynamic properties were indicative of depressive symptoms. The trajectories of other networks to deactivated DMN-ATN were more accessible in MDD patients. Subgroup analyses also showed subtle dynamic changes in first-episode drug-naïve (FEDN) MDD patients. Finally, SVM achieved preferable accuracies of 84.69%, 76.77%, and 88.10% in discriminating patients with MDD, FEDN MDD, and recurrent MDD from healthy controls with their dynamic metrics. Our findings reveal that MDD is characterized by aberrant dynamic fluctuations of brain network and the feasibility of discriminating MDD patients using dynamic properties, which provide novel insights into the neural mechanism of MDD.


Conflict of interest statement

The authors declare no competing interests.

Figures

Fig. 1
Fig. 1. The seven identified CAP topographies.
A Main network components of each CAP. The CAPs consisted of CAP1 (SCN), CAP2 (DMN+), CAP3 (SCN-CN), CAP4 (SCN+), CAP5 (pooled network), CAP6 (ATN+) and CAP7 (DMN-ATN). SCN subcortical network, DMN default mode network, CN cerebellum network, SMN somatosensory network, ATN attention network.
Fig. 2
Fig. 2. Dwell time and occurrence rate of CAPs.
A Group difference in dwell time between MDD patients and healthy controls for seven CAPs. B Group difference in occurrence rate between MDD patients and healthy controls in each CAP. Two sample t tests with covariates were used for dwell time and occurrence rate comparisons. All results were corrected for multiple comparisons using FDR correction within seven CAPs. Data were represented as mean ± SEM (standard error of mean). *P < 0.05, **P < 0.01, ***P < 0.001, ****P < 0.0001. nMDD = 221; nhealthy control = 215. See Supplementary Table S3 and 4 for detailed statistics. MDD major depressive disorder; HC healthy controls. CAP1: SCN; CAP2: DMN+; CAP3: SCN-CN; CAP4: SCN+; CAP5: pooled network; CAP6: ATN+; CAP7: DMN-ATN.
Fig. 3
Fig. 3. Transition probabilities and corresponding temporal trajectories among CAPs.
A Transition probability matrix of MDD patients and healthy controls between each CAP and comparison between two groups. The diagonal entries are persistence probabilities. Red rectangle indicates that the transition probability from a CAP to another CAP in healthy controls was greater than MDD patients. The blue rectangle is the opposite. B Behavioral evidence of transition probabilities for MDD patients. C Entropy of Markov trajectories matrix and comparison between MDD patients and healthy controls. D Behavioral evidence of temporal trajectories for MDD patients. Two sample t tests with covariates were used for comparison of transition probabilities and temporal trajectories. The relationship between these properties and HAMD scores was assessed using Pearson correlation. All P values were corrected for multiple comparisons with FDR correction within 49 paths. *P < 0.05, **P < 0.01, ***P < 0.001, ****P < 0.0001. nMDD = 221; nhealthy control = 215. CAP1: SCN; CAP2: DMN+; CAP3: SCN-CN; CAP4: SCN+; CAP5: pooled network; CAP6: ATN+; CAP7: DMN-ATN. See Supplementary Table S5 and 6 for detailed statistics.
Fig. 4
Fig. 4. Subgroup differences (FEDN MDD vs. Recurrent MDD vs. HC1) in temporal characteristics.
A Dwell time. B Occurrence rate. C Transition probabilities and their behavioral relevance. D Entropy of Markov trajectories (accessibility). All results were corrected for multiple comparisons using FDR correction. Data were represented as mean ± SEM. *P < 0.05, **P < 0.01, ***P < 0.001, ****P < 0.0001. nFEDN = 43; nHC1 = 135; nRecurrent = 100. HC1: healthy controls from the same site of FEDN and recurrent MDD patients. CAP1: SCN; CAP2: DMN+; CAP3: SCN-CN; CAP4: SCN+; CAP5: pooled network; CAP6: ATN+; CAP7: DMN-ATN.
Fig. 5
Fig. 5. Reproducibility analysis.
A Different cluster numbers k. B Different parcellation schemes. Craddock’s 200 functional clustering atlas and Harvard-Oxford atlas were tested. C Global signal regression. Two sample t test with covariates. Multiple comparisons with FDR correction. Data were represented as mean ± SEM. *P < 0.05, **P < 0.01, ***P < 0.001, ****P < 0.0001. nMDD = 221; nhealthy control = 215. EM entropy of Markov trajectories. CAP1: SCN; CAP2: DMN+; CAP3: SCN-CN; CAP4: SCN+; CAP5: pooled network; CAP6: ATN+; CAP7: DMN-ATN.
Fig. 6
Fig. 6. Accuracy and AUC based on dynamic features using SVM.
A Accuracy distribution with 1000 permutation tests of four classifiers (MDD vs. HC, FEDN vs. HC1, Recurrent vs. HC1 and FEDN vs. Recurrent). B AUC distribution with 1000 permutation tests of four classifiers. P values were based on 1000 permutation tests.

References

    1. Friedrich MJ. Depression is the leading cause of disability around the world. JAMA. 2017;317:1517.. - PubMed
    1. Biswal B, Zerrin Yetkin F, Haughton VM, Hyde JS. Functional connectivity in the motor cortex of resting human brain using echo‐planar MRI. Magn Reson Med. 1995;34:537–41. doi: 10.1002/mrm.1910340409. - DOI - PubMed
    1. Beckmann CF, DeLuca M, Devlin JT, Smith SM. Investigations into resting-state connectivity using independent component analysis. Philos Trans R Soc B Biol Sci. 2005;360:1001–13. doi: 10.1098/rstb.2005.1634. - DOI - PMC - PubMed
    1. Damoiseaux JS, Rombouts S, Barkhof F, Scheltens P, Stam CJ, Smith SM, et al. Consistent resting-state networks across healthy subjects. Proc Natl Acad Sci. 2006;103:13848–53. doi: 10.1073/pnas.0601417103. - DOI - PMC - PubMed
    1. Kaiser RH, Andrews-Hanna JR, Wager TD, Pizzagalli DA. Large-scale network dysfunction in major depressive disorder: a meta-analysis of resting-state functional connectivity. JAMA Psychiatry. 2015;72:603–11. doi: 10.1001/jamapsychiatry.2015.0071. - DOI - PMC - PubMed

MeSH terms