. 2024 Jan 4;10(1):1.
doi: 10.1038/s41420-023-01786-3.

Modulation of tumor microenvironment by targeting histone acetylation in bladder cancer

Affiliations

Modulation of tumor microenvironment by targeting histone acetylation in bladder cancer

Sandra P Nunes et al. Cell Death Discov. .

Abstract

Alterations in the epigenetic machinery in both tumor and immune cells contribute to bladder cancer (BC) development, constituting a promising target as an alternative therapeutic option. Here, we have explored the effects of a novel histone deacetylase (HDAC) inhibitor CM-1758, alone or in combination with immune checkpoint inhibitors (ICI) in BC. We determined the antitumor effects of CM-1758 in various BC cell lines together with the induction of broad transcriptional changes, with focus on the epigenetic regulation of PD-L1. Using an immunocompetent syngeneic mouse model of metastatic BC, we studied the effects of CM-1758 alone or in combination with anti-PD-L1 not only on tumor cells, but also in the tumor microenvironment. In vitro, we found that CM-1758 has cytotoxic and cytostatic effects either by inducing apoptosis or cell cycle arrest in BC cells at low micromolar levels. PD-L1 is epigenetically regulated by histone acetylation marks and is induced after treatment with CM-1758. We also observed that treatment with CM-1758 led to an important delay in tumor growth and a higher CD8 + T cell tumor infiltration. Moreover, anti-PD-L1 alone or in combination with CM-1758 reprogramed macrophage differentiation towards a M1-like polarization state and increased of pro-inflammatory cytokines systemically, yielding potential further antitumor effects. Our results suggest the possibility of combining HDAC inhibitors with immunotherapies for the management of advanced metastatic BC.


Conflict of interest statement

The authors declare no competing interests.

Figures

Fig. 1
Fig. 1. Cytotoxic and cytostatic effects of CM-1758 in bladder cancer cell lines.
a Survival curves with the IC50 value for the BC cell lines 253 J, 5637, J82, RT112, TCCSUP and 4K5 (percentage of survival with calculated with XTT vs log10 of CM-1758 concentrations) with respective standard deviation and R2. b Cell cycle profiles containing G0/G1, S and G2/M phases for 253 J, 5637, J82, RT112, TCCSUP and 4K5 after treatment with CM-1758. c Representative gating of live (DAPI negative, annexin V negative), necrotic (DAPI positive, annexin V negative), early apoptotic (DAPI negative, annexin V positive) and late apoptotic cells (DAPI positive, annexin V positive) cells. d Percentage of live, necrotic, early and late apoptotic cells for all cell lines after treatment with CM-1758. Non-treated cells are represented in grey and CM-1758 treated cells are shown in blue. Treatment with CM-1758 was given for 48 h with IC50 dose calculated for each cell line for cell cycle and annexin V analyzes. Data shown are the mean of ≥3 experiments ± SEM. P-values are represented as ns – not significant, *<0.05, **<0.01, ***<0.001 and ****<0.0001.
Fig. 2
Fig. 2. CM-1758 effects on the transcriptomic profile of 253 J, J82, RT112 and TCCSUP cells.
a Heatmap of the dysregulated genes between untreated control vs. treated cells with IC50 dose of CM-1758. Genes and groups (control and treated) are hierarchically clustered. b Venn diagrams of genes (1) up and (2) downregulated in treated cells vs. control cells. c Heatmap of GSVA analysis showing the main signaling pathways from hallmarks in cancer enriched in control and treated cells. Control and treated groups are hierarchically clustered. d Enrichr analysis of the upregulated genes in all cell lines when compared to the respective untreated control cells. e Regulon activity profiles for potential regulators associated with BC. Control and treated groups are hierarchically clustered. f Regulon activity profiles for potential regulators associated with chromatin remodeling. Control and treated groups are hierarchically clustered. Control denotes untreated cells, whereas treated refers to CM-1758 treated cells. Treatment with CM-1758 was given for 48 h with IC50 dose calculated for each cell line. Two independent experiments were included for each cell line and condition.
Fig. 3
Fig. 3. Histone acetylation and DNA methylation levels after treatment with CM-1758. PD-L1 epigenetic regulation by promoter acetylation.
a Western blot analysis of total acetylation of H3 (H3ac), acetylation of lysine 9 of histone 3 (H3K9ac) and acetylation of lysine 27 of histone 3 (H3K27ac) respect to total histone 3 (H3) levels for all cell lines after treatment with CM-1758. C – Control, T - Treated. b Representative immunofluorescence for 5-methylcytosine of J82 cells after treatment with CM-1758 (in red). Cell nuclei were identified by DAPI staining (in blue). Scale bar 20 µm. c Quantification of 5-methylcytosine levels by immunofluorescence after treatment with CM-1758 represented by fold-change respective to the untreated control cells in J82 and 4K5 cells. d Relative expression by RT-qPCR of PD-L1 respect to TBP for all BC lines after treatment with CM-1758. e PD-L1 expression evaluated by flow cytometry represented by fold-change respective to non-treated control cells and (f) Single parameter histogram of mean intensity fluorescence (MFI) of PD-L1 levels with CM-1758 treatment in 4K5 cells (g) Schematic representation of the PD-L1 promoter regions evaluated by CUT&RUN (h) Presence of H3K9 and H3K27 acetylation in four different regions [region 1 -213 to -140 bp, region 2 -473 to -385 bp, region 3 -954 to -888 bp and region 4 -1286 to -1225 bp before the transcription start site (TSS)] of PD-L1 promoter after treatment with CM-1758 evaluated by CUT&RUN. Values are represented as fold-change relative to the untreated control cells. Cells were treated with CM-1758 for 48 h with the IC50 dose calculated for each cell line. Data shown are the mean of ≥3 experiments ± SEM. P-values are represented as ns – not significant, *<0.05, **<0.01 and ***<0.001.
Fig. 4
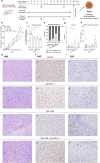
Fig. 4. In vivo effects of CM-1758 alone and in combination with immune checkpoint inhibitors.
a Schematic representation of the protocols used for treatment with CM-1758 and anti-PD-L1 alone or in combination. CM-1758 was applied for two weeks, five days a week with two rest days represented in red. Anti-PD-L1 was injected once a week for two weeks. Mice in all groups were sacrificed at day 15. Tumors were collected for histology, flow cytometry analysis and RNA extraction. Created with BioRender.com (b) Normalized tumor growth curves for the first day of treatment in control, anti-PD-L1, CM-1758 and CM-1758+anti-PD-L1 groups. c Anti-tumor efficacy of anti-PD-L1, CM-1758 and CM-1758+anti-PD-L1. d Representative H&E staining of the tumors from each group (1) control, (2) anti-PD-L1, (3) CM-1758 and (4) CM-1758+anti-PD-L1); e Graphical representation of percentage of Ki67 expression for each group. Cut-off was defined as <80% as low and >80% as high percentage of positive cells. f Representative immunohistochemistry staining of Ki67 for (1) control, (2) anti-PD-L1, (3) CM-1758, and (4) CM-1758+anti-PD-L1 tumors. g Percentage of necrosis present in tumors from each treatment group at the end of treatment of control, anti-PD-L1, CM-1758 or combination. h Number of CD8 + T cells (cells/mm2) infiltrating in necrosis areas in control, anti-PD-L1, CM-1758 and CM-1758+anti-PD-L1 groups. Only tumors displaying necrosis areas were evaluated. i Representative immunohistochemistry staining of CD8 for (1) control, (2) anti-PD-L1, (3) CM-1758, and (4) CM-1758+anti-PD-L1 tumors. Graphs show individual values as the mean ± SEM for ≥8 mice included in each group. Scale bar 50 µM. P-values are represented as ns – not significant, *<0.05, **<0.01 and ***<0.001.
Fig. 5
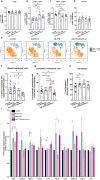
Fig. 5. Effects of CM-1758 and immune checkpoint inhibitors in tumor lymphoid cells, the non-immune compartment and cytokine profile.
Percentage of (a) T cells gated in CD45+ cells, (b) CD8 + T cells gated in CD3+ cells, (c) CD4 + T cells gated in CD3+ cells and (d) B cells gated in CD45+ cells present in the tumors. (e) Representative opt-tSNE analysis of CD8 + T, CD4 + T and B cells repertoire according to treatment groups. Percentage of (f) blood endothelial cells gated in CD45-GFP- cells, (g) lymphatic endothelial cells gated in CD45-GFP- cells (h) fibroblasts gated in CD45-GFP- cells present in the tumor microenvironment. (i) Fold-change of cytokine profile (IFN-γ, CXCL1, TNF-α, CCL2, IL-12, CCL5, IL-1β, CXCL10, IFN-β and IL-6) analyzed in plasma of control, anti-PD-L1, CM-1758 and CM-1758+anti-PD-L1 treated mice. Graphs show individual values as the mean ± SEM for ≥8 mice included in each group. P values are represented as ns – not significant, *<0.05, **<0.01 and ***<0.001.
Fig. 6
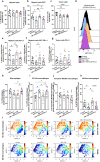
Fig. 6. Myeloid repertoire changes after treatment with CM-1758 and PD-L1 blockade therapy.
Percentage of (a) myeloid cells gated in CD45+ cells, (b) phagocytic myeloid cells gated in CD45+ cells and (c) tumor cells gated in live cells. (d) Single parameter histograms of mean intensity fluorescence (MFI) of PD-L1 expression in the four treatment groups. Percentage of PD-L1 positive of (e) myeloid cells gated in CD45 + CD11b+ cells, (f) phagocytic myeloid cells gated in CD45 + CD11b+GFP+ cells, and (g) tumor cells gated in GFP+ cells. Percentage of (h) macrophages gated in CD45 + CD11b+ cells, (i) M1-like macrophages gated in CD45 + CD11b + F4/80+ cells, j transition M1/M2 macrophages gated in CD45 + CD1b + F4/80+ cells and (k) M2-like macrophages gated in CD45 + CD11b + F4/80+ cells. l Opt-tSNE analyzes of tumor-present M1-like and M2-like macrophages for MHC-II (I-A/I-E) and CD206 markers. Graphs show individual values as the mean ± SEM for ≥8 mice included in each group. P-values are represented as ns – not significant, *<0.05, **<0.01 and ***<0.001.

References

    1. Sung H, Ferlay J, Siegel RL, Laversanne M, Soerjomataram I, Jemal A, et al. Global Cancer Statistics 2020: GLOBOCAN Estimates of Incidence and Mortality Worldwide for 36 Cancers in 185 Countries. CA Cancer J Clin. 2021;71:209–49. doi: 10.3322/caac.21660. - DOI - PubMed
    1. Cumberbatch MGK, Jubber I, Black PC, Esperto F, Figueroa JD, Kamat AM, et al. Epidemiology of Bladder Cancer: A Systematic Review and Contemporary Update of Risk Factors in 2018. Eur Urol. 2018;74:784–95. doi: 10.1016/j.eururo.2018.09.001. - DOI - PubMed
    1. Amin MB, Edge SB, Greene FL, Byrd DR, Brookland RK, Washington MK, et al. AJCC Cancer Staging Manual. Springer International Publishing, (2018).
    1. Powles T, Bellmunt J, Comperat E, De Santis M, Huddart R, Loriot Y, et al. Bladder cancer: ESMO Clinical Practice Guideline for diagnosis, treatment and follow-up. Ann Oncol. 2022;33:244–58. doi: 10.1016/j.annonc.2021.11.012. - DOI - PubMed
    1. Rhea LP, Mendez-Marti S, Kim D, Aragon-Ching JB. Role of immunotherapy in bladder cancer. Cancer Treat Res Commun. 2021;26:100296. doi: 10.1016/j.ctarc.2020.100296. - DOI - PubMed