

Drivers of arthropod biodiversity in an urban ecosystem
- PMID: 38172148
- PMCID: PMC10764344
- DOI: 10.1038/s41598-023-50675-3
Drivers of arthropod biodiversity in an urban ecosystem
Abstract
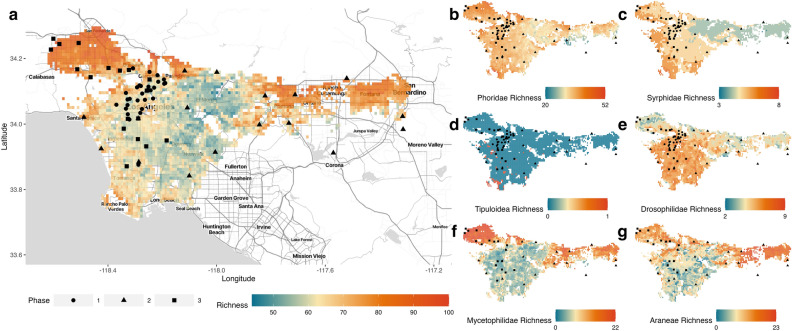
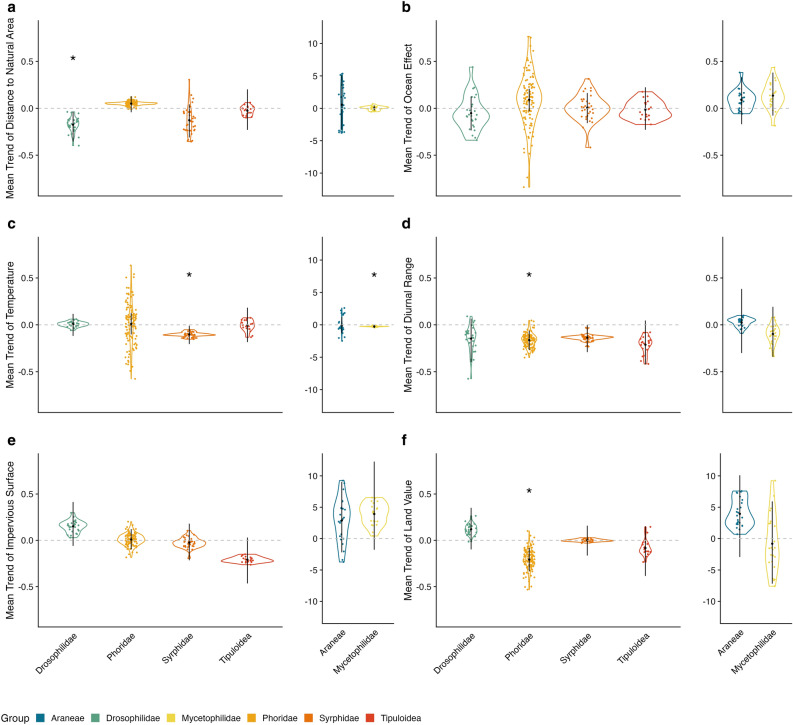
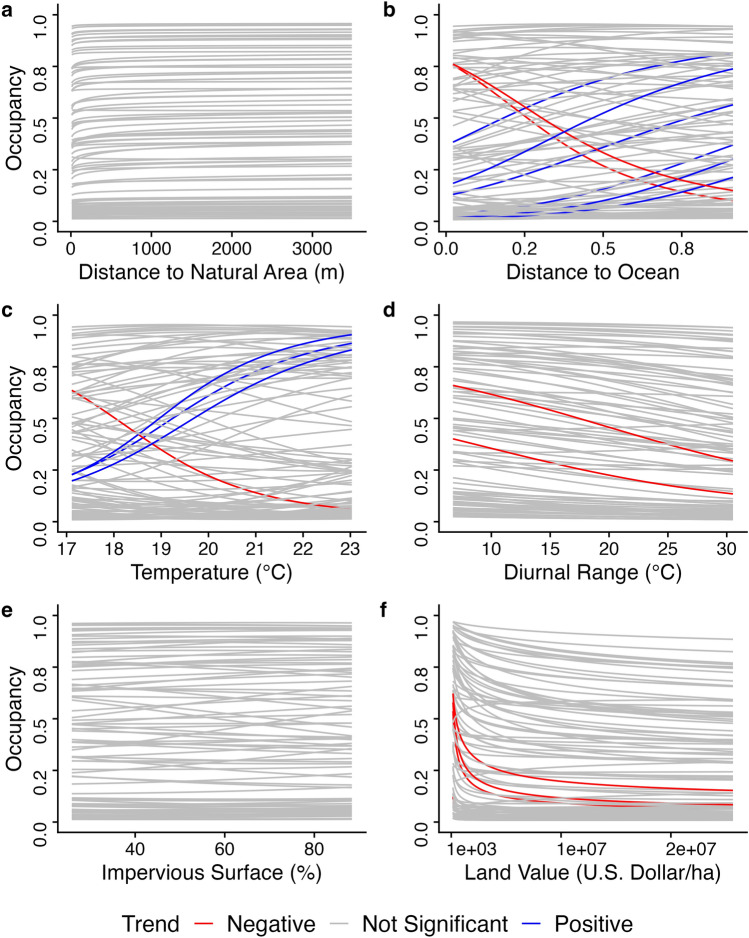
Our world is becoming increasingly urbanized with a growing human population concentrated around cities. The expansion of urban areas has important consequences for biodiversity, yet the abiotic drivers of biodiversity in urban ecosystems have not been well characterized for the most diverse group of animals on the planet, arthropods. Given their great diversity, comparatively small home ranges, and ability to disperse, arthropods make an excellent model for studying which factors can most accurately predict urban biodiversity. We assessed the effects of (i) topography (distance to natural areas and to ocean) (ii) abiotic factors (mean annual temperature and diurnal range), and (iii) anthropogenic drivers (land value and amount of impervious surface) on the occurrence of six arthropod groups represented in Malaise trap collections run by the BioSCAN project across the Greater Los Angeles Area. We found striking heterogeneity in responses to all factors both within and between taxonomic groups. Diurnal temperature range had a consistently negative effect on occupancy but this effect was only significant in Phoridae. Anthropogenic drivers had mixed though mostly insignificant effects, as some groups and species were most diverse in highly urbanized areas, while other groups showed suppressed diversity. Only Phoridae was significantly affected by land value, where most species were more likely to occur in areas with lower land value. Los Angeles can support high regional arthropod diversity, but spatial community composition is highly dependent on the taxonomic group.
© 2024. The Author(s).
Conflict of interest statement
The authors declare no competing interests.
Figures
Similar articles
-
Impervious surface and local abiotic conditions influence arthropod communities within urban greenspaces.PeerJ. 2022 Jan 24;10:e12818. doi: 10.7717/peerj.12818. eCollection 2022. PeerJ. 2022. PMID: 35127289 Free PMC article.
-
The value of urban vacant land to support arthropod biodiversity and ecosystem services.Environ Entomol. 2013 Dec;42(6):1123-36. doi: 10.1603/EN12275. Environ Entomol. 2013. PMID: 24468552 Review.
-
Temperature accounts for the biodiversity of a hyperdiverse group of insects in urban Los Angeles.Proc Biol Sci. 2019 Oct 9;286(1912):20191818. doi: 10.1098/rspb.2019.1818. Epub 2019 Oct 2. Proc Biol Sci. 2019. PMID: 31575368 Free PMC article.
-
A landscape ecology approach identifies important drivers of urban biodiversity.Glob Chang Biol. 2015 Apr;21(4):1652-67. doi: 10.1111/gcb.12825. Epub 2015 Jan 24. Glob Chang Biol. 2015. PMID: 25620599
-
Urban plants and climate drive unique arthropod interactions with unpredictable consequences.Curr Opin Insect Sci. 2018 Oct;29:27-33. doi: 10.1016/j.cois.2018.06.001. Epub 2018 Jun 7. Curr Opin Insect Sci. 2018. PMID: 30551822 Review.
Cited by
-
Using unstructured crowd-sourced data to evaluate urban tolerance of terrestrial native animal species within a California Mega-City.PLoS One. 2024 May 29;19(5):e0295476. doi: 10.1371/journal.pone.0295476. eCollection 2024. PLoS One. 2024. PMID: 38809860 Free PMC article.
-
Urban biodiversity in the Anthropocene.Sci Rep. 2024 Nov 13;14(1):27851. doi: 10.1038/s41598-024-77311-y. Sci Rep. 2024. PMID: 39537702 Free PMC article.
References
-
- Dobbs C, Escobedo FJ, Zipperer WC. A framework for developing urban forest ecosystem services and goods indicators. Landsc. Urban Plan. 2011;99:196–206. doi: 10.1016/j.landurbplan.2010.11.004. - DOI
-
- Collins JP, et al. A new urban ecology: Modeling human communities as integral parts of ecosystems poses special problems for the development and testing of ecological theory. Am. Sci. 2000;88:416–425. doi: 10.1511/2000.35.416. - DOI
MeSH terms
LinkOut - more resources
Full Text Sources
