. 2024 Jan 3;14(1):439.
doi: 10.1038/s41598-023-50195-0.

Single-cell sequencing dissects the transcriptional identity of activated fibroblasts and identifies novel persistent distal tubular injury patterns in kidney fibrosis

Affiliations

Single-cell sequencing dissects the transcriptional identity of activated fibroblasts and identifies novel persistent distal tubular injury patterns in kidney fibrosis

Valeria Rudman-Melnick et al. Sci Rep. .

Abstract

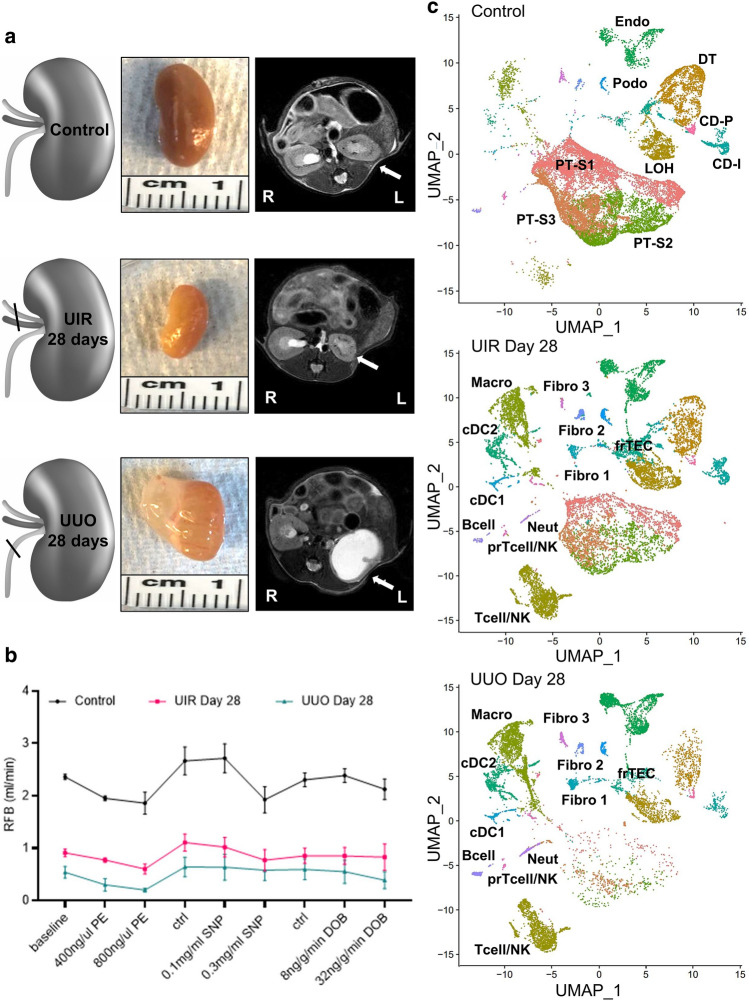
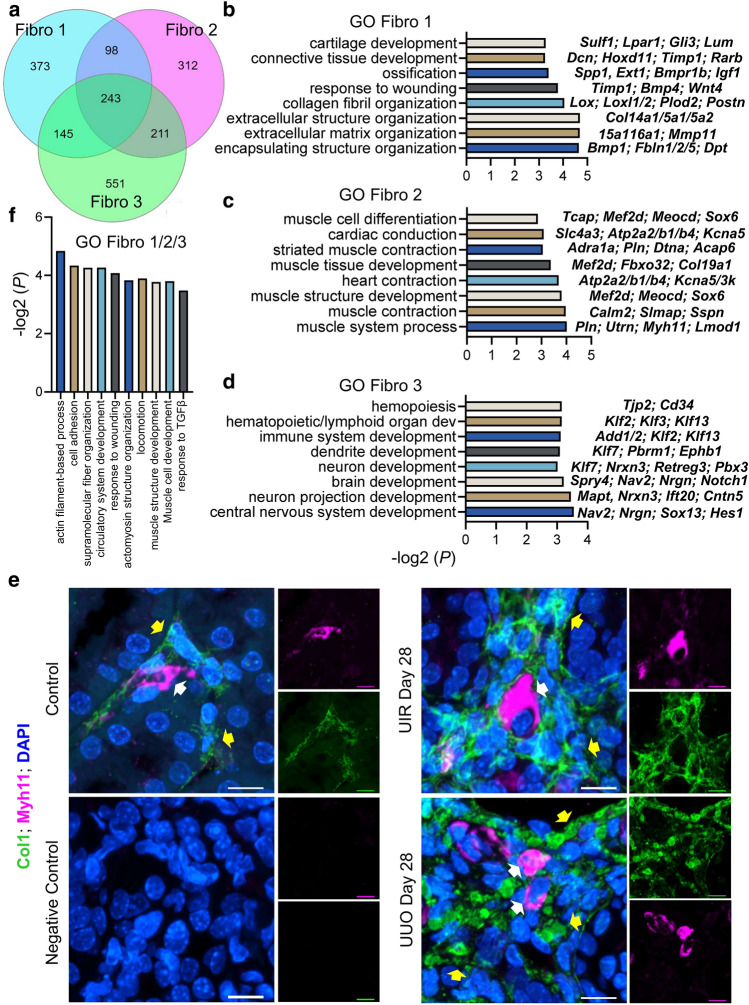
Examining kidney fibrosis is crucial for mechanistic understanding and developing targeted strategies against chronic kidney disease (CKD). Persistent fibroblast activation and tubular epithelial cell (TEC) injury are key CKD contributors. However, cellular and transcriptional landscapes of CKD and specific activated kidney fibroblast clusters remain elusive. Here, we analyzed single cell transcriptomic profiles of two clinically relevant kidney fibrosis models which induced robust kidney parenchymal remodeling. We dissected the molecular and cellular landscapes of kidney stroma and newly identified three distinctive fibroblast clusters with "secretory", "contractile" and "vascular" transcriptional enrichments. Also, both injuries generated failed repair TECs (frTECs) characterized by decline of mature epithelial markers and elevation of stromal and injury markers. Notably, frTECs shared transcriptional identity with distal nephron segments of the embryonic kidney. Moreover, we identified that both models exhibited robust and previously unrecognized distal spatial pattern of TEC injury, outlined by persistent elevation of renal TEC injury markers including Krt8 and Vcam1, while the surviving proximal tubules (PTs) showed restored transcriptional signature. We also found that long-term kidney injuries activated a prominent nephrogenic signature, including Sox4 and Hox gene elevation, which prevailed in the distal tubular segments. Our findings might advance understanding of and targeted intervention in fibrotic kidney disease.


Conflict of interest statement

P.D. is a co-inventor on patents for the use of NGAL as a biomarker of kidney injury. The remaining authors declare no competing interests.

Figures

Figure 1
Figure 1
Ischemia/reperfusion and obstruction induced models of CKD elicit dramatic proximal tubular loss, kidney functional decline and novel cellular clusters. (a) Schemes of injury models (left), macroscopic (middle) and MRI (right) images of normal control, UIR and UUO day 28 kidneys. Kidneys are pointed to with white arrows. R right, L left. (b) Renal blood flow (RBF) at baseline, with vasoconstrictive (PE phenylephrine), vasodilative (SNP sodium nitroprusside) and inotropic agent (DOB dobutamine). Agents administered at 0.1 μl/min/gBW, Ctrl control interval between treatments, n = 3–4 per group, mean ± SD. **P ≤ 0.01, ***P ≤ 0.001, ****P ≤ 0.0001 compared to control, Student’s t test. (c) UMAPs show renal cell populations in the control, UIR and UUO kidneys (n = 3–5 per group). Clusters are distinguished by different colors. PT proximal tubules, S1/2/3 segment 1/2/3, LOH loop of Henle, DT distal tubule, CD-P collecting duct principal, CD-I collecting duct intercalated, Podo podocytes, Endo endothelial, Macro macrophages, Neutro neutrophils, cDC conventional dendritic cells, NK natural killer, prTcell proliferating Tcell, Fibro fibroblasts, frTEC failed repair tubular epithelial cells.
Figure 2
Figure 2
scRNA-seq dissects molecular and cell type proportion changes in the UIR and UUO models of renal fibrosis. (a) Dot plot of cell type-specific expression of marker genes for manually annotated clusters. Scale: dot size denotes percentage (0, 25, 50, 75, 100) of cells expressing the marker. Color intensity represents average gene expression values. Complete marker gene list is presented in Supplementary Table S1. (b) Relative fibroblast cluster proportion in the control (salmon), UIR (green) and UUO (blue) kidneys. Cell subset proportion change is shown relative to the listed conditions. (c) Pathway RespOnsive GENes (PROGENy) for activity inference analysis of three fibroblast clusters in the control, UIR and UUO kidneys. Complete PROGENy analysis of all populations is present in the Supplementary Fig. S24. Expression levels are represented with color gradient.
Figure 3
Figure 3
UIR and UUO elicit three transcriptionally distinctive fibroblast clusters. (a) Dot plot of cell type-specific expression of known fibrosis marker genes for manually annotated clusters. Scale: dot size denotes percentage (0, 25, 50, 75, 100) of cells expressing the marker. Color intensity represents average gene expression values. (b) qPCR of fibrosis (Col1a1, Fn1) markers, n = 4–7 per group. **P ≤ 0.01, ****P ≤ 0.0001 compared to control, Student’s t test. (c) Representative IF images of Col1a1 (green) and DAPI (blue) in control, UIR and UUO kidneys. Original magnification, × 40, maximal intensity projection, 0.40 μm/px zoom.
Figure 4
Figure 4
Three distinctive secretory, contractile and migratory fibroblast clusters emerge in advanced UIR and UUO. (a) Venn diagram displaying unique and shared Fibroblast 1, 2 and 3 marker genes. Complete lists of genes are presented in the Supplementary Table S4. (bd) GO Biological process of fibroblast clusters unique marker genes vs other populations in control, UIR and UUO, − log2 (P). Representative genes are shown on the left for each biological process. Complete GO analysis is presented in the Supplementary Table S4. (e) Representative images of combined IF for Col1a1 (green), Myh11 (magenta) and DAPI (blue) in control, UIR and UUO kidneys. Original magnification, × 60, maximal intensity projection, 0.06 μm/px zoom. White arrows show Myh11-positive fibroblasts, yellow arrows show Col1a1-positive fibroblasts. (f) GO Biological process of fibroblast clusters 243 shared marker genes, − log2 (P). Complete GO analysis is presented in the Supplementary Table S4.
Figure 5
Figure 5
frTECs show transcriptional similarity with embryonic and adult distal segments of the nephron tubule. (a) Relative epithelial cluster proportion in the control (salmon), UIR (green) and UUO (blue) kidneys. Cell subset proportion change is shown relative to the listed conditions. (b) GO Biological process of “frTECs” marker genes vs other populations in control, UIR and UUO, − log2 (P). Names of the particular genes representing the biological process are listed on the left. Full biological process analysis and gene list is presented in the Supplementary Table S5. (c) UMAPs show renal cell populations in the E18 WT kidney (left), adult frTECs alignment to the E18 WT kidney populations (middle) and E18 WT kidney cluster designation (right). WT, wild type. Data source for E18 WT kidney scRNA-seq: GSE214024. Complete marker gene list for E18 WT kidney is presented in the Supplementary Table S6. (d) Venn diagrams displaying unique and shared PT S1–3, frTECs, loop of Henle, distal tubule and collecting duct principal and intercalated marker genes. Complete lists of genes are presented in the Supplementary Table S7.
Figure 6
Figure 6
Long-term kidney parenchymal remodeling exhibits distal spatial pattern of tubular injury. (a) Dot plot of cell type-specific expression of renal epithelial injury markers for manually annotated clusters in the control, UIR and UUO kidney. Dot size denotes percentage of cells expressing the marker. Color intensity represents average gene expression values. (b) Upper panels—representative images of combined IF for Krt8 (magenta), Umod (yellow), Ecad (white) and DAPI (blue) in control, UIR and UUO kidneys. Original magnification, maximal intensity projection, × 60, 0.14 μm/px zoom. While frames indicate areas of magnification in the lower panels. Lower panels – representative images of combined IF for Krt8 (magenta), Umod (yellow), Ecad (white) and DAPI (blue) in control, UIR and UUO kidneys. Original magnification, × 60, maximal intensity projection, 0.09 μm/px zoom. White arrows indicate the areas of overlap between Krt8 and Umod/Ecad-expressing tubules.
Figure 7
Figure 7
Loop of Henle and Krt8-positive segments of the nephron tubule exhibit persistent Vcam1 elevation at advanced kidney fibrotic remodeling stages. (a) Quantitative analysis (left) and whole-kidney representative images (right) of combined IF for Lrp2 (green), Umod (yellow), Vcam1 (magenta) and DAPI (blue) in the control, UIR and UUO kidneys. Original magnification, × 10, maximal intensity projection. Quantitative analysis: n = 4 per group, *P ≤ 0.05, **P ≤ 0.01, compared to control, Student’s t test. (b) Representative images (left) and quantitative analysis (right) of combined IF for Lrp2 (green), Ecad (yellow), Vcam1 (cyan), Krt8 (magenta) and DAPI (blue) in the control, UIR and UUO kidneys. Original magnification, × 60, maximal intensity projection, 0.28 μm/px zoom. White arrows highlight Vcam1 and Krt8 colocalization with Ecad. Quantitative analysis: n = 4 animals per group, 3–4 images per animal, ***P ≤ 0.001, ****P ≤ 0.0001, Student’s t test.
Figure 8
Figure 8
Advanced fibrotic injuries cause renal developmental program reactivation in the distal nephron tubular segments of adult kidney. (a) Dot plot of cell type-specific expression of Hoxb6, Cd24a and Sox4 for manually annotated clusters in the control, UIR and UUO kidney. Dot size denotes percentage of cells expressing the marker. Color intensity represents average gene expression values. (b) Representative RNAscope images for Hoxb6 (green), Lrp2 (magenta), Slc12a3 (white) and DAPI in the control and UIR kidneys. Original magnification, × 60, maximal intensity projection, 0.14 μm/px zoom. White arrows show Hoxb6 expression in Lrp2-nehative and Slc12a3-positive tubules. (c) Sox4 and Cd24a qPCR in control and fibrotic kidneys, n = 4–7 per group. (d) Representative bands and quantifications of Sox4 and Cd24a Western blots, n = 4–5 per group. Representative bands are cropped out of the original gels and are separated by the black border, the unprocessed original blots/gels are presented in Supplementary Fig. S29. *P ≤ 0.05, ***P ≤ 0.001, ****P ≤ 0.0001 compared to control, Student’s t test for (c) and (d). (e) Representative images of combined IF for Sox4 (green), Umod (yellow), DAB (magenta), LTL (white) and DAPI (blue), control and UIR kidneys. Original magnification, maximal intensity projection, × 60, 0.09 μm/px zoom. Areas of Sox4 co-localization with Umod are shown with white arrows.

Update of

Similar articles

Cited by

References

    1. Kalantar-Zadeh K, Jafar TH, Nitsch D, Neuen BL, Perkovic V. Chronic kidney disease. Lancet. 2021;398:786–802. doi: 10.1016/S0140-6736(21)00519-5. - DOI - PubMed
    1. Lv JC, Zhang LX. Prevalence and disease burden of chronic kidney disease. Adv. Exp. Med. Biol. 2019;1165:3–15. doi: 10.1007/978-981-13-8871-2_1. - DOI - PubMed
    1. United States Renal Data System . USRDS Annual Data Report: Epidemiology of Kidney Disease in the United States. National Institutes of Health, National Institute of Diabetes and Digestive and Kidney Diseases; 2021.
    1. Schiessl IM, et al. Renal interstitial platelet-derived growth factor receptor-beta cells support proximal tubular regeneration. J. Am. Soc. Nephrol. 2018;29:1383–1396. doi: 10.1681/ASN.2017101069. - DOI - PMC - PubMed
    1. Djudjaj S, Boor P. Cellular and molecular mechanisms of kidney fibrosis. Mol. Aspects Med. 2019;65:16–36. doi: 10.1016/j.mam.2018.06.002. - DOI - PubMed