. 2024 Jan 3;15(1):210.
doi: 10.1038/s41467-023-44645-6.

Systems-based identification of the Hippo pathway for promoting fibrotic mesenchymal differentiation in systemic sclerosis

Affiliations

Systems-based identification of the Hippo pathway for promoting fibrotic mesenchymal differentiation in systemic sclerosis

Feiyang Ma et al. Nat Commun. .

Abstract

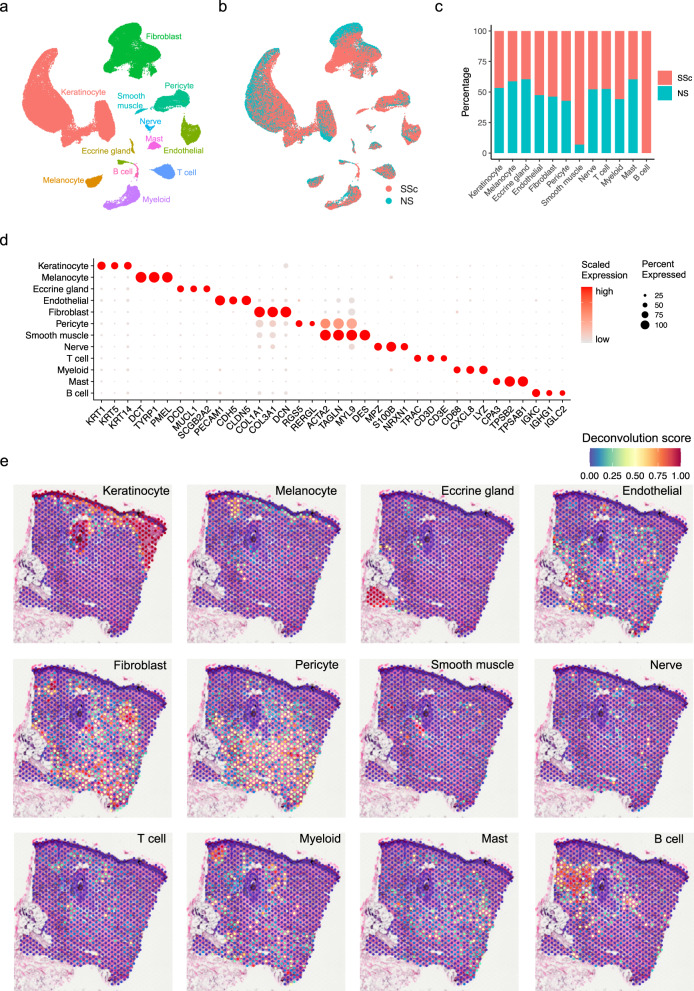
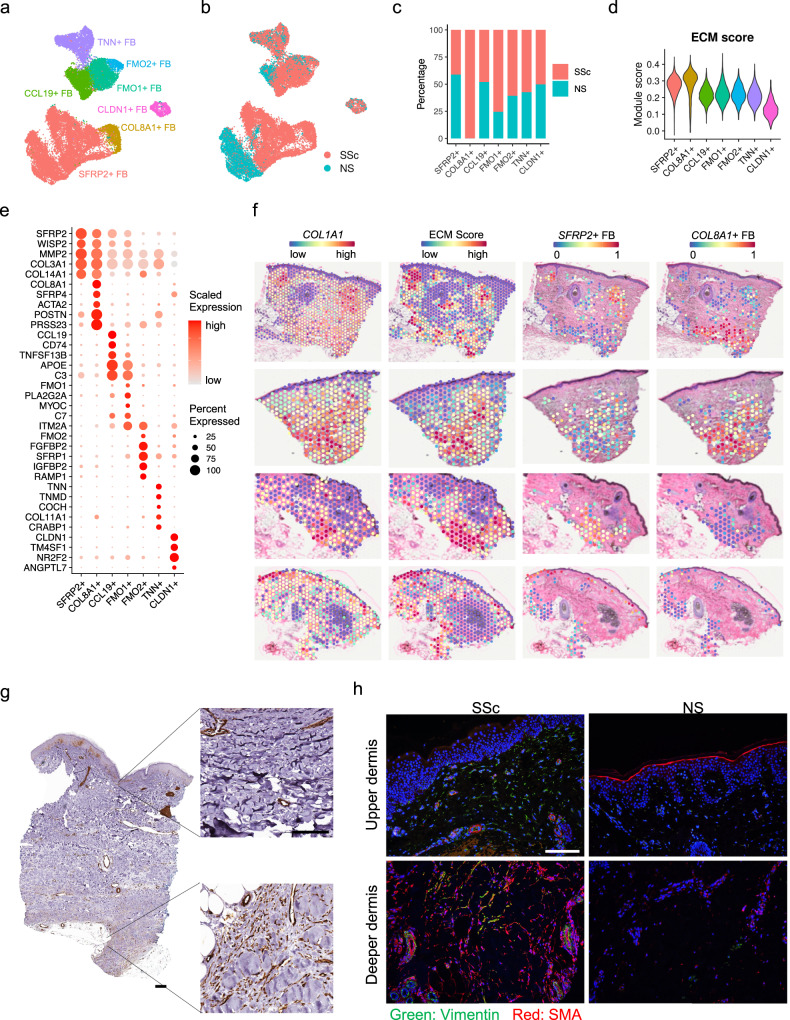
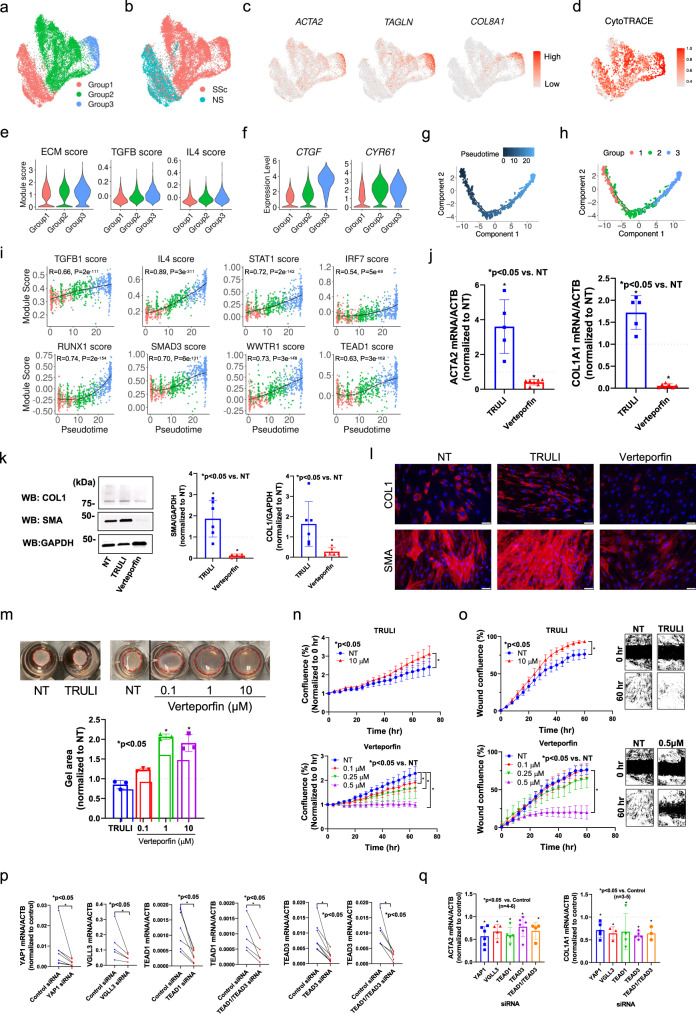
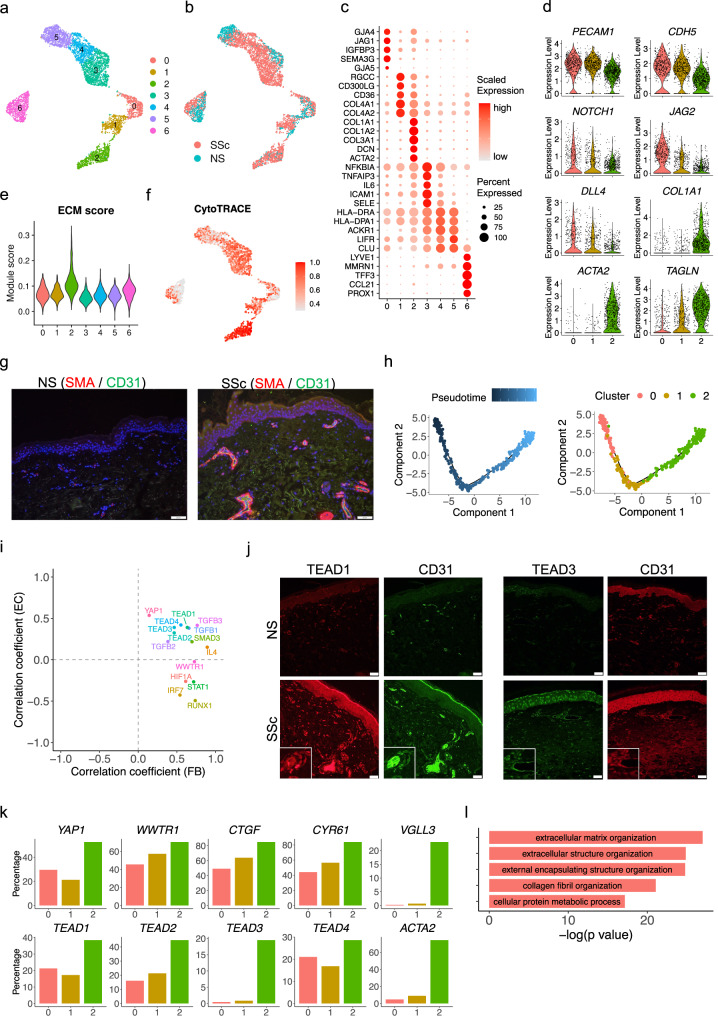
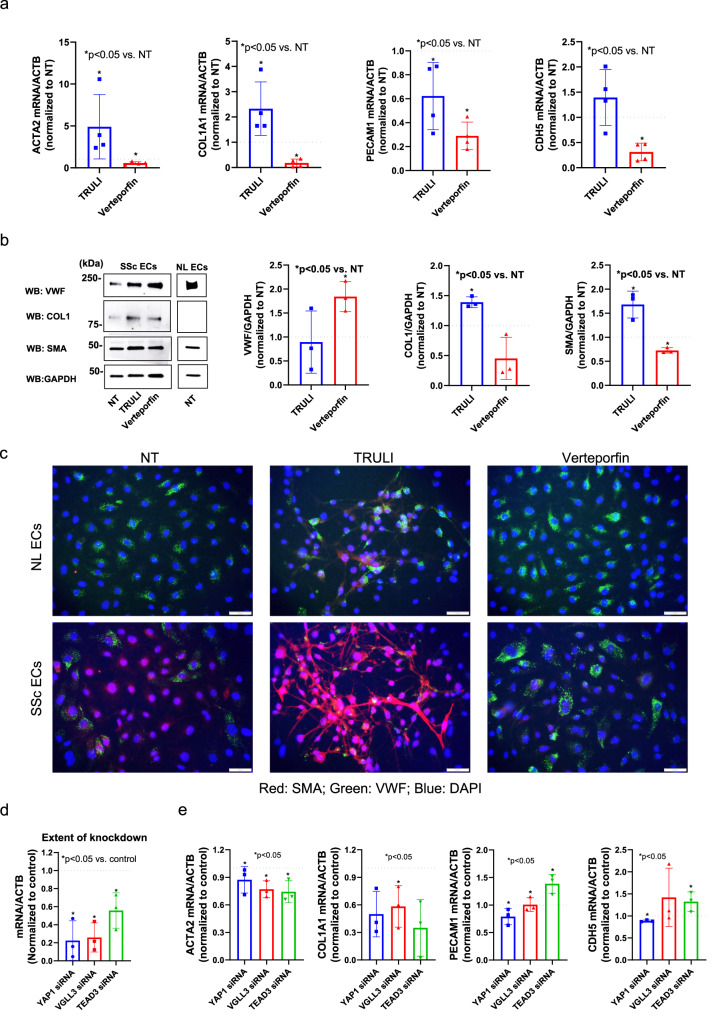
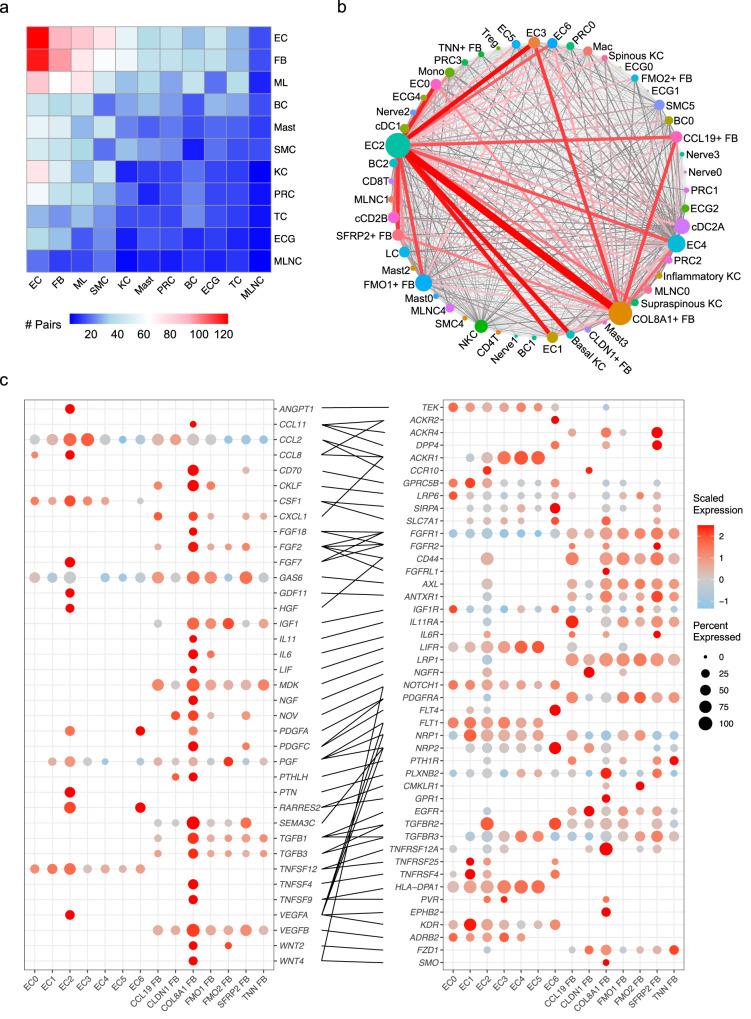
Systemic sclerosis (SSc) is a devastating autoimmune disease characterized by excessive production and accumulation of extracellular matrix, leading to fibrosis of skin and other internal organs. However, the main cellular participants in SSc skin fibrosis remain incompletely understood. Here using differentiation trajectories at a single cell level, we demonstrate a dual source of extracellular matrix deposition in SSc skin from both myofibroblasts and endothelial-to-mesenchymal-transitioning cells (EndoMT). We further define a central role of Hippo pathway effectors in differentiation and homeostasis of myofibroblast and EndoMT, respectively, and show that myofibroblasts and EndoMTs function as central communication hubs that drive key pro-fibrotic signaling pathways in SSc. Together, our data help characterize myofibroblast differentiation and EndoMT phenotypes in SSc skin, and hint that modulation of the Hippo pathway may contribute in reversing the pro-fibrotic phenotypes in myofibroblasts and EndoMTs.


Conflict of interest statement

J.E.G. has received Grant support from Celgene/BMS, Janssen, Eli Lilly, and Almirall. J.E.G. has served on advisory boards for AstraZeneca, Sanofi, Eli Lilly, Boehringer Ingelheim, Novartis, Janssen, Almirall, BMS. J.M.K. has received Grant support from Q32 Bio, Celgene/BMS, Ventus Therapeutics, and Janssen. J.M.K. has served on advisory boards for AstraZeneca, Eli Lilly, GlaxoSmithKline, Bristol Myers Squibb, Avion Pharmaceuticals, Provention Bio, Aurinia Pharmaceuticals, Ventus Therapeutics, Vera Therapeutics, and Boehringer Ingelheim. P.W.H. has received effort support from Q32 Bio. The remaining authors declare no competing interests.

Figures

Fig. 1
Fig. 1. Cell types observed in SSc skin and their spatial locations.
a UMAP plot showing 96,174 cells colored by cell types. b UMAP plot showing the cells colored by disease conditions. SSc systemic sclerosis, NS normal skin. c Bar plot showing the abundance composition across the disease conditions for each cell type in scRNA-seq. d Dot plot showing representative marker genes for each cell type. The color scale represents the scaled expression of each gene. The size of the dot represents the percentage of cells expressing each gene of interest. e Spatial plot showing the deconvolution score for each cell type. The coordinates of the spot correspond to the location in the tissue (spatial data representative of n = 4).
Fig. 2
Fig. 2. Identification of fibroblast subtypes and their spatial locations.
a UMAP plot showing 25,182 fibroblasts colored by subtypes. b UMAP plot showing the fibroblasts colored by disease conditions. c Bar plot showing the abundance composition across the disease conditions for each fibroblast subtype. d Violin plot showing the extracellular matrix module scores in the fibroblast subtypes. e Dot plot showing the top marker genes for each fibroblast subtype. The color scale represents the scaled expression of each gene. The size of the dot represents the percentage of cells expressing the gene of interest. f The left two panels show the COL1A1 expression and extracellular matrix module score across all the spots in four spatial-seq samples. The right two columns show the deconvolution score for the SFRP2+ FB and COL8A1+ FB in the fibroblast-rich spots. g Immunohistochemistry staining for SMA in SSc skin tissue. The size bar represents 100 μm (staining is representative of n = 3). h Immunofluorescence showing the colocalization of Vimentin and SMA in the SSc and NS tissues (staining is representative of n = 3). The size bar represents 100 μm.
Fig. 3
Fig. 3. Hippo pathway regulates myofibroblast differentiation in SSc skin.
a UMAP plot showing the SFRP2+ FB and COL8A1+ FB colored by groups. b UMAP plot showing the SFRP2+ FB and COL8A1+ FB colored by disease conditions. c UMAP plots showing the expression level of ACTA2, TAGLN and COL8A1 in the three fibroblast groups. d UMAP plot showing the CytoTRACE score in the three fibroblast groups. A higher CytoTRACE score suggests the cell being more differentiated. e Violin plots showing the extracellular matrix, TGF-β and IL-4 module scores in the three fibroblast groups. f Violin plots showing the expression level of CTGF and CYR61 in the three fibroblast groups. g Pseudotime trajectory colored by the pseudotime of the three fibroblast groups. h Pseudotime trajectory colored by the group identity of the three fibroblast groups. i Scatter plots showing the correlation between the fibroblast pseudotime and the target score or the upstream regulators. The color represents the group identity of the cell. Correlation test was applied. j Quantitative PCR results showing the effect of TRULI or verteporfin (both 10 μM) on ACTA2 and COL1A1 expression in dcSSc fibroblasts. Data normalized to NT. N = 5–7 patient lines. Data presented as mean +/− SD. Mann–Whitney test was applied. P < 0.05 was designated as statistically significant. p = 0.0079 for the TRULI groups, p = 0.0006 for the verteporfin groups. k Effect of TRULI or verteporfin (both 10 μM) on COL1 and SMA levels by Western blotting. Quantification of samples were from different blots, however the blots were processed in parallel and the data of each patient line is normalized to its own NT group. N = 5–6 patient lines. Data presented as mean +/− SD. Two-sided unpaired t-test was applied. P < 0.05 was designated as statistically significant. p = 0.035 for SMA-TRULI, p = 0.0001 for SMA-verteporfin, p = 0.0001 for COL1-verteporfin. l Immunofluorescence showing TRULI enhanced while verteporfin Inhibited COL1 and SMA expression in dcSSc fibroblasts. The size bar represents 50 μm. m TRULI enhanced while verteporfin blocked gel contraction in dcSSc fibroblasts. Data normalized to the corresponding NT group. N = 3 patient lines. Data presented as mean +/− SD. Kruskal–Wallis test or Mann–Whitney test was applied for verteporfin or Truli, respectively. P < 0.05 was designated as statistically significant. p = 0.019 and p = 0.049 for verteporfin 1 μM and 10 μM. n TRULI increased cell proliferation while verteporfin dose-dependently blocked cell growth. Cell proliferation was monitored by analyzing the occupied area by cells over time, using the IncuCyte S3 Analysis software. N = 3 patient lines. Data presented as mean +/− SEM. Two-way ANOVA test was applied. P < 0.05 was designated as statistically significant. P = 0.0001 for all significant groups. o TRULI enhanced cell migration while verteporfin blocked migration in a dose-dependent manner. Two-way ANOVA test was applied. N = 4 patient lines. Data presented as mean +/− SEM. P < 0.05 was designated as statistically significant. P = 0.0001 for all significant groups. p Extent of knockdown of genes relevant in the Hippo pathway in dcSSc fibroblasts. N = 5 patient lines. Two-sided paired t-test or Wilcoxon test was applied. P < 0.05 was designated as statistically significant. YAP1 siRNA: p = 0.016; TEAD1 siRNA: p = 0.0037; TEAD1/TEAD3 siRNA: p = 0.017 for TEAD1, p = 0.016 for TEAD3; TEAD3 siRNA: p = 0.0078. q Knockdown of genes involved in the Hippo pathway resulted in downregulation of ACTA2 and COL1A1. N = 4–6 patient lines. Two-sided unpaired t-test was applied. P < 0.05 was designated as statistically significant. Data presented as mean +/− SD. ACTA2: p = 0.0006 for YAP1 and TEAD1 siRNA; p = 0.0059 for VGLL3 siRNA; p = 0.031 for TEAD3 siRNA; p = 0.014 for TEAD1/TEAD3 siRNA. COL1A1: p = 0.0051 for YAP1 siRNA; p = 0.013 for VGLL3 siRNA; p = 0.0001 for TEAD3 siRNA, p = 0.013 for TEAD1/TEAD3 siRNA. Source data is provided for this figure.
Fig. 4
Fig. 4. Characterization of endothelial to mesenchymal transition in SSc skin.
a UMAP plot showing 5070 endothelial cells colored by sub-clusters. b UMAP plot showing the endothelial cells colored by disease conditions. c Dot plot showing the top marker genes for each endothelial sub-cluster. The color scale represents the scaled expression of each gene. The size of the dot represents the percentage of cells expressing the gene of interest. d Violin plots showing the expression level of representative genes in the endothelial sub-cluster 0, 1 and 2. e Violin plots showing the extracellular matrix module score in the endothelial sub-clusters. f UMAP plot showing the CytoTRACE score in the endothelial sub-clusters. A higher CytoTRACE score suggests the cell being more differentiated. g Immunofluorescence showing the colocalization of SMA and CD31 in the NS and SSc skin tissues. Images shown are representative of n = 3. The size bar represents 20 μm. h Pseudotime trajectory colored by the pseudotime (left) and sub-cluster identity (right) of three endothelial sub-clusters. i Scatter plot showing the correlation coefficients between the target score of the upstream regulators and the fibroblast pseudotime (X axis) and endothelial pseudotime (Y axis). j Immunofluorescence showing the colocalization of TEAD1/CD31 (left) and TEAD3/CD31 (right) in the NS and SSc skin tissues. Images shown are representative of n = 3. The size bar represents 20 μm. k Bar plots showing the percentage of cells expressing the gene in the endothelial sub-cluster 0, 1 and 2. l Bar plot showing the top five Gene Ontology pathways enriched for the 240 common up-regulated genes in fibroblast group 3 compared to group 1, 2 and endothelial sub-cluster 2 compared to sub-cluster 0, 1.
Fig. 5
Fig. 5. Hippo pathway regulates endothelial to mesenchymal transition in SSc skin.
a The effect of TRULI (10 μM) and verteporfin (1 μM) on ACTA2, COL1A1, PECAM1, and CDH5 expression in dcSSc endothelial cells. Data normalized to NT. N = 4 patient lines. Data presented as mean +/− SD. Mann–Whitney test was applied. P < 0.05 was designated as statistically significant. P = 0.029 for all the groups that were marked significant. b Western blotting showing the effect of TRULI or verteporfin on VWF, COL1, and SMA in dcSSc endothelial cells. The expression levels of each protein in healthy dermal ECs are shown for comparison. Quantification of samples were from different blots, however, the blots were processed in parallel and the data of each patient line is normalized to its own NT group. N = 3 patient lines. Two-sided unpaired t-test was applied. P < 0.05 was designated as statistically significant. P = 0.0095 for VWF-verteporfin, p = 0.0016 for COL1-TRULI, p = 0.014 for SMA-TRULI, p = 0.001 for SMA-vertepofrin. NL normal. c Immunofluorescence showing TRULI enhanced the mesenchymal phenotype while verteporfin promoted the endothelial phenotype in dcSSc endothelial cells, while in healthy ECs, TRULI induced EndoMT to a lesser extent, while verteporfin had minimal effect. Images shown are representative of N = 3 patient lines. Scale bar = 50 μm. d The extent of knockdown of YAP1, VGLL3, or TEAD3 in dcSSc endothelial cells. N = 3 patient lines. Data normalized to control and presented as mean +/− SD. Two-sided unpaired t-test was applied. P < 0.05 was designated as statistically significant. P = 0.0036 for YAP1 siRNA, p = 0.0013 for VGLL3 siRNA, p = 0.017 for TEAD3 siRNA. e Knockdown of genes involved in the Hippo pathway blocked the EndoMT phenotype in dcSSc endothelial cells. Two-sided unpaired t-test was applied. P < 0.05 was designated as statistically significant. Data presented as mean +/− SD. N = 3 patient lines. ACTA2: p = 0.012 for VGLL3 siRNA, p = 0.02 for TEAD3 siRNA; COL1A1: p = 0.025 for YAP1 siRNA, p = 0.033 for VGLL3 siRNA, p = 0.022 for TEAD3 siRNA; PECAM1: p = 0.018 for TEAD3 siRNA; CDH5: p = 0.0007 for YAP1 siRNA. Source data is provided for this figure.
Fig. 6
Fig. 6. Myofibroblasts and EndoMTs act as central hubs in cell-cell communications.
a Heatmap showing the number of ligand-receptor pairs with interaction scores higher in SSc compared to NS. Row, cell type expressing the ligand; column, cell type expressing the receptor. Color scale, number of ligand-receptor pairs. EC endothelial cell, FB fibroblast, ML myeloid cell, BC B cell. Mast mast cell, SMC smooth muscle cell, KC keratinocyte, PRC pericyte. TC T cell, ECG eccrine gland cell, MLNC melanocyte. b Connectome web analysis of interacting subtypes in the SSc samples. Vertex (colored cell node) size is proportional to the number of interactions to and from that cell type, whereas the thickness of the connecting lines is proportional to the number of interactions between two nodes. c Dot plots showing expression of the ligands (left) and receptors (right) in endothelial and fibroblast subtypes in the SSc samples. Color scale indicates the level of expression in positive cells, whereas dot size reflects the percentage of cells expressing the gene.

References

    1. Morisset J, et al. Mortality risk prediction in scleroderma-related interstitial lung disease: the SADL model. Chest. 2017;152:999–1007. doi: 10.1016/j.chest.2017.06.009. - DOI - PMC - PubMed
    1. Allanore Y, et al. Systemic sclerosis. Nat. Rev. Dis. Prim. 2015;1:15002. doi: 10.1038/nrdp.2015.2. - DOI - PubMed
    1. López-Isac E, et al. GWAS for systemic sclerosis identifies multiple risk loci and highlights fibrotic and vasculopathy pathways. Nat. Commun. 2019;10:4955. doi: 10.1038/s41467-019-12760-y. - DOI - PMC - PubMed
    1. Billi AC, Kahlenberg JM, Gudjonsson JE. Sex bias in autoimmunity. Curr. Opin. Rheumatol. 2019;31:53–61. doi: 10.1097/BOR.0000000000000564. - DOI - PMC - PubMed
    1. Walecka I, Roszkiewicz M, Malewska A. Potential occupational and environmental factors in SSc onset. Ann. Agric Environ. Med. 2018;25:596–601. doi: 10.26444/aaem/75894. - DOI - PubMed

Publication types