. 2024 Jan 3;14(1):320.
doi: 10.1038/s41598-023-51021-3.

N-glycan profiling of tissue samples to aid breast cancer subtyping

Affiliations

N-glycan profiling of tissue samples to aid breast cancer subtyping

Iva Benesova et al. Sci Rep. .

Abstract

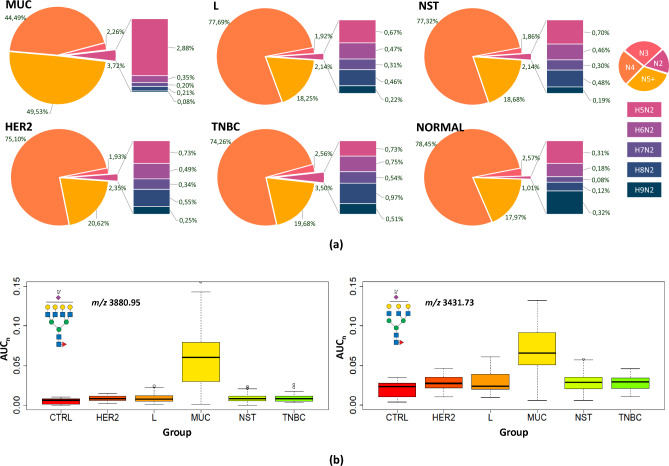
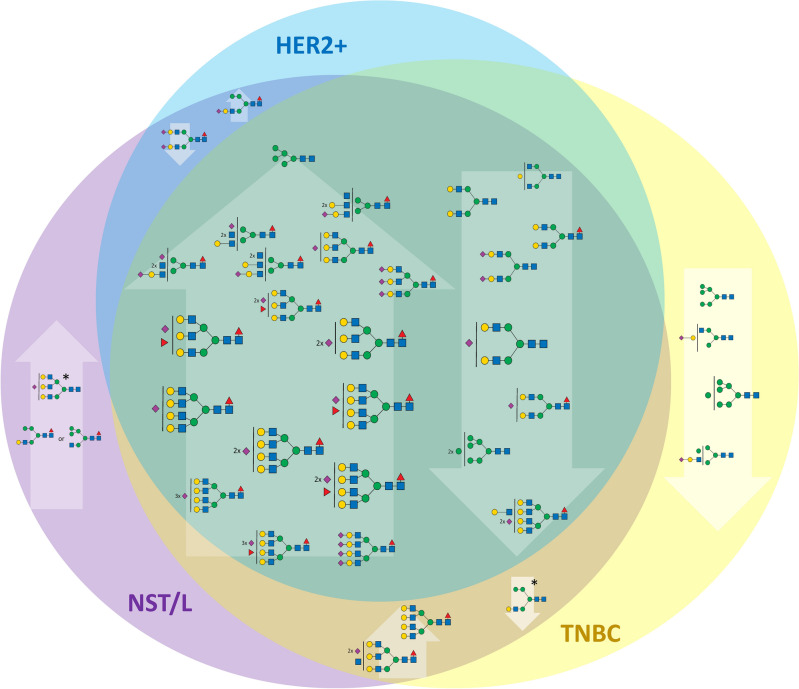
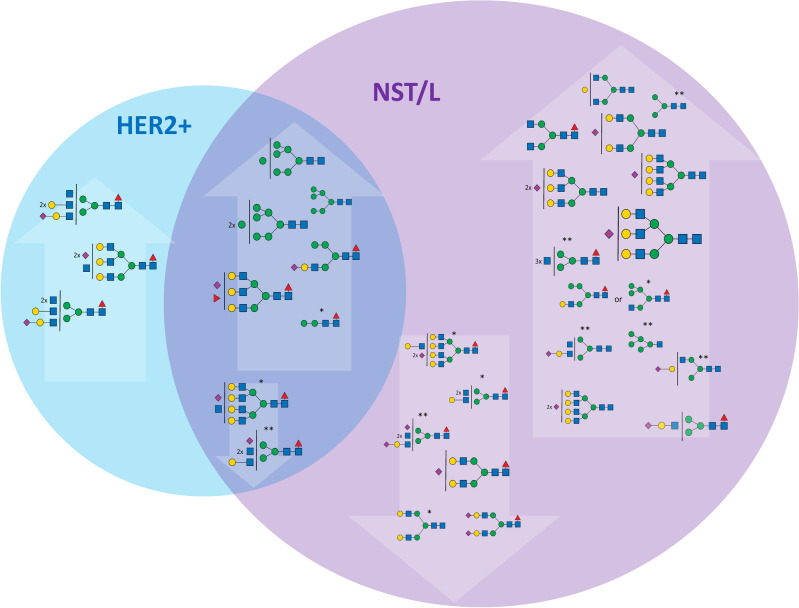
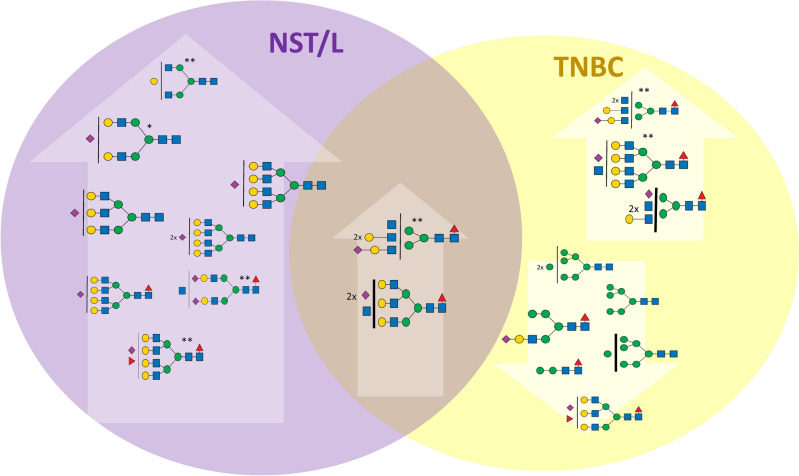
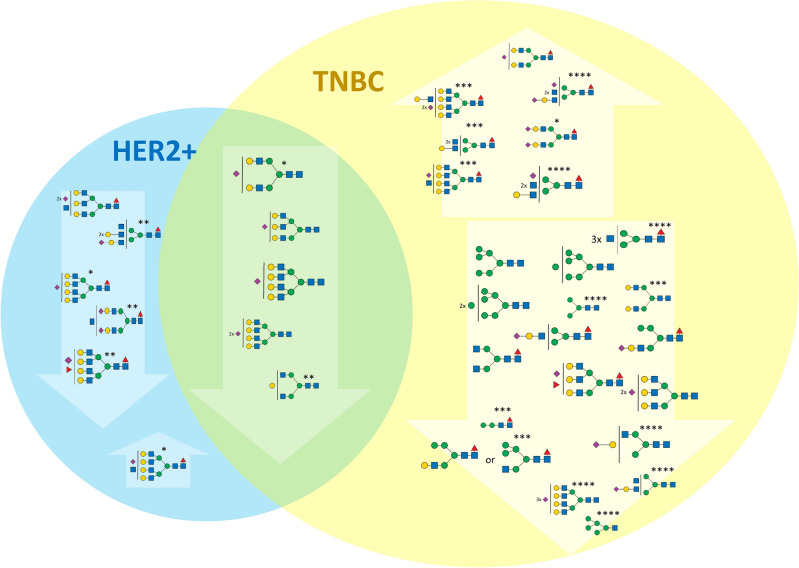
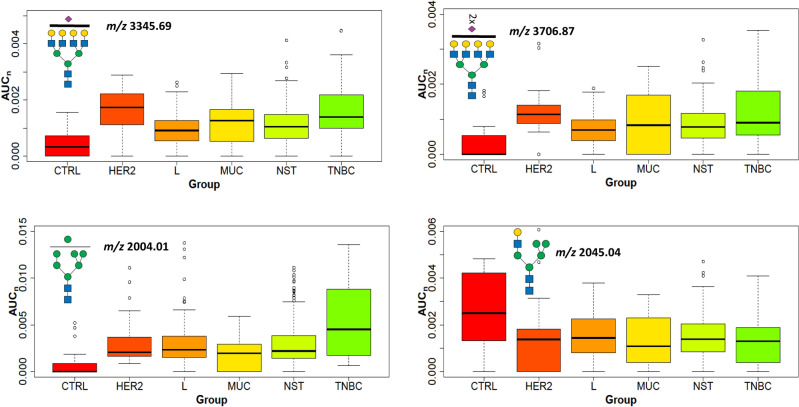
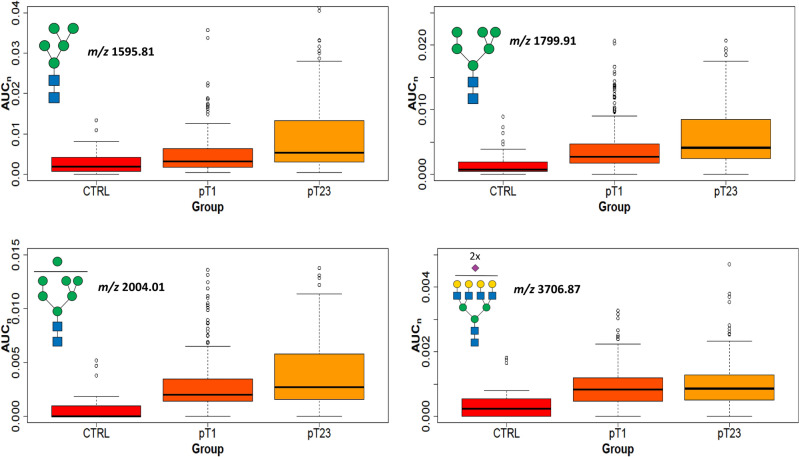
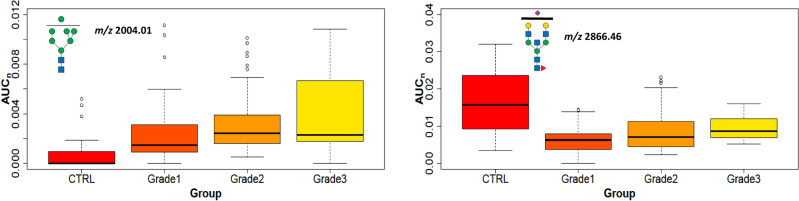
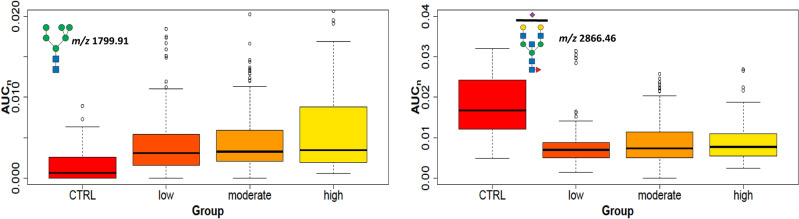
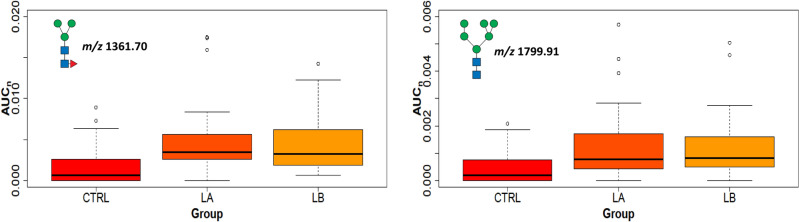
Breast cancer is a highly heterogeneous disease. Its intrinsic subtype classification for diagnosis and choice of therapy traditionally relies on the presence of characteristic receptors. Unfortunately, this classification is often not sufficient for precise prediction of disease prognosis and treatment efficacy. The N-glycan profiles of 145 tumors and 10 healthy breast tissues were determined using Matrix-Assisted Laser Desorption-Ionization Time-of-Flight Mass Spectrometry. The tumor samples were classified into Mucinous, Lobular, No-Special-Type, Human Epidermal Growth Factor 2 + , and Triple-Negative Breast Cancer subtypes. Statistical analysis was conducted using the reproducibility-optimized test statistic software package in R, and the Wilcoxon rank sum test with continuity correction. In total, 92 N-glycans were detected and quantified, with 59 consistently observed in over half of the samples. Significant variations in N-glycan signals were found among subtypes. Mucinous tumor samples exhibited the most distinct changes, with 28 significantly altered N-glycan signals. Increased levels of tri- and tetra-antennary N-glycans were notably present in this subtype. Triple-Negative Breast Cancer showed more N-glycans with additional mannose units, a factor associated with cancer progression. Individual N-glycans differentiated Human Epidermal Growth Factor 2 + , No-Special-Type, and Lobular cancers, whereas lower fucosylation and branching levels were found in N-glycans significantly increased in Luminal subtypes (Lobular and No-Special-Type tumors). Clinically normal breast tissues featured a higher abundance of signals corresponding to N-glycans with bisecting moiety. This research confirms that histologically distinct breast cancer subtypes have a quantitatively unique set of N-glycans linked to clinical parameters like tumor size, proliferative rate, lymphovascular invasion, and metastases to lymph nodes. The presented results provide novel information that N-glycan profiling could accurately classify human breast cancer samples, offer stratification of patients, and ongoing disease monitoring.


Conflict of interest statement

The authors declare no competing interests.

Figures

Figure 1
Figure 1
Distribution of major N-glycan groups in all tissue types. (a) Distribution of N-glycans containing following units of N-acetylglucosamine: (i) N2—two units (corresponding mostly to high-mannose N-glycans), (ii) N3—three units (~ hybrid), (iii) N4—four units (~ biantennary), and (iv) N5 +—five and more units (~ 3- and 4-antennary) in breast cancer subtypes and control tissue samples. (b) Box plots of normalized peak area (AUCn) of representative N-glycans (m/z 3880.95 and 3431.73) in the subgroups.
Figure 2
Figure 2
Changes of the N-glycan signals in MUC subtype. Venn diagram showing the tentative structures corresponding to N-glycan signals elevated (upward arrows) or decreased (downward arrows) in the MUC subtype compared to TNBC, HER2, and NST/L subtypes. The size of the tentative N-glycan structure corresponds to the mean reproducibility-optimized test statistic (ROTS) value for each N-glycan signal.
Figure 3
Figure 3
Changes of the N-glycan signals in TNBC subtype. Venn diagram showing tentative structures corresponding to the significantly elevated N-glycan signals (in arrows pointing up) and decreased (in arrows pointing down) in the TNBC subtype, in comparison to HER2 and NST/L. The tentatively assigned N-glycan structures correspond to the mean ROTS value for each N-glycan signal (* and ** marked N-glycans do not have statistically significant changes in comparison to NST vs TNBC or L vs TNBC, respectively).
Figure 4
Figure 4
Changes of the N-glycan signals in HER2 subtype. Venn diagram showing tentative structures corresponding to the significantly elevated N-glycan signals (in arrows pointing up) and decreased (in arrows pointing down) in the HER2 subtype, in comparison to TNBC and NST/L. The tentatively assigned N-glycan structures correspond to the mean ROTS value for each N-glycan signal (* and ** marked N-glycans do not have statistically significant changes in comparison to NST vs HER2 or L vs HER2, respectively).
Figure 5
Figure 5
Changes of the N-glycan signals in NST subtype. Venn diagram showing tentative structures corresponding to the significantly elevated N-glycan signals (in arrows pointing up) and decreased (in arrows pointing down) in the NST subtype, in comparison to TNBC and HER2 + . The tentatively assigned N-glycan structures correspond to the mean ROTS value for each N-glycan signal (*, **, ***, and **** marked N-glycans do not have statistically significant changes in comparison to NST vs HER2, L vs HER2, NST vs TNBC, and L vs TNBC, respectively).
Figure 6
Figure 6
Changes of the N-glycan signals in controls. Boxplots with the normalized peak area (AUCn) of representative N-glycans decreased (m/z 2045.04) or increased (m/z 3345.69, 3706.87, 2004.01) in cancer tissues compared to control tissues.
Figure 7
Figure 7
Tumor size. Boxplots of normalized peak area (AUCn) of the high-mannose and complex N-glycans (m/z 1595.81, 1799.91, 2004.01, and 3706.87) in tumors (pT1, and pT2 + pT3) compared to control samples (CTRL).
Figure 8
Figure 8
Cancer grade. Boxplots of normalized peak area (AUCn) of the representative statistically significant N-glycans in NST cancer tissue with Grades 1–3 and control tissues.
Figure 9
Figure 9
The proliferation marker Ki67. Boxplots of normalized peak area (AUCn) of representative statistically significant N-glycans in cancer tissues with Ki67 low, moderate, and high levels compared to control tissues.
Figure 10
Figure 10
The intra-subgroup comparison of LA and LB. Boxplots of normalized peak area (AUCn) of the statistically significant high-mannose N-glycans LA and LB tumor tissues compared to control tissues.

References

    1. Sung H, Ferlay J, Siegel RL, Laversanne M, Soerjomataram I, Jemal A, et al. Global cancer statistics 2020: GLOBOCAN estimates of incidence and mortality worldwide for 36 cancers in 185 countries. Ca-Cancer J. Clin. 2021;71(3):209–249. doi: 10.3322/caac.21660. - DOI - PubMed
    1. Stewart SF, Slodkowska-Barabasz J, McGeagh L, Moon Z, Brett J, Wells M, et al. Development of the HT&Me intervention to support women with breast cancer to adhere to adjuvant endocrine therapy and improve quality of life. Breast. 2023;70:32–40. doi: 10.1016/j.breast.2023.05.007. - DOI - PMC - PubMed
    1. Schunemann HJ, Lerda D, Quinn C, Follmann M, Alonso-Coello P, Rossi PG, et al. Breast cancer screening and diagnosis: A synopsis of the European breast guidelines. Ann. Intern. Med. 2020;172(1):46. doi: 10.7326/M19-2125. - DOI - PubMed
    1. Duffy MJ, McDermott EW, Crown J. Blood-based biomarkers in breast cancer: From proteins to circulating tumor cells to circulating tumor DNA. Tumour Biol. 2018;40(5):1010428318776169. doi: 10.1177/1010428318776169. - DOI - PubMed
    1. Perou CM, Sorlie T, Eisen MB, van de Rijn M, Jeffrey SS, Rees CA, et al. Molecular portraits of human breast tumours. Nature. 2000;406(6797):747–752. doi: 10.1038/35021093. - DOI - PubMed

MeSH terms