. 2024 Jan 3;14(1):364.
doi: 10.1038/s41598-023-50548-9.

Characterization, antibacterial, and cytotoxic activities of silver nanoparticles using the whole biofilm layer as a macromolecule in biosynthesis

Affiliations

Characterization, antibacterial, and cytotoxic activities of silver nanoparticles using the whole biofilm layer as a macromolecule in biosynthesis

Aghapy Yermans Yakoup et al. Sci Rep. .

Abstract

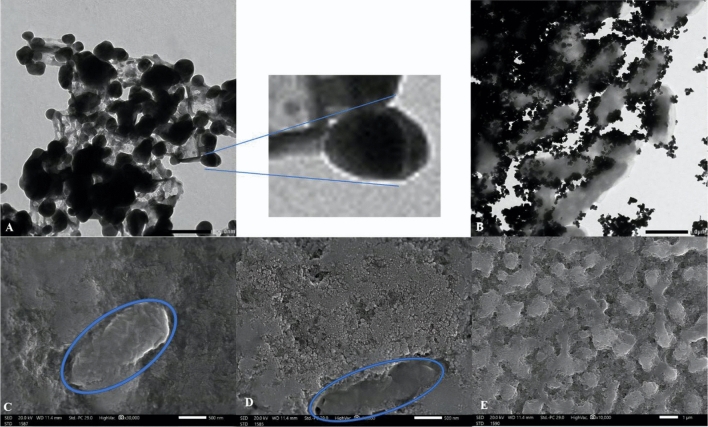
Recently, multi-drug resistant (MDR) bacteria are responsible for a large number of infectious diseases that can be life-threatening. Globally, new approaches are targeted to solve this essential issue. This study aims to discover novel antibiotic alternatives by using the whole components of the biofilm layer as a macromolecule to synthesize silver nanoparticles (AgNPs) as a promising agent against MDR. In particular, the biosynthesized biofilm-AgNPs were characterized using UV-Vis spectroscopy, electron microscopes, Energy Dispersive X-ray (EDX), zeta sizer and potential while their effect on bacterial strains and normal cell lines was identified. Accordingly, biofilm-AgNPs have a lavender-colored solution, spherical shape, with a size range of 20-60 nm. Notably, they have inhibitory effects when used on various bacterial strains with concentrations ranging between 12.5 and 25 µg/mL. In addition, they have an effective synergistic effect when combined with phage ZCSE9 to inhibit and kill Salmonella enterica with a concentration of 3.1 µg/mL. In conclusion, this work presents a novel biosynthesis preparation of AgNPs using biofilm for antibacterial purposes to reduce the possible toxicity by reducing the MICs using phage ZCSE9.


Conflict of interest statement

The authors declare that they have no known competing financial interests or personal relationships that could have appeared to influence the work reported in this paper.

Figures

Figure 1
Figure 1
Illustrates the preparation steps (1) the preparation of biofilm layers for (2) the biosynthesis of biofilm-AgNPs.
Figure 2
Figure 2
Shows (A) the final color of biosynthesized biofilm-AgNPs and (B) the UV-Vis visible spectra of biofilm-AgNPs and biofilm layers, (C) the FTIR for biofilm-AgNPs and biofilm layers.
Figure 3
Figure 3
Illustrates TEM images of spherical AgNPs attached to ghost P. aeruginosa, where (A) shows the spherical structure of the formed NPs with a scale bar of 100 nm, and (B) shows its combination with the bacterial ghost with a scale bar of 1 µm. Moreover, SEM images of biofilm-AgNPs after their biosynthesis in combination with the bacterial ghosts in blue circles where (C), (D) with a scale bar of 500 nm, and (E) with a scale bar of 1 µm.
Figure 4
Figure 4
Shows (A) EDX spectrum analysis of biofilm-AgNPs, (B) Zeta sizer of AgNPs with two peaks, and (C) Zeta potential equal to − 19.1 mV.
Figure 5
Figure 5
Shows the effect of biofilm-AgNPs when tested on several bacterial strains where (A and B) for Bacillus cereus, (C and D) for E. coli, (E and F) for P. aeruginosa, (G and H) for S. aureus, (I and J) for S. enterica and (K and L) for negative controls.
Figure 6
Figure 6
Shows the effect of positive control (silver nitrate) when tested on the same bacterial strains where (A and B) for Bacillus cereus, (C and D) for E. coli, (E and F) for P. aeruginosa, (G and H) for S. aureus, (I and J) for S. enterica.
Figure 7
Figure 7
Illustrates time-killing curves of the used bacterial strains to detect their growth rate under the effect of biofilm-AgNPs where (A) is Bacillus cereus graph, (B) is E. coli graph, (C) is P. aeruginosa graph, and (D) is S. aureus graph.
Figure 8
Figure 8
Illustrates a heat map for the selected bacterial strains that indicates their growth under the effect of biofilm-AgNPs where the golden yellow color indicates low concentration while the red color indicates high concentration. (A) is Bacillus cereus, (B) is E. coli, (C) is P. aeruginosa, and (D) is S. aureus. The numbers 1, 2, 3, 4 & 5 represents the concentrations of biofilm-AgNPs 25, 12.5, 6.3, 3.1 and 1.6 µg/mL, respectively, and (B) is the bacteria without any treatment. The heatmap was created using Microsoft Excel Spreadsheet.
Figure 9
Figure 9
Illustrates time killing curves S. enterica to detect its growth rate under the effect of biofilm-AgNPs with and without the presence of ZCSE9 where A is the NP with concentration 3.1 µg/mL, B is the NP with concentration 6.3 µg/mL, and C is the NP with concentration 12.5 µg/mL.
Figure 10
Figure 10
Illustrates heat maps for the selected bacterial strains that indicate their growth under the effect of biofilm-AgNPs, where the golden yellow color indicates low concentration, and the red color indicates high concentration. (A) is S. enterica with the NPs alone, while (B) is S. enterica with the NPs in combination with ZCSE9. The numbers 1, 2, 3, 4 and 5 represent the concentrations of biofilm-AgNPs 25, 12.5, 6.3, 3.1 and 1.6 µg/mL, respectively. (B) is the bacteria without any treatment, and (Φ) is ZCSE9. The heatmap was created using Microsoft Excel Spreadsheet.
Figure 11
Figure 11
Illustrates that using biofilm-AgNPs with 0.5 × MIC concentration with ZCSE9 towards S. enterica leads to disruption in the cell membrane, and the intracellular components come out of the cell as shown in the blue circles and arrow where the scale bar of (A), (B), and (C) was at 200 nm while (D) was at 500 nm.
Figure 12
Figure 12
Represents the cytotoxicity of biofilm-AgNPs on the HSF cell line at various concentrations after exposure.
Figure 13
Figure 13
Shows the colorimetric change after using the MTT assay lanes containing (A) S. aureus, (B) E. coli, (C) S. Typhimurium, (D) S. enterica, (E) S. enterica+ZCSE9, (F) Bacillus cereus, and (G) P. aeruginosa. In addition, the rows from 1 to 8 contain biofilm-AgNPs with concentrations from (100, 50, 25, 12.5, 6.25, 3.1, 1.6 and 0.8 µg/mL), respectively.
Figure 14
Figure 14
Shows the cytotoxicity effect of biofilm-AgNPs with various concentrations where (A) is MCF7 and (B) is HEPG2 cell lines. The results represent the means of two biological replicates, three replicates each, and the error bars represent the standard error of the mean.

References

    1. Nicolaou KC, Rigol S. A brief history of antibiotics and select advances in their synthesis. J. Antibiot. 2018;71:153–184. doi: 10.1038/ja.2017.62. - DOI - PubMed
    1. Gaynes R. The discovery of penicillin—new insights after more than 75 years of clinical use. Emerg. Infect. Dis. 2017;23:849. doi: 10.3201/eid2305.161556. - DOI
    1. Chokshi A, Sifri Z, Cennimo D, Horng H. Global contributors to antibiotic resistance. J. Glob. Infect. Dis. 2019;11:36. doi: 10.4103/jgid.jgid_110_18. - DOI - PMC - PubMed
    1. Schulz F, et al. Towards a balanced view of the bacterial tree of life. Microbiome. 2017;5:1–6. - PMC - PubMed
    1. MacGowan A, Macnaughton E. Antibiotic resistance. Medicine. 2017;45:622–628. doi: 10.1016/j.mpmed.2017.07.006. - DOI

MeSH terms