. 2024 Feb;25(2):282-293.
doi: 10.1038/s41590-023-01691-y. Epub 2024 Jan 3.

GIMAP5 deficiency reveals a mammalian ceramide-driven longevity assurance pathway

Ann Y Park #  1   2 Michael Leney-Greene #  1   2   3 Matthew Lynberg  1   2 Justin Q Gabrielski  1   2 Xijin Xu  1   2 Benjamin Schwarz  4 Lixin Zheng  1   2 Arasu Balasubramaniyam  1   2   5 Hyoungjun Ham  2   3 Brittany Chao  1   2 Yu Zhang  2   3 Helen F Matthews  1   2 Jing Cui  1   2 Yikun Yao  1   2 Satoshi Kubo  1   2 Jean Michel Chanchu  1   2 Aaron R Morawski  1   2 Sarah A Cook  1   2 Ping Jiang  1   2 Juan C Ravell  1   2   6 Yan H Cheng  1   2 Alex George  1   2 Aiman Faruqi  1   2 Alison M Pagalilauan  1   2 Jenna R E Bergerson  3 Sundar Ganesan  7 Samuel D Chauvin  1   2 Jahnavi Aluri  1   2 Joy Edwards-Hicks  8 Eric Bohrnsen  4 Caroline Tippett  9   10 Habib Omar  1   2 Leilei Xu  1   2 Geoffrey W Butcher  11 John Pascall  11 Elif Karakoc-Aydiner  12   13 Ayca Kiykim  12 Holden Maecker  14 İlhan Tezcan  15 Saliha Esenboga  15 Raul Jimenez Heredia  16   17   18 Deniz Akata  19 Saban Tekin  20 Altan Kara  21 Zarife Kuloglu  22 Emel Unal  23 Tanıl Kendirli  24 Figen Dogu  25 Esra Karabiber  26 T Prescott Atkinson  27 Claude Cochet  28 Odile Filhol  28 Catherine M Bosio  4 Mark M Davis  29 Richard P Lifton  30   31 Erika L Pearce  8   32 Oliver Daumke  5   33 Caner Aytekin  34 Gülseren Evirgen Şahin  35 Aysel Ünlüsoy Aksu  35 Gulbu Uzel  3 V Koneti Rao  3 Sinan Sari  36 Buket Dalgıç  36 Kaan Boztug  16   17   18   37   38 Deniz Cagdas  15 Sule Haskologlu  25 Aydan Ikinciogullari  25 David Schwefel  5   33   39 Silvia Vilarinho  9   10 Safa Baris  12   13 Ahmet Ozen  12   13 Helen C Su  2   3 Michael J Lenardo  40   41
Affiliations

GIMAP5 deficiency reveals a mammalian ceramide-driven longevity assurance pathway

Ann Y Park et al. Nat Immunol. 2024 Feb.

Erratum in

  • Author Correction: GIMAP5 deficiency reveals a mammalian ceramide-driven longevity assurance pathway.
    Park AY, Leney-Greene M, Lynberg M, Gabrielski JQ, Xu X, Schwarz B, Zheng L, Balasubramaniyam A, Ham H, Chao B, Zhang Y, Matthews HF, Cui J, Yao Y, Kubo S, Chanchu JM, Morawski AR, Cook SA, Jiang P, Ravell JC, Cheng YH, George A, Faruqi A, Pagalilauan AM, Bergerson JRE, Ganesan S, Chauvin SD, Aluri J, Edwards-Hicks J, Bohrnsen E, Tippett C, Omar H, Xu L, Butcher GW, Pascall J, Karakoc-Aydiner E, Kiykim A, Maecker H, Tezcan İ, Esenboga S, Heredia RJ, Akata D, Tekin S, Kara A, Kuloglu Z, Unal E, Kendirli T, Dogu F, Karabiber E, Atkinson TP, Cochet C, Filhol O, Bosio CM, Davis MM, Lifton RP, Pearce EL, Daumke O, Aytekin C, Şahin GE, Aksu AÜ, Uzel G, Koneti Rao V, Sari S, Dalgıç B, Boztug K, Cagdas D, Haskologlu S, Ikinciogullari A, Schwefel D, Vilarinho S, Baris S, Ozen A, Su HC, Lenardo MJ. Park AY, et al. Nat Immunol. 2024 Apr;25(4):717. doi: 10.1038/s41590-024-01779-z. Nat Immunol. 2024. PMID: 38347083 No abstract available.

Abstract

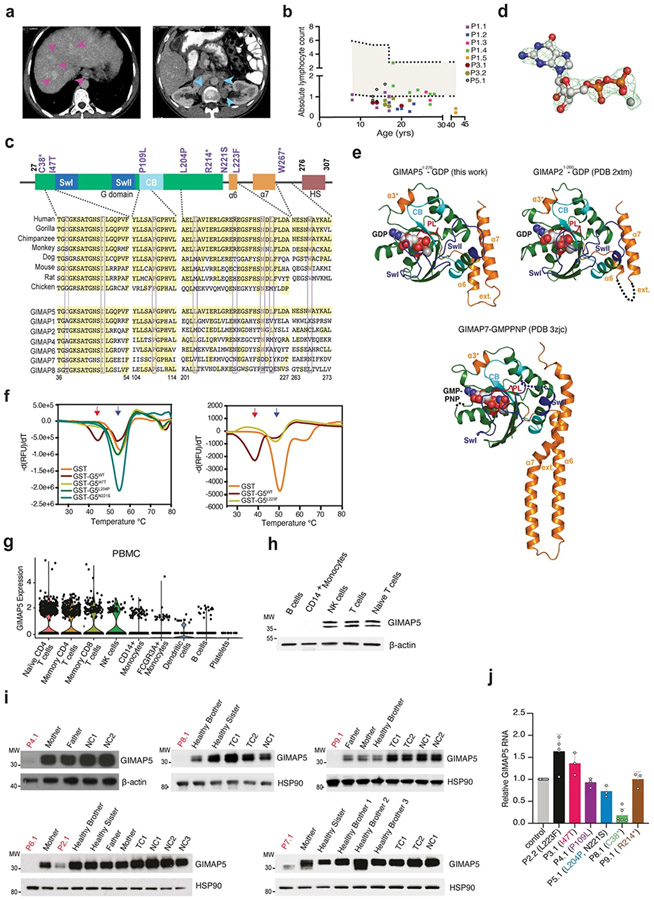
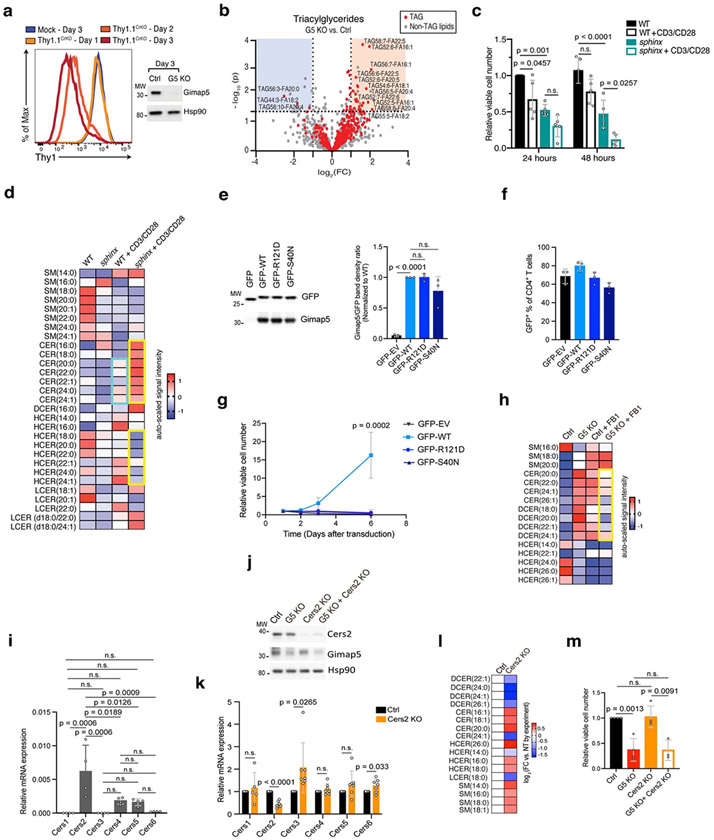
Preserving cells in a functional, non-senescent state is a major goal for extending human healthspans. Model organisms reveal that longevity and senescence are genetically controlled, but how genes control longevity in different mammalian tissues is unknown. Here, we report a new human genetic disease that causes cell senescence, liver and immune dysfunction, and early mortality that results from deficiency of GIMAP5, an evolutionarily conserved GTPase selectively expressed in lymphocytes and endothelial cells. We show that GIMAP5 restricts the pathological accumulation of long-chain ceramides (CERs), thereby regulating longevity. GIMAP5 controls CER abundance by interacting with protein kinase CK2 (CK2), attenuating its ability to activate CER synthases. Inhibition of CK2 and CER synthase rescues GIMAP5-deficient T cells by preventing CER overaccumulation and cell deterioration. Thus, GIMAP5 controls longevity assurance pathways crucial for immune function and healthspan in mammals.


Figures

Extended Data Fig 1 ∣
Extended Data Fig 1 ∣. GIMAP5 mutations cause protein destabilization in patients’T cells.
a, Computerized tomography scan of P7.1 showing liver nodules (left, magenta arrowheads) and esophageal varices (right, cyan arrowheads) suggesting liver failure. b. Absolute lymphocyte counts versus patient age (years, yrs), shaded area representing 95% confidence interval for normal range. c. Patient amino acid substitutions on GIMAP5 protein schematic (top). GTPase (G) domain: green; switch I (SwI) and switch II (SwII): blue; conserved box (CB): cyan; alpha helices (α) 6 and 7: orange; hydrophobic segment: maroon. Amino acid alignment in GIMAP5 orthologues and 7 human paralogues (bottom). Mutations marked in purple and boxed. d. Omit Fo-Fc density map for GDP and the Mg2+ ion bound to GIMAP51-276, contoured at 3σ (green). The refined GDP•Mg2+ molecules shown in ball-and-stick. e, Comparison of GIMAP51-276-GDP (left), GIMAP21-260-GDP (middle, PDB code 2xto), and GIMAP7 L100Q-GMPPNP (right, PDB code 3zjc).G domains: green; switch I (SwI) and switch II (SwII): purple; P-loops (PL): red; conserved box(CB): cyan; nucleotides: space-filling spheres; secondary structure elements differing from the core G domain of H-Ras, helices α3* and the C-terminal helices α6 and α7 (C-terminal extension, ext.): orange; unstructured loops; dotted lines. Root mean square deviation of aligned Cα atoms: 1.4 Å (GIMAP5 vs. GIMAP2) and 2.0 Å (GIMAP5 vs. GIMAP7). f, Thermal denaturation profiles. GST-WT GIMAP51-276 displayed two temperature transitions - GIMAP51-276 unfolding (red arrow) and GST unfolding (blue arrow). GST-GIMAP51-276 variants (left: I47T, L204P and N221S; right: L223F) showed a single transition, representing GST unfolding, with no WT GIMAP51-276 transition. Left and right experiments were conducted in separate laboratories. g. Single-cell GIMAP5 RNA expression in human peripheral blood mononuclear cells (PBMCs). h, Immunoblots of GIMAP5 in primary human CD19+ B cells, CD14+ monocytes, CD56+ NK cells, and T cells with β-actin loading control (n = 3). i, Immunoblots of GIMAP5 from patients (P), family, normal control (NC) or shipping control (TC) T cell lysates with a b-actin or an HSP90 loading control (n = 3). j, GIMAP5 RNA expression by RT-qPCR in patients (n = 6) and controls (n = 6) normalized to 18S. Samples were examined over at least 3 independent experiments (mean ± s.d.).
Extended Data Fig 2 ∣
Extended Data Fig 2 ∣. GIMAP5 deficiency induces senescence in human T cells.
a, CyTOF mass cytometry from patient (P1.3, P1.4) or control (n = 8) PBMCs. NK = natural killer; TEM = T effector memory; TEMRA = Terminally differentiated effector memory; TCM = T central memory. b, Percent of patient (red, n = 11) and control (black, CD4+: n = 16, CD8+: n = 17) naive T cells against age in years. Simple linear regression of control data (black line). c, Phenotyping CyTOF, depicting relative CD57 levels as in (a). d, Percent of CD4+CD57+ T cells. Controls (n = 42), Patients (n = 11). e, MFI of SA-β-gal activity in CD4+ T cells. Controls (n= 16), patients (n = 8). f-i, Percent of KLRG1+ (f, controls: n = 24, patients: n = 11), CD27+ (g, controls: n = 30, patients: n = 11), CD28+ (h, controls: n = 28, patients: n = 11), and PD1+ (i, controls: n = 32, patients: n = 11) in T cells. j, Telomere length in kilobases (kb) against age in years (yrs) for P1.3 and P1.4 lymphocytes. Colored lines indicate percentile isobars. k, l, Percent of CD25 (k) or CD69 (l) on T cells 24 hours post-activation. Controls (n = 15), patients (n = 7). m, Proliferation via CellTrace Violet dilution in T cells (3 days post-activation, left two panels). Normal controls (NC), Shipping controls (TC). % divide quantified (right two panels). Controls (n = 15), patients (n = 6). n, DNA content in Ctrl or G5 KO human T cells on day 16 post-electroporation (upper). Percent of Ctrl and G5 KO T cells in the indicated phases (bottom). Red arrowhead indicates G2/M population (n = 5). o, Percent of viable G5 KO or Ctrl human T cells over time post-electroporation (n = 6 per group). p, Percent of CD25 (left) and CD69 (right) on G5 KO or Ctrl human naïve T cells 24 hours after CD3/CD28 Dynabeads activation, 5 days post-electroporation (n = 5 per group). All data are mean ± s.d. and were analyzed by two-tailed, unpaired Student’s t-test (b,f). n.s. = not significant. p < 0.0001: in n, p = 2.11 × 10⁻⁵.
Extended Data Fig 3 ∣
Extended Data Fig 3 ∣. Gimap5 deficiency in mice induces a partial senescence phenotype in lung endothelial cells (ECs).
a, Immunoblots of heart, kidney, and brain tissue lysates from sphinx (Gimap5sph/sph), Het (Gimap5+/sph) and WT (wild-type) mice for Gimap5, p21 and Hsp90. Representative immunoblots from two independent experiments are shown. Littermate controls (n = 8), sphinx (n = 7). Note that bands detected in Gimap5 brain tissue immunoblot are unaffected by sphinx mutation, implying background signals. b, MFI of p21, p53, p16 and SA-β-gal activity in CD45CD31+ lung ECs from young mice (littermate controls), sphinx, and aged mice. CD45CD31+ p21: young mice (n = 14), sphinx (n = 11), aged mice (n = 10); CD45CD31+ p53: young mice (n = 15), sphinx (n = 10), aged mice (n = 10); CD45CD31+ p16: young mice (n = 21), sphinx (n = 11), aged mice (n = 10); CD45CD31+ SA-β-gal: young mice (n = 8), sphinx (n = 3), aged mice (n = 10). 7- to 12-week-old (young, sphinx) or 16 to 19-month-old (aged) male and female mice were used in each experiment. All data are mean ± s.d. and were analyzed by two-tailed, unpaired Student’s t-test (b). n.s. = not significant. p < 0.0001: in b (left to right), p = 3.49 × 10⁻⁵, p = 1.89 × 10⁻⁵, p = 4.23 × 10⁻⁶.
Extended Data Fig 4 ∣
Extended Data Fig 4 ∣. GIMAP5 controls the levels of CER and TAG.
a, Thy1.1 levels in murine T cells post-electroporation (left). Immunoblot of indicated proteins from left (day 3 post-electroporation, right)(n = 5). b, Volcano plot of lipids in G5 KO murine T cells vs. Ctrl, day 3 post-electroporation. Triacylglyceride (TAG) species, red (n = 5). c, Viable CD4+ T cell numbers from WT or Gimap5sph/sph (sphinx) mice with IL-7 (unstimulated) or stimulated with anti-CD3/CD28 antibodies, relative to unstimulated WT (n = 4). d, SPL heat map of 24-hour samples from (c), key changes in cyan or yellow boxes (FDR ≤ 0.05) (n = 5). e, Immunoblots of NIH-3T3 cells following indicated transductions (left)(n = 3 per group). f, Percent of GFP+CD4+ T cells, day 2 post-transduction in Gimap5sph/sph CD4+ T cells (n = 3 per group). g, Relative viable cell numbers in GFP+CD4+ T cells from (f) over time (n = 3 per group). h, SPL heat map of Ctrl and G5 KO murine T cells from Fig.4f, day 3 post-electroporation. Only significant SPLs from Fig. 4e are displayed (p ≤ 0.05) (n = 5). i, Murine T cell Cers relative mRNA expression (RT-qPCR, normalized to Gapdh)(n = 4 per group). j, Immunoblots of indicated proteins in indicated murine KO T cells, day 3 post-electroporation (n = 3). k, Relative mRNA expression of Cers1-6, in Ctrl and Cers2 KO murine T cells, day 3 post-electroporation (RT-qPCR, normalized to Ctrl KO)(Cers1: n = 5 per group, Cers2-6: n = 7 per group). l, SPL heat map of Ctrl and Cers2 KO murine T cells, p values < 0.1, all samples normalized to Ctrl (n = 3). m, Relative viable cell numbers of murine T cell blasts from (j) (Ctrl, G5 KO, Cers2 KO: n = 4, G5 KO + Cers2 KO: n = 3). All data are mean ± s.d. and were analyzed by two-tailed, unpaired Student’s t-test (b,h,g,k,l,m) or by two-way ANOVA with Bonferroni post-test (c,e,i). n.s. = not significant. p < 0.0001: in c, p = 7.33 × 10⁻⁶, in e (left to right), p = 3.42 × 10⁻⁵, p = 3.39 × 10⁻⁵, in k, p = 1.19 × 10⁻⁷.
Extended Data Fig 5 ∣
Extended Data Fig 5 ∣. GIMAP5 controls the levels of CER, thereby regulating cell survival or cell senescence.
a, Relative viable cell number of Ctrl and G5 KO murine T cell blasts treated with 200 μM conduritol-β-epoxide (CBE), starting on day 1 post-electroporation, measured on day 3 post-electroporation (n = 3 per group). b, Heat map of SPLs detected in (a) using the z scale indicated. Only SPLs found to be significantly affected in Fig. 4e are displayed (p ≤ 0.05) (n =3). c, Relative viable cell number of Ctrl and G5 KO murine T cell blasts treated with zVAD (20 μM), necrostatin-1 (Nec-1, 20 μM), ferrostatin-1 (Fer-1, 3 μM) or liproxstatin-1 (Lip-1, 3 μM) on day 1 and quantified on day 3 post-electroporation (n = 3 per group). d, Heat map of SPLs detected in P1.4, healthy family members, normal controls (NC) or shipping controls (TC). Hits on the heatmaps are >1 standard deviation from the mean (>1 z-score) (n = 3). e, Immunoblots of Ctrl or G5 KO human T cell lysates treated with FB1 (10 μM, 24 hr) for proteins shown (left). WCLs were collected as in Fig. 2i. Quantified left panel bands with ImageJ (right). Bands normalized to HSP90, and relative intensities presented as Ctrl vs. each sample (n = 3 per group). f, Immunoblot analysis of p21 and Gimap5, with Hsp90 loading control, in Ctrl or G5 KO murine T cells on day 2, 3, and 4 post-electroporation (left). Quantification of p21 and Gimap5 band intensities from left panel using ImageJ (center and right). Bands of interest, normalized to Hsp90, show relative intensities compared to Ctrl (day 2 post-electroporation) for each sample (n = 3 per group). All data are mean ± s.d. and were analyzed by two-tailed, unpaired Student’s t-test (a,b,f) or by two-way ANOVA with Bonferroni post-test (c,e). n.s. = not significant. p < 0.0001: in c (left to right), p = 4.35 × 10⁻¹¹, p = 4.35 × 10⁻¹¹, p = 2.25 × 10⁻⁹, p = 2.25 × 10⁻⁹, in e (left to right), p = 5.46 × 10⁻⁵, p = 1.89 × 10⁻⁵.
Extended Data Fig 6 ∣
Extended Data Fig 6 ∣. GIMAP5 interacts with CK2 and LCK.
a, HEK293T cells were transfected with tagged plasmids expressing GFP-Flag, GIMAP5-Flag, CK2A1-HA, CK2A2-HA or CK2B-Myc, as indicated by a plus sign. Cell lysates were prepared 24 hours post transfection (Input), immunoprecipitated (IP) for Flag tag, and immunoblotted with the indicated antibodies (n = 3). b, Schematic diagram illustrating GIMAP5 full-length (FL), GIMAP5 N-terminal 219-amino-acid (G domain) truncated mutant (GIMAP5 NΔ), and GIMAP5 C-terminal 30-amino-acid (hydrophobic domain) truncated mutant (GIMAP5 CΔ). c, HEK293T cells were transiently transfected with Flag, Flag-GIMAP5 FL, Flag-GIMAP5 NΔ, Flag-GIMAP5 CΔ, or HA-CK2A1, as indicated by a plus sign. Cell lysates were prepared 24 hours post transfection (Input), immunoprecipitated (IP) for Flag tag, and immunoblotted with Flag and HA antibodies (n = 3). d, Immunoblots of p21, pERK (phospho-ERK1/2), and GIMAP5 with an HSP90 loading control. Cell lysates were collected from human T cell blasts with or without CERS inhibitor, FB1 (20 μM) pretreatment (1 hr) followed by TCR stimulation for the indicated times in minutes (mins) (n = 3). Note that the variable GIMAP5 expression levels were not detected in other repeats. e, Confocal microscopy of GIMAP5 + CK2α (top) in PLA after TCR stimulation as in Fig.5b. PLA signals were quantified by flow cytometry (bottom left) and by the number of PLA dots per cell (bottom right) (3 biological replicates; Isotype: n = 381 from 14 images; 0: n = 390 from 14 images; 15 mins: n = 395 from 17 images; 30 mins: n = 487 from 17 images; 45 mins: n = 491 from 14 images). f, Immunoprecipitation (IP) with anti-GIMAP5 or isotype control in human T cell blasts after TCR stimulation for multiple timepoints measured in minutes (mins)(n = 6). Two-tailed, unpaired Student’s t-test (f; mean ± s.d.). n.s. = not significant. p < 0.0001: in e, p = 4.75 × 10⁻⁶.
Extended Data Fig 7 ∣
Extended Data Fig 7 ∣. GIMAP5 colocalizes with CK2α and LCK after TCR stimulation at the late endosome/lysosome.
a, immunofluorescence staining with LAMP1, Rab7, LAMTOR4, Calnexin or MitoTracker (magenta) and GiMAP5 (green) in human T cell blasts (left). Colocalization of indicated markers by Pearson’s correlation coefficient (PCC) (right). n (left to right): 485, 907, 566, 507, 412. b, immunofluorescence staining with anti-LCK (green), GiMAP5 (magenta), and Rab7 (yellow) in human T cell blasts before and after TCR stimulation (60 mins) (left). Colocalization of indicated markers before and after TCR stimulation by PCC (right). n (left to right): 2664, 3071, 2751, 2388, 1419, 1570, 1411, 1181, 1419, 1570, 1411, 1181. c, Colocalization of CK2α with LCK, GiMAP5, Calnexin, Rab7, and LAMTOR4 and Rab7 with Calnexin before and after TCR stimulation by PCC. n (left to right): 2226, 2382, 2191, 2042, 1426, 1716, 1521, 1377, 2502, 2387, 2484, 2139, 1865, 1599, 2118, 1625, 1653, 2000, 2091, 1501, 1630, 1473, 1219, 1361. d, immunofluorescence staining with anti-CK2α (yellow), Calnexin (green), and Rab7 (magenta) in human T cell blasts before and after TCR stimulation (60 mins). e, immunofluorescence staining with anti-CK2α (yellow), LAMTOR4 (green), and Calnexin (magenta) in human T cell blasts after TCR stimulation (60 mins). Representative of at least three biological replicates (a,b,d,e). All data are mean ± s.d. and were analyzed by two-tailed, unpaired Student’s t-test (a,c) or by two-way ANOVA with Bonferroni post-test (b). n.s. = not significant. p < 0.0001: in a (left to right), p = 8.41 × 10⁻⁵, p = 5.62 × 10⁻⁶, in b, p = 1.68 × 10⁻⁶.
Extended Data Fig 8 ∣
Extended Data Fig 8 ∣. GIMAP5 controls the levels of CER and TAG through its association with CK2 without affecting the level of CK2.
a, immunoprecipitation with anti-Ck2α or isotype control In control or G5 KO murine T cell blasts after TCR stimulation (n = 3). b, Immunoblots of T cell lysates from patients, family members, and healthy donors (NC = normal control, TC = shipping control) for the indicated proteins (left). Whole cell lysates (WCL) were collected between 7 to 15 days post-activation. Quantified left panels with ImageJ (right, Ctrl: n = 12; patient: n = 6). Bands normalized to HSP90. c, Immunoblots of Ctrl or G5 KO human T cells for the indicated proteins (left). WCLs from human T cell blasts were collected 16 days post-activation. Quantified left bands with ImageJ (right). Bands normalized to HSP90 (n = 4 per group). d, Immunoblots of Ctrl or G5 KO murine T cells for the indicated proteins (left). WCLs from murine T cell blasts were collected on days 2, 3, and 4 post-electroporation. Quantified bands from 3 days post-electroporation samples using ImageJ (right). Bands normalized to Hsp90 (n = 6 per group). e, Signal intensity of TAG species in Ctrl and G5 KO murine T cell blasts, 3 days post-electroporation, treated with 2.5 μM CK2 inhibitor CX-4945 on day 1 post-electroporation. Only significant TAGs from Extended Data Fig. 4b are shown (p ≤ 0.05). Key changes in yellow boxes. Signal levels reflect the total sum normalized and auto-scaled (n = 5). f, Quantified Fig. 5j bands with ImageJ, normalized to HSP90 bands, and presented relative intensities compared to Ctrl (untreated) for each sample (n = 4 per group). g, Immunoblots of cell lysates for proteins shown. WCLs were collected after CX-4945 or dimethylsulfoxide (DMSO) vehicle pretreatment (1 hr) followed by TCR stimulation. (n = 4). All data are mean ± s.d. and were analyzed by two-tailed, unpaired Student’s t-test (b-e) or by two-way ANOVA with Bonferroni post-test (f). n.s. = not significant. p < 0.0001: in c, p = 5.99 × 10⁻⁶, in d, p = 3.64 × 10⁻⁵, in f (left to right), p = 1.11 × 10⁻⁸, p = 5.10 × 10⁻⁸.
Extended Data Fig 9 ∣
Extended Data Fig 9 ∣. Lack of senescence induction in T cells by C6-ceramide.
a-d, Quantification of intracellular staining of SA-β-gal activity (CellEvent senescence green probe)(a, n = 3 per each group), p21 (b, day 3: n= 6, day 7: n = 3, day 10: n = 3), p53 (c, day 3: n = 6, day 7: n = 3, day 10: n = 3), and p16 (d, day 3: n= 6, day 7: n = 3, day 10: n = 3) in human T cell blasts with or without C6-Ceramide (C6-CER) treatment at days 3, 7, and 10 post-treatment. Mean and standard deviation of mean fluorescence intensity (MFI) is shown. e, Flow cytometry analysis of live/dead staining on human T cell blasts with or without C6-CER treatment for 3 days. f, Quantification of the live percentage by gating on the negative population of the live/dead staining as in (e). T cell blasts from healthy donors were treated for 3 days (n = 6), 7 days (n = 3), and 10 days (n = 3) at 0, 1, 3, and 10 mM (for 3 days) of C6-CER. All data are mean ± s.d. and were analyzed by two-tailed, unpaired Student’s t-test (a-d, f). n.s. = not significant.
Extended Data Fig 10 ∣
Extended Data Fig 10 ∣. A model of GIMAP5 regulating CER levels through CK2 following TCR stimulation.
Upon TCR stimulation, the interaction of GIMAP5, CK2, and LCK rapidly increases. CK2 then dissociates from GIMAP5 and LCK when LCK-containing endosomes are transported to the plasma membrane. Following dissociation from GIMAP5 and LCK, CK2 interacts with and activates CERS thereby generating CER following TCR stimulation (left). GIMAP5 deficiency in T cells results in constitutive and sustained CK2-CERS association leading to the accumulation of CER which induces T cell death or T cell senescence through the upregulation of p21 and p53 (right).
Fig. 1 ∣
Fig. 1 ∣. New human immune disease caused by loss-of-function GIMAP5 mutations.
a, Patient (P) pedigrees showing GIMAP5 amino acid substitutions. Asterisk (*) indicates stop-gain; red strikethrough, deceased; double line, consanguinity. Same-sex siblings enumerated 2x, etc. b, Computerized tomography (CT) scan of P5.1. Enlarged lymph nodes as highlighted in red and enlarged spleen indicated by white arrowheads. c, P1.2 chest CT showing bronchiectasis (white arrowheads) and lung consolidation due to acute infection (red arrowheads). d, Abdominal CT of P4.1 showing splenomegaly (yellow arrowheads), heterogenous liver parenchyma (white box) and dilated portal vein branches (red arrowheads). e, GIMAP5 protein domains; GTPase domain, switch I (SwI) and switch II (SwII) (blue), the P-loop (PL) (red), the conserved box (CB) (cyan) and GIMAP-specific elements: alpha helices (α) α3*, α6 and α7 (orange) and the hydrophobic segment (HS, maroon) (top). Crystal structure of GDP-bound GIMAP51–276 (bottom). Boxes show amino acids mutated in patients. f, Summary of normalized expression (nTPM) of GIMAP5 mRNA from different single-cell types from the Human Protein Atlas. g, GIMAP5 protein immunoblots of P versus normal control (NC) T cells compared to GIMAP1, 2, 4, 5, 6, 7 and 8 proteins and β-tubulin control (n = 3). GIMAP5 has two isoforms in human cells that are undiscernible in the overexposed blot.
Fig. 2 ∣
Fig. 2 ∣. GIMAP5 deficiency induces senescence in human lymphocytes.
a, Flow cytometry of CD45RA and CCR7 in CD4+ (top) or CD8+ (bottom) T cells from P1.2 and Ctrl (left). Percent of naive CD45RA+CCR7+ in CD4+ or CD8+ T cells from NCs (n = 53) and patients (n = 15, middle). Means of control and patient data from the middle (right). b, Flow cytometry of CD57 on patient CD8+ T cells (P, colors, n = 51) compared to NCs (black, n = 14) (left). Quantification of gated CD57+CD8+ T cells (middle). Means of control and patient data from the middle (right). c, Mean fluorescence intensity (MFI) of SA-β-gal activity in CD8+ T cells from NCs (n = 16) and patients (n = 11). Points on the control bar represent the mean of matched NCs. d, Relative T cell numbers of NCs (n = 11) and patients (n = 8) after stimulation with anti-CD3/CD28. e, MFI of p21, p53 and p16 gated on CD8+ T cells of NCs and patients. p21, NCs (n = 11) and patients (n = 8); p53, NCs (n = 16) and patients (n = 7); and p16, NCs (n = 16) and patients (n = 7). f, Serum levels of IL-6 and IL-8 in NCs (n = 22) and patients (n = 6). g, Scheme of naive CD8+ T cells from healthy donor PBMCs electroporated for CRISPR/Cas9 KO of GIMAP5 (G5 KO). h, Relative cell numbers of G5 KO and Ctrl human CD8+ T cells after CD3/CD28 stimulation (n = 5 per group). i, Representative immunoblot of GIMAP5, p21, p53, p16 and c-Myc with an HSP90-loading control in Ctrl or G5 KO human T cells. Whole-cell lysates were collected on day 16 post-electroporation (n = 5). All data are mean ± s.d. and were analyzed by two-tailed, unpaired Student’s t-test (af,h). P < 0.0001: P = 5.81 × 10⁻⁶, P = 5.60 × 10⁻¹⁴ (a top to bottom) and P = 2.60 × 10⁻¹⁴ (b).
Fig. 3 ∣
Fig. 3 ∣. Gimap5 deficiency in mice induces senescence in T cells and liver endothelial cells.
a, Spleen (left) and liver (right) tissue lysates from Gimap5sph/sph, Gimap5+/sph (Het) and WT mice were immunoblotted for indicated proteins (n = 2). b, Quantification of p21 bands in a using ImageJ. Controls (n = 8), sphinx (n = 7). c, MFI of p21, p53, p16 and SA-β-gal activity gated on CD4+ T cells from sphinx, young and aged WT mice. CD4+p21, young (n = 15), sphinx (n = 10), aged (n = 11) mice; CD4+p53, young (n = 20), sphinx (n = 16), aged (n = 11) mice; CD4+p16, young (n = 14), sphinx (n = 10), aged (n = 11) mice; CD4+SA-β-gal, young (n = 17), sphinx (n = 12), aged (n = 11) mice. d, MFI of p21, p53, p16 and SA-β-gal activity in CD45CD31+ liver ECs from young, sphinx and aged mice. CD31+p21, young (n = 13), sphinx (n = 20), aged (n = 11) mice; CD31+p53, young (n = 21), sphinx (n = 13), aged (n = 13) mice; CD31+p16: young (n = 22), sphinx (n = 13), aged (n = 13) mice; CD31+SA-β-gal, young (n = 16), sphinx (n = 13), aged (n = 10) mice. e, Spleen (left) and liver (right) tissue lysates from GimapSsph/sph Rag1−/−, Gimap5+/isph Rag1−/− and Gimap5+/+ Rag1−/− mice were immunoblotted for indicated proteins. Controls (n = 3), Gimap5sph/sph Rag1−/− (n = 5). f, Quantification of p21 bands in e using ImageJ. 7–12-week-old (young, sphinx) or 16–19-month-old (aged) male and female mice were used in each experiment. Young mice were littermate controls for sphinx. All data are mean ± s.d. and were analyzed by two-tailed, unpaired Student’s t-test (b–d,f). NS, not significant. P < 0.0001: P = 1.03 × 10⁻⁵ (b), P = 8.67 × 10⁻⁶, P = 3.94 × 10⁻⁷, P = 8.72 × 10⁻⁵, P = 6.10 × 10⁻¹⁴ (c left to right) and P = 1.31 × 10⁻⁷, P = 1.34 × 10⁻⁵, P = 6.64 × 10⁻⁷, P = 1.44 × 10⁻⁵, P = 1.71 × 10⁻⁵, P = 1.04 × 10⁻⁶ (d left to right).
Fig. 4 ∣
Fig. 4 ∣. GIMAP5 is essential for CER homeostasis in T cells.
a, Schematic for isolating lymphocytes from 8–12-week-old C57BL/6 mouse spleens, followed by electroporation on day 5 after starting concanavalin A (ConA) and IL-2 stimulation for CRISPR/Cas9 KO of Gimap5 (G5 KO) or control (Ctrl). gRNA, guide RNA; RNP, ribonucleoprotein. b, Relative viable number from a over time (left). Note that electroporation induces modest Ctrl cell death for 1–2 d. Lysates were immunoblotted for indicated proteins (right) (n = 5). C, Ctrl; G5, G5 KO. c, Transmission (top) and scanning (bottom) electron microscopic images of cells from a on day 3 post-electroporation (n = 3). Scale bars, 5 μm. Red arrows indicate necrotic cell corpses. d,e, Volcano plots of lipids detected by untargeted (d) or targeted (e) (left) MS analysis of G5 KO versus Ctrl. Families of SPLs are indicated by shape and color. Dotted lines indicate a P value of 0.05 and log2 fold change (FC) of 1 or −1 (d and e, left). Significantly reduced SPLs are shown in blue fields and increased SPLs are shown in orange fields. Heat map of signal intensity of SPLs (e, right). Displayed are SPLs that pass a P value cutoff of 0.05 by t-test. Signals reflect the total sum normalized, auto-scaled signal intensity (n = 5). Lipid designation is shown (chain length: no. of unsaturated bonds). LCER, lactosylceramide. f, Relative viable cell number of Ctrl and G5 KO murine T cells treated with fumonisin B1 (FB1) (5 μM, 48 h) on day 1 and quantified on day 3 or 3.5 post-electroporation (n = 3 per group). g, Heat map of SPLs detected in P2.2 (left) and P7.1 (right), healthy family members, NCs or shipping controls (TCs). All hits on the heat maps are features that are >1 s.d. from the mean (>1 z score) (n = 3) All data are mean ± s.d. and were analyzed by two-tailed, unpaired Student’s t-test (b,df). NS, not significant. P < 0.0001: P = 6.42 × 10⁻⁵ (b) and P = 8.15 × 10⁻⁶, P = 1.59 × 10⁻⁵ (f left to right).
Fig. 5 ∣
Fig. 5 ∣. GIMAP5 associates with CK2 and regulates CER levels.
a, MS analysis of GST-GIMAP5-binding proteins represented as a heat map (left). GIMAP5 interactors that have been found as either CK2 substrates or interactors are labeled in bold (left) and visualized using CytoScape software (right). Proteins with a mean log2 ratio > 2 are displayed after CRAPome filtration. Color intensity reflects the mean log2 ratio (top scale). b, Immunoblots of IP with anti-CK2α or isotype control and the input in human T cell blasts after TCR stimulation shown in minutes (min) (n = 4). c,d, Immunofluorescence staining with anti-GIMAP5 (magenta), CK2α (yellow) and LCK (green in c) or LAMTOR4 (green in d) in human T cell blasts before and after TCR stimulation (60 min) (n = 3). e, Heat map of the log2 FC of CERs in human T cell blasts after TCR stimulation (n = 7). Each group is normalized to time 0. f, Immunoblots of the IP of Ck2α (top) and the input lysate (bottom) in Ctrl or G5 KO murine T cell blasts on day 3 post-electroporation after stimulation (n = 4). g, Immunoblots of Ctrl KO, G5 KO, G5 KO + Ck2a1 KO murine T cell lysates for proteins shown on day 3 post-electroporation (left). Relative viable cell numbers from left (right) (n = 3 per group). h, Relative viable cell numbers on day 3 and 3.5 post-electroporation of Ctrl and G5 KO murine T cells treated with CX-4945 (2.5 μM), started on day 1 (n = 3 per group). i, Heat map of SPLs from h. SPLs significantly affected in Fig. 4e are displayed (P <0.05) (n = 3). Yellow box indicates key downregulated species.j, Immunoblots of cell lysates treated with CX-4945 (2.5 μM, 24 h) for proteins shown (n = 4). k, Heat map of CERs in human T cell blasts without or with CX-4945 (2.5 μM) followed by TCR stimulation (n = 3). Each sample is normalized to time 0. DMSO, dimethylsulfoxide. All data are mean ± s.d. and were analyzed by two-tailed, unpaired Student’s t-test (g,h). P < 0.0001: P = 2.51 × 10⁻⁵ (g).
Fig. 6 ∣
Fig. 6 ∣. CK2 inhibition and GIMAP5 overexpression in T cells rescue the cell death induced by the accumulation of endogenous CERs.
a, Diagram of the generation of endogenous LC CERs by treating cells with exogenous C6-CER. b,c, Relative viable cell numbers of untreated (UNT) and C6-CER-treated (Avanti Polar lipid, 35 μM, 24 h) human T cell blasts with and without FB1(b) and CX-4945 (c). FBI, 10 μM (n = 5 per group); CX-4945, 2.5 μM (n = 5 per group). d, Immunoblot of GIMAP5 with an HSP90-loading control in lentivirus-mediated either empty vector (EV) or GIMAP5 overexpression (G5 OE) in human T cells (left, n = 5 per group). Relative viable cell numbers of EV or GIMAP5 (G5) lentivirus-transduced human T cell blasts with or without C6-CERs treatment (32.5 μM, 24 h) (right, n = 5 per group). e, A model of GIMAP5 regulating TCR-induced CER levels through CK2, thereby affecting T cell longevity and senescence. All data are mean ± s.d. and were analyzed by two-way analysis of variance (ANOVA) with Bonferroni post-test correction (bd). P < 0.0001: P = 4.11 × 10⁻¹⁰ (b), P = 1.83 × 10⁻⁸ (c) and P = 3.47 × 10⁻⁹ (d).

References

    1. Ohtsuka H, Shimasaki T & Aiba H Genes affecting the extension of chronological lifespan in Schizosaccharomyces pombe (fission yeast). Mol. Microbiol 115, 623–642 (2021). - PMC - PubMed
    1. Jiang JC, Kirchman PA, Allen M & Jazwinski SM Suppressor analysis points to the subtle role of the LAG1 ceramide synthase gene in determining yeast longevity. Exp. Gerontol 39, 999–1009 (2004). - PubMed
    1. Jiang JC, Kirchman PA, Zagulski M, Hunt J & Jazwinski SM Homologs of the yeast longevity gene LAG1 in Caenorhabditis elegans and human. Genome Res. 8, 1259–1272 (1998). - PubMed
    1. Hannun YA & Obeid LM Principles of bioactive lipid signalling: lessons from sphingolipids. Nat. Rev. Mol. Cell Biol 9, 139–150 (2008). - PubMed
    1. Bikman BT & Summers SA Ceramides as modulators of cellular and whole-body metabolism. J. Clin. Invest 121, 4222–4230 (2011). - PMC - PubMed

LinkOut - more resources