. 2024 Jan;56(1):51-59.
doi: 10.1038/s41588-023-01609-2. Epub 2024 Jan 3.

Development of a human genetics-guided priority score for 19,365 genes and 399 drug indications

Affiliations

Development of a human genetics-guided priority score for 19,365 genes and 399 drug indications

Áine Duffy et al. Nat Genet. 2024 Jan.

Abstract

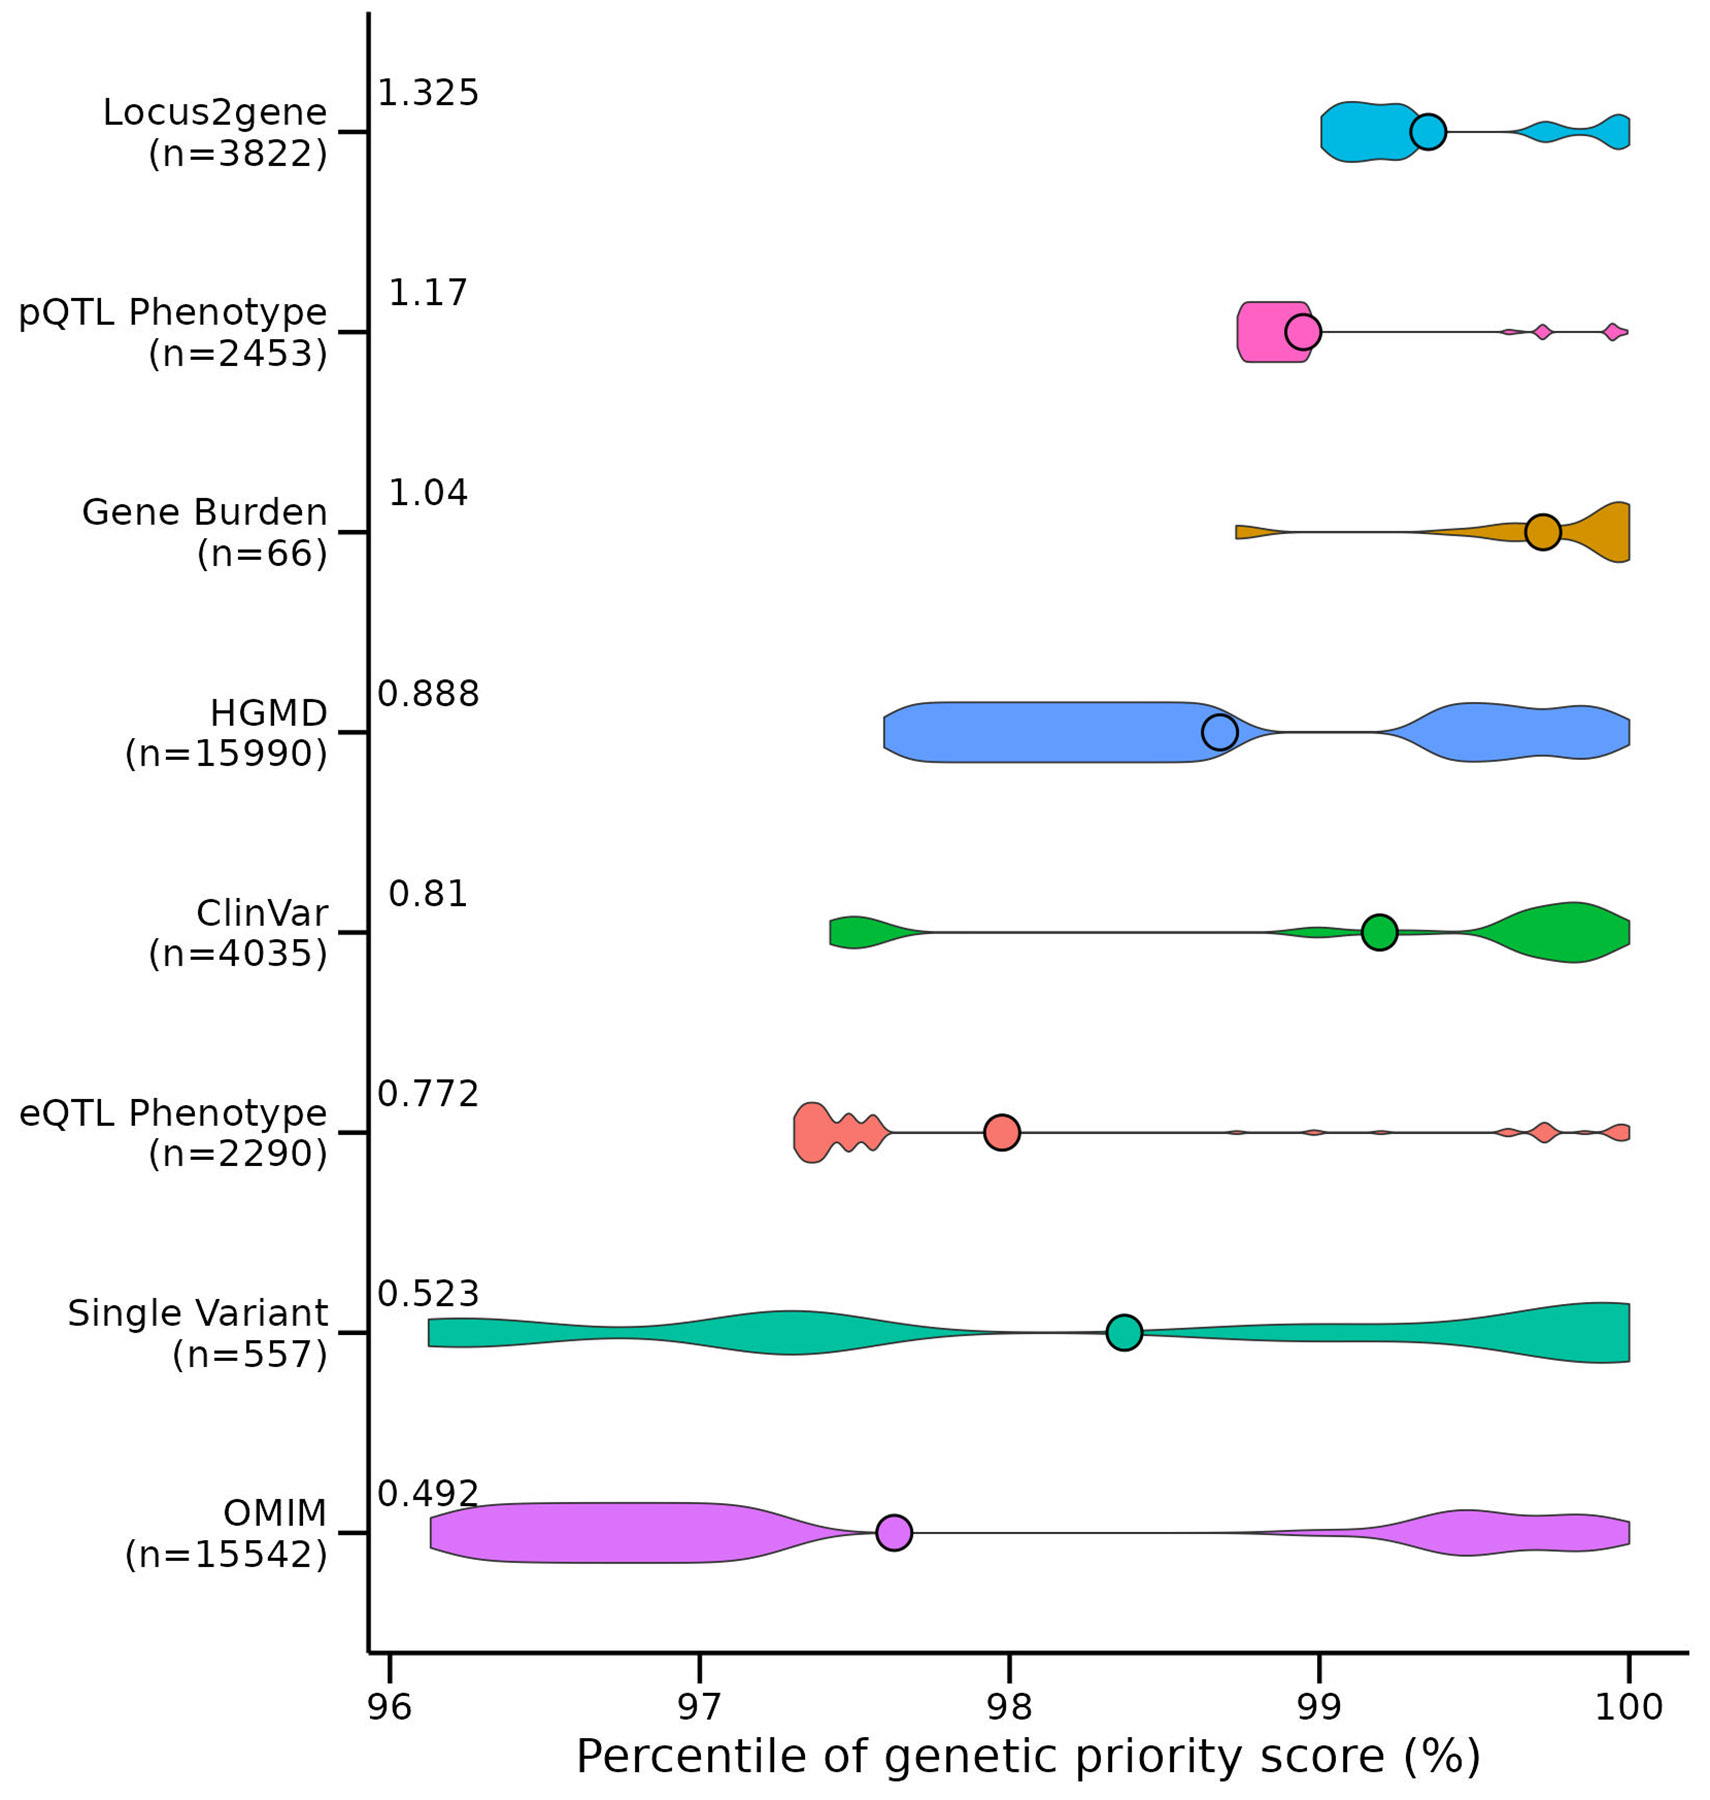
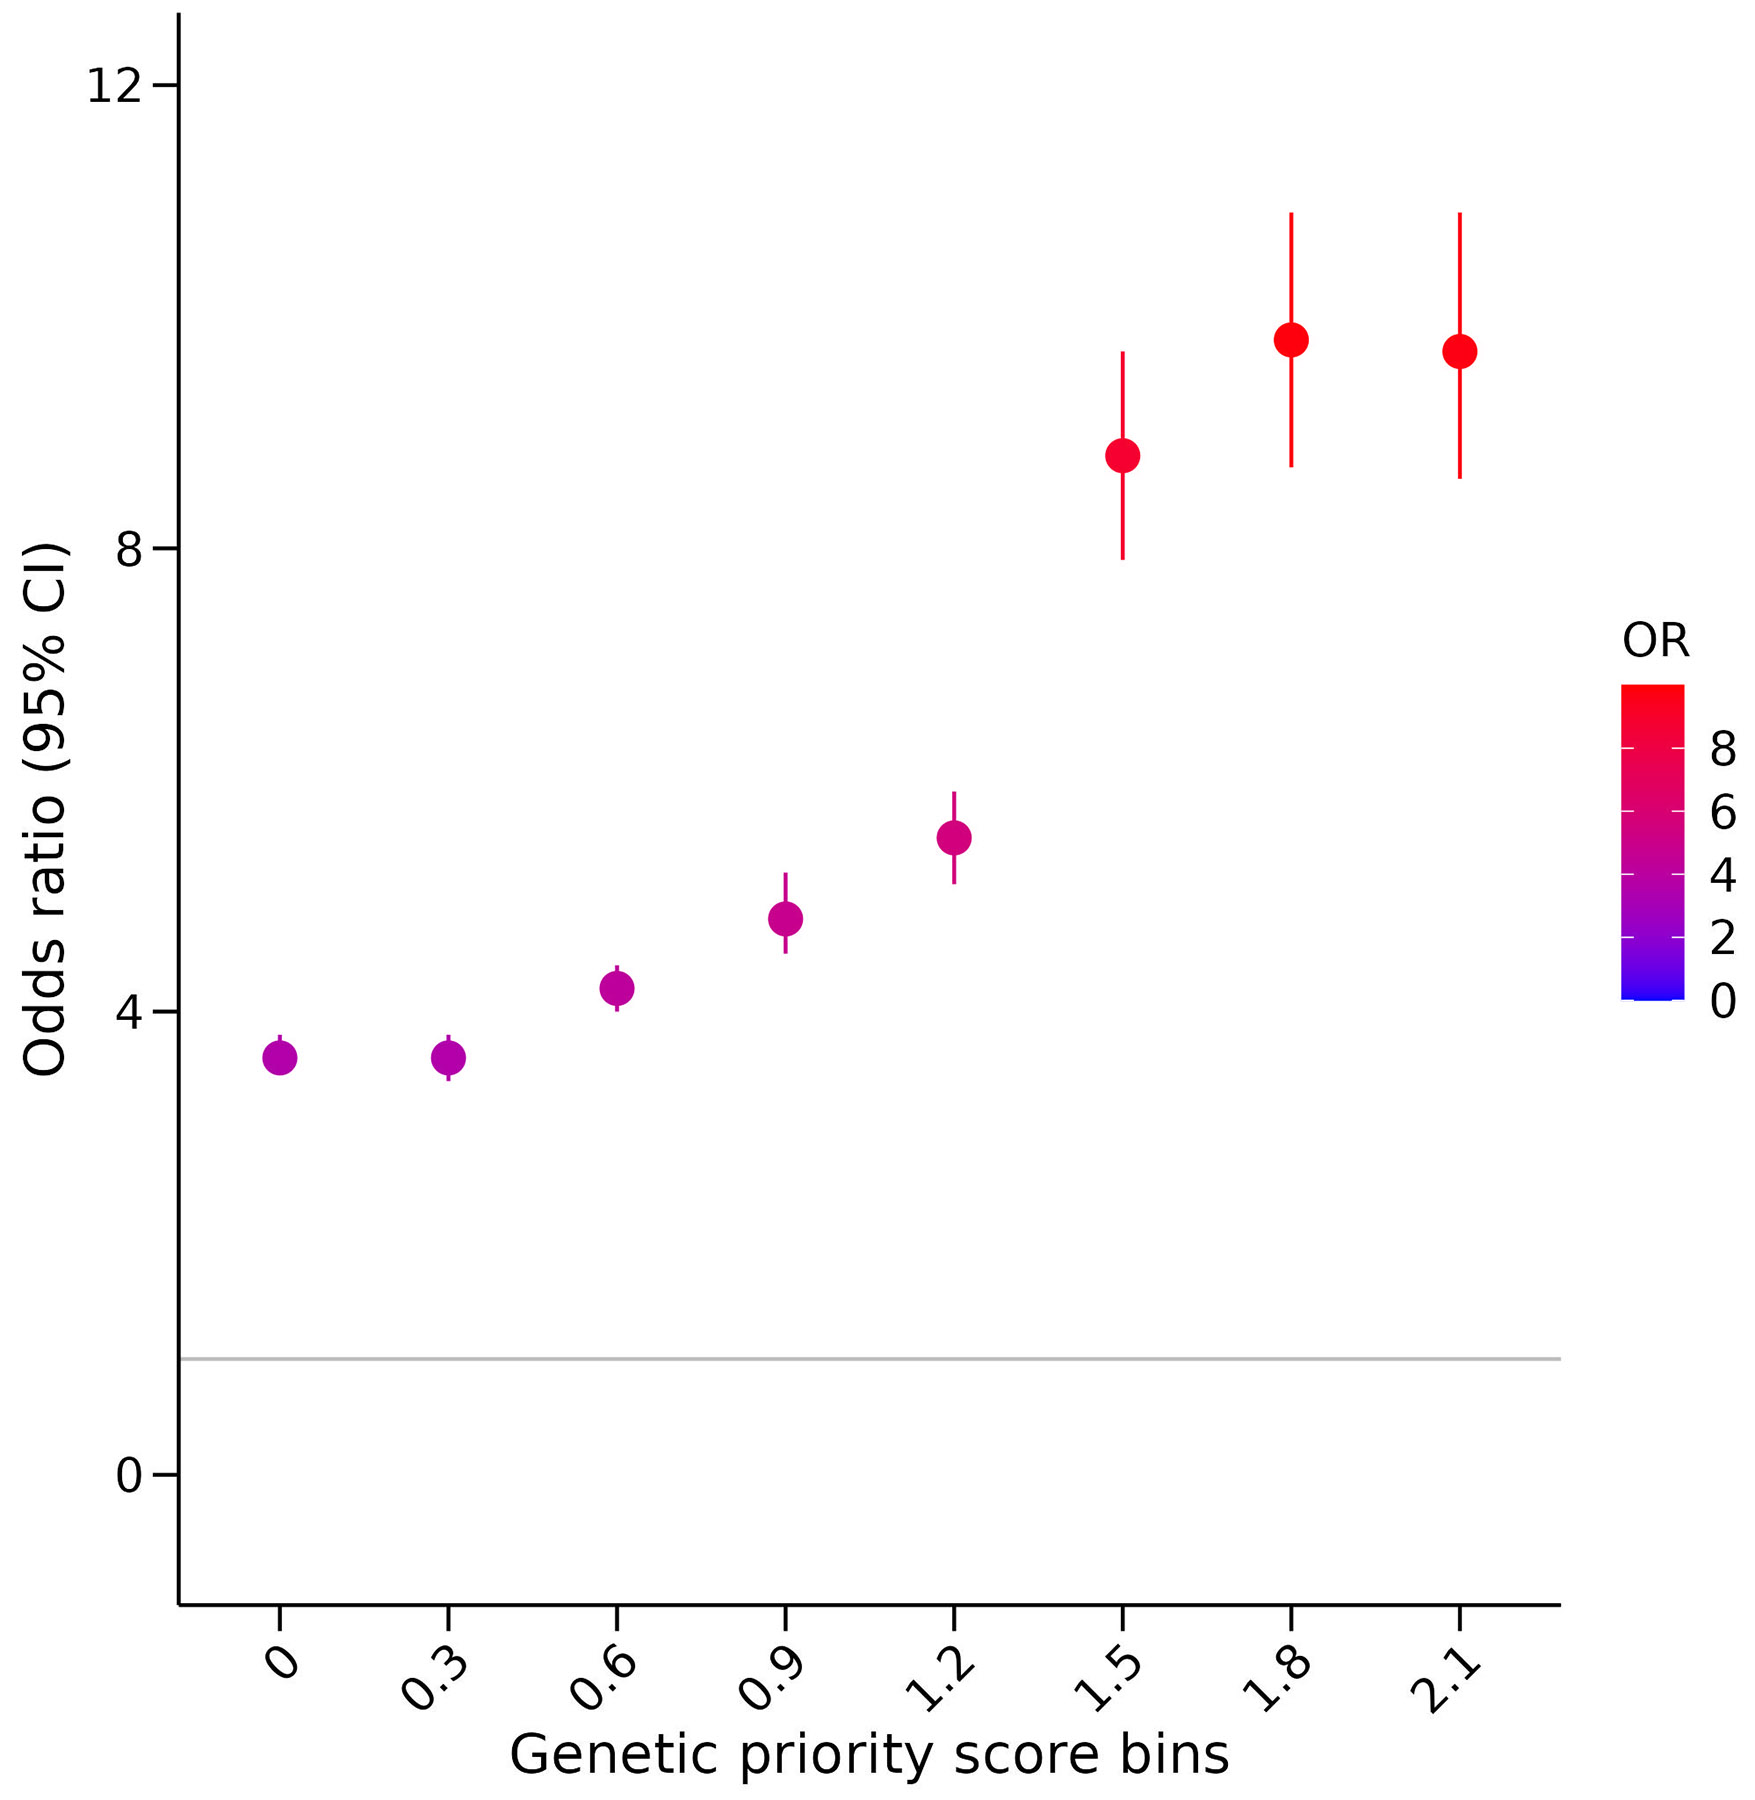
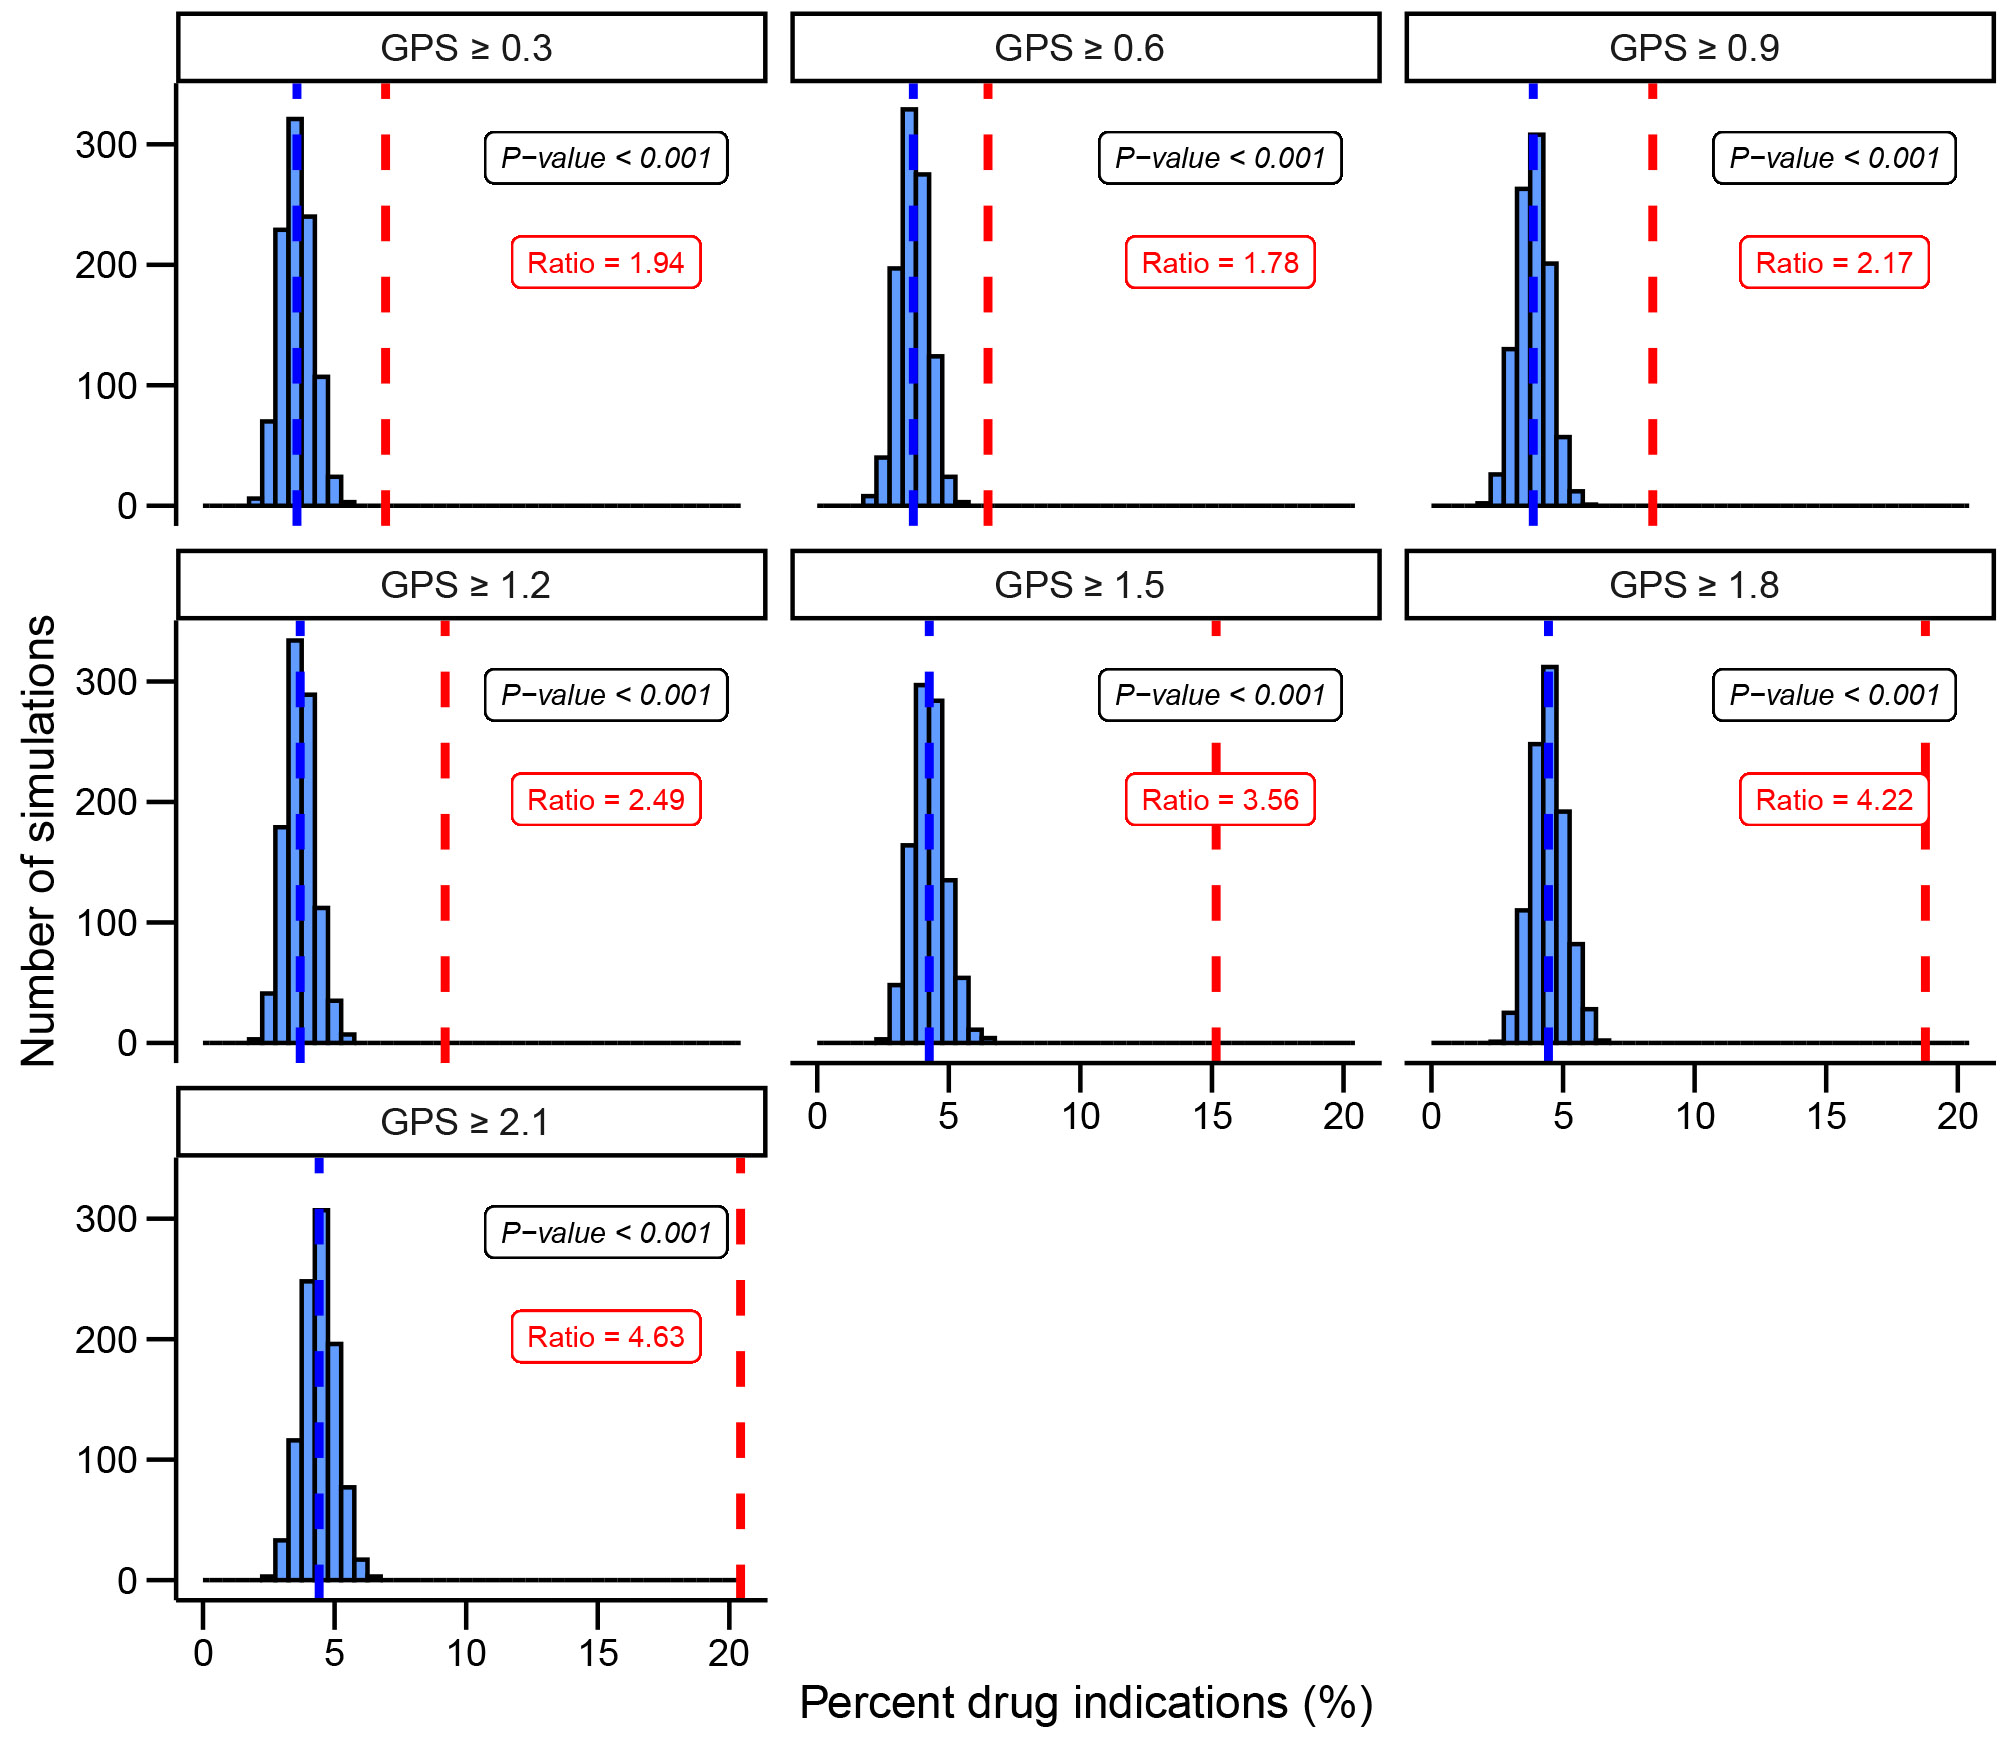
Studies have shown that drug targets with human genetic support are more likely to succeed in clinical trials. Hence, a tool integrating genetic evidence to prioritize drug target genes is beneficial for drug discovery. We built a genetic priority score (GPS) by integrating eight genetic features with drug indications from the Open Targets and SIDER databases. The top 0.83%, 0.28% and 0.19% of the GPS conferred a 5.3-, 9.9- and 11.0-fold increased effect of having an indication, respectively. In addition, we observed that targets in the top 0.28% of the score were 1.7-, 3.7- and 8.8-fold more likely to advance from phase I to phases II, III and IV, respectively. Complementary to the GPS, we incorporated the direction of genetic effect and drug mechanism into a directional version of the score called the GPS with direction of effect. We applied our method to 19,365 protein-coding genes and 399 drug indications and made all results available through a web portal.


Figures

Extended Data Fig. 1.
Extended Data Fig. 1.. Association of genetic features with drug indications using Firth logistic regression in the Open Target dataset in all drugs and drugs with one gene target.
The Open Targets dataset was split into 80% training and 20% test sets in five-fold cross-validation. Firth logistic regression was run on the cross-validation training sets (n = 735,847 independent drug-gene-phenotype combinations) with drug indication as the outcome variable and the eight human genetic features, 14 phecode categories, genetic constraint and the number of gene targets per drug binarized into drugs with a single gene target and drugs with multiple gene targets as the predictor variables. Shown is a forest plot of beta coefficients with 95% CIs from the eight human genetic features included in the models in five-fold cross-validation. Each cross-validated sample is color labeled and filled circles indicate a beta coefficient with a significant P-value and the 95% CIs are defined as error bars.
Extended Data Fig. 2,
Extended Data Fig. 2,. Contribution of each genetic feature on the GPS.
Shown is a violin plot demonstrating the contribution of each genetic feature to the 919,809 genetic priority scores in the Open Target dataset for n = 231,066 gene-phenotype combinations. The plot shows the contribution of each feature to the GPSs compared across all features and all scores, binned according to the percentile of the score. The violin width represents the density of the genetic feature at each percentile and the mean percentile for each feature is shown as a point. On the y-axis, the sample size (n) and mean weight of each genetic feature from the five cross-validated samples was recorded and the y-axis was ordered by increasing value of these weights. We demonstrate that many different genetic features contribute to the highest percentile ranked GPSs.
Extended Data Fig. 3.
Extended Data Fig. 3.. Contribution of genetic features to the GPS at each 0.3 increment bin.
Each bar plot shows the contribution of the genetic features to the GPSs at 0.3 increment bins in the Open Target dataset. As the GPS increases, the number of features which contribute to each score increases. On the x axis of each bar plot is the number of genetic features that contributes to each score, colored by each feature present. On the y-axis is the number of counts for each feature.
Extended Data Fig. 4.
Extended Data Fig. 4.. Association of the GPS at increments of 0.3 with drug indication in the Open Target dataset.
The association of increasing GPSs with drug indications was investigated by binning the Open Target drug dataset (n = 919,809 independent drug-gene-phenotype combinations) into 0.3 increments of the GPS and comparing GPSs greater or equal to each increment with GPSs equal to zero. For each bin, a logistic regression model was performed with drug indication as the outcome variable and the GPS bin as the predictor variable, adjusting for phecode categories as covariates and the number of gene targets per drug binarized into drugs with a single gene target and drugs with multiple gene target. ORs with 95% CI are defined in the forest plot as circles and error bars.
Extended Data Fig. 5.
Extended Data Fig. 5.. Association of the GPS at increments of 0.3 with drug indication in the Open Target and SIDER dataset in drugs with one gene target.
The association of increasing GPSs with drug indications was investigated by binning the Open Target drug dataset (n = 215,028 independent drug-gene-phenotype combinations) and the SIDER dataset (n = 66,792 independent drug-gene-phenotype combinations) into 0.3 increments of the GPS and comparing GPSs greater or equal to each increment with GPSs equal to zero. For each bin, a logistic regression model was performed with drug indication as the outcome variable and the GPS bin as the predictor variable, adjusting for phecode categories as covariates. We show the ORs with 95% CI from the logistic regression model assessed in the Open Targets and SIDER dataset, restricted to drugs with one gene target. ORs with 95% CI are defined in the forest plots as circles and error bars.
Extended Data Fig. 6.
Extended Data Fig. 6.. Schematic used to derive the desired direction of therapeutic modulation using direction of genetic effect.
An idealistic framework using direction of genetic effect to propose the direction of therapeutic modulation. Mutations which decrease gene function and subsequently increase disease risk model activator drugs and mutations which increase gene function and increase disease risk model inhibitor drugs.
Extended Data Fig. 7.
Extended Data Fig. 7.. Association of the GPS-DOE with drug indication in the Open Target dataset.
For GPS-DOE, the association of the increasing absolute values of the GPS-DOE with drug indications was investigated by binning the Open Target drug dataset (n = 839,752 independent drug-gene-phenotype combinations) into 0.3 increments of the GPS-DOE and comparing scores greater or equal to each increment with scores equal to zero. For each bin, a logistic regression model was performed with drug indication as the outcome variable and the GPS-DOE bin as the predictor variable, adjusting for phecode categories as covariates and the number of gene targets per drug binarized into drugs with a single gene target and drugs with multiple gene targets. ORs with 95% CI are defined in the forest plot as circles and error bars and we repeated the associations for GPS-DOE restricted to LOF predictions and GOF predictions only.
Extended Data Fig. 8.
Extended Data Fig. 8.. Association of the GPS-DOE with drug indication by clinical trial phase.
a) Association results of the absolute values of the GPS-DOE in s.d. units with drug indication in the Open Target dataset (n = 839,752 independent drug-gene-phenotype combinations) by clinical trial phase are shown. The plot shows a forest plot of ORs with 95% CI represented as circles and error bars for each logistic regression model with the 14 phecode categories and the number of gene targets per drug binarized into drugs with a single gene target and drugs with multiple gene targets as covariates. On the y-axis, the number of unique drug indications for each clinical phase is recorded in red and the number of unique drugs in blue. We demonstrate that the GPS-DOE has a strong association with drug indications as the clinical trial phase advances from phase I to phase IV. b) Shown is the fold enrichment of drug indications with support from a high GPS-DOE using score thresholds of 0.9,1.5 and 2.1 compared to those without genetic evidence in each targeted phase (for example, phase II, III or IV) divided by the total sum observed in phase I.
Fig. 1.
Fig. 1.. Workflow to build the genetic priority score for drug indications.
A schematic diagram of the data sources and methodological steps to create the genetic priority score (GPS) and genetic priority score with direction of effect (GPS-DOE) for drug indications. OMIM, Online Mendelian Inheritance in Man; HGMD, Human Gene Mutation Database; eQTL, expression Quantitative Trait Loci; pQTL, protein Quantitative Loci; OT; Open Targets; DG, drug genetic; GPS, genetic priority score; GPS-DOE, genetic priority score with direction of effect.
Fig. 2.
Fig. 2.. Association of genetic features with drug indications in the Open Target dataset.
Shown is a forest plot of odds ratios (ORs) with 95% confidence intervals (CI) represented as circles and error bars. These ORs were calculated for each genetic feature with drug indications using a logistic regression model in the Open Target dataset (n= 919,809 independent drug-gene-phenotype combinations). The model included 14 phecode categories and the number of gene targets per drug, binarized into drugs with a single gene target and drugs with multiple gene targets, as covariates. The features are grouped by color according to their genetic evidence category. On the y-axis, the number of unique genes for each feature is recorded in red and the number of unique phenotypes is recorded in blue. We show associations with all genetic features with drug indications, with strong effects observed for Gene Burden, Single Variant and ClinVar. OMIM, Online Mendelian Inheritance in Man; HGMD, Human Gene Mutation Database; eQTL, expression Quantitative Trait Loci; pQTL, protein Quantitative Loci.
Fig. 3.
Fig. 3.. Association of the genetic priority score at increments of 0.3 with drug indication in the SIDER dataset.
The association of increasing genetic priority scores with drug indications was investigated by binning the SIDER drug dataset (n=1,005,550 independent drug-gene-phenotype combinations) into 0.3 increments of the genetic priority score (GPS) and comparing genetic priority scores greater or equal to each increment with genetic priority scores equal to zero. For each bin, a logistic regression model was performed with drug indication as the outcome variable and the GPS bin as the predictor variable, adjusting for phecode categories as covariates and the number of gene targets per drug binarized into drugs with a single gene target and drugs with multiple gene targets. Odds ratios (ORs) with 95% confidence intervals (CI) are defined in the forest plot as circles and error bars. GPS, genetic priority score.
Fig. 4.
Fig. 4.. Simulation of a drug prioritization framework.
We evaluate the ability of the genetic priority score (GPS) to prioritize drug targets in a simulation framework. Increments of 0.3 are selected as thresholds for the GPS from the calculated scores in SIDER. We selected N=1000 gene-phenotypes with high genetic priority scores and reported how many were therapeutic targets. We recorded the fold difference in red. We selected N=1000 gene-phenotypes randomly and matched the phenotypes to the phenotypes with high genetic priority scores. We reported how many were therapeutic targets and repeated N=1000 to obtain the mean drug indications % recorded in blue. The empirical P-value was calculated for each GPS cutoff. We demonstrate that drug gene targets with higher genetic priority scores are more likely to harbor an actual drug indication. GPS, genetic priority score.
Fig. 5.
Fig. 5.. Association of the genetic priority score with drug indication by clinical trial phase.
a) Association results of the genetic priority score (GPS) in standard deviation units with drug indication in the Open Target dataset (n=919,809 independent drug-gene-phenotype combinations) by clinical trial phase are shown. The plot shows a forest plot of odds ratios (ORs) with 95% confidence intervals (CI) represented as circles and error bars for each logistic regression model with the 14 phecode categories and the number of gene targets per drug binarized into drugs with a single gene target and drugs with multiple gene targets as covariates. On the y-axis, the number of unique drug indications for each clinical phase are recorded in red and the number of unique drugs in blue. Filled circles indicate an OR with a significant P-value. We demonstrate that the GPS has a strong association with drug indications as the clinical trial phase advances from phase I to phase IV. b) Shown is the fold enrichment of drug indications with support from a high GPS using score thresholds of 0.9,1.5 and 2.1 compared to those without genetic evidence in each targeted phase (e.g., phase II, III or IV) divided by the total sum observed in phase I.
Fig. 6.
Fig. 6.. Association of the genetic priority score with direction of effect with drug indication in the SIDER dataset.
For genetic priority scores with direction of effect, the association of the increasing absolute values of the genetic priority score with direction of effect (GPS-DOE) with drug indications was investigated by binning the SIDER drug dataset (n=695,082 independent drug-gene-indication combinations) into 0.3 increments of the GPS-DOE and comparing scores greater or equal to each increment with scores equal to zero. For each bin, a logistic regression model was performed with drug indication as the outcome variable and the GPS-DOE bin as the predictor variable, adjusting for phecode categories as covariates and the number of gene targets per drug binarized into drugs with a single gene target and drugs with multiple gene targets. Odds ratios (ORs) with 95% confidence intervals (CI) are defined in the forest plot as circles and error bars and we repeated the associations for GPS-DOE restricted to LOF predictions and GOF predictions only. GPS, genetic priority score; GPS-DOE, genetic priority score with direction of effect; GOF, gain-of-function; LOF, loss-of-function.

References

    1. Plenge RM, Scolnick EM & Altshuler D Validating therapeutic targets through human genetics. Nat Rev Drug Discov 12, 581–94 (2013). - PubMed
    1. Cook D et al. Lessons learned from the fate of AstraZeneca's drug pipeline: a five-dimensional framework. Nat Rev Drug Discov 13, 419–431 (2014). - PubMed
    1. Dowden H & Munro J Trends in clinical success rates and therapeutic focus. Nat Rev Drug Discov 18, 495–496 (2019). - PubMed
    1. Nelson MR et al. The support of human genetic evidence for approved drug indications. Nat Genet 47, 856–860 (2015). - PubMed
    1. Ochoa D et al. Human genetics evidence supports two-thirds of the 2021 FDA-approved drugs. Nat Rev Drug Discov 21, 551 (2022). - PubMed

METHODS-ONLY REFERENCES

    1. Bodenreider O The Unified Medical Language System (UMLS): integrating biomedical terminology. Nucleic Acids Res 32, D267–70 (2004). - PMC - PubMed
    1. Pendlington ZM. Mapping UK Biobank to the Experimental Factor Ontology (EFO) https://github.com/EBISPOT/EFO-UKB-mappings/blob/master/ISMB_Mapping_UK_....
    1. Bento AP et al. The ChEMBL bioactivity database: an update. Nucleic Acids Res 42, D1083–90 (2014). - PMC - PubMed
    1. Wishart DS et al. DrugBank 5.0: a major update to the DrugBank database for 2018. Nucleic Acids Res 46, D1074–d1082 (2018). - PMC - PubMed
    1. Davies M et al. ChEMBL web services: streamlining access to drug discovery data and utilities. Nucleic Acids Res 43, W612–W620 (2015). - PMC - PubMed

LinkOut - more resources