. 2024 Mar;5(3):420-432.
doi: 10.1038/s43018-023-00690-0. Epub 2024 Jan 3.

PD-1 defines a distinct, functional, tissue-adapted state in Vδ1+ T cells with implications for cancer immunotherapy

Affiliations

PD-1 defines a distinct, functional, tissue-adapted state in Vδ1+ T cells with implications for cancer immunotherapy

Daniel Davies et al. Nat Cancer. 2024 Mar.

Abstract

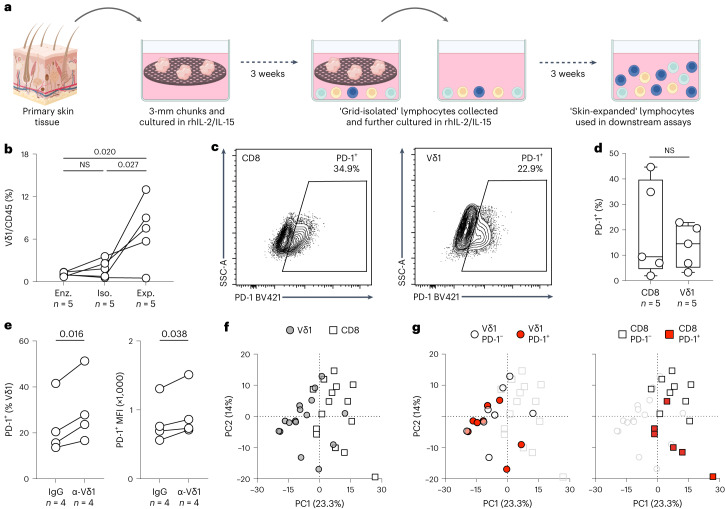
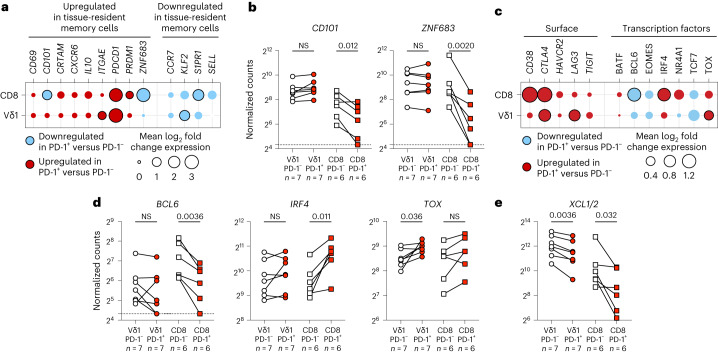
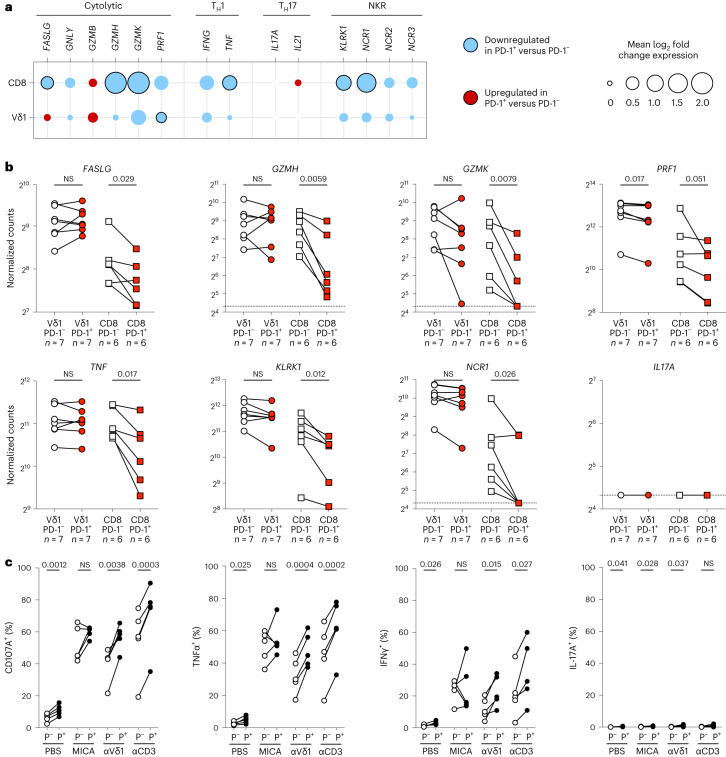
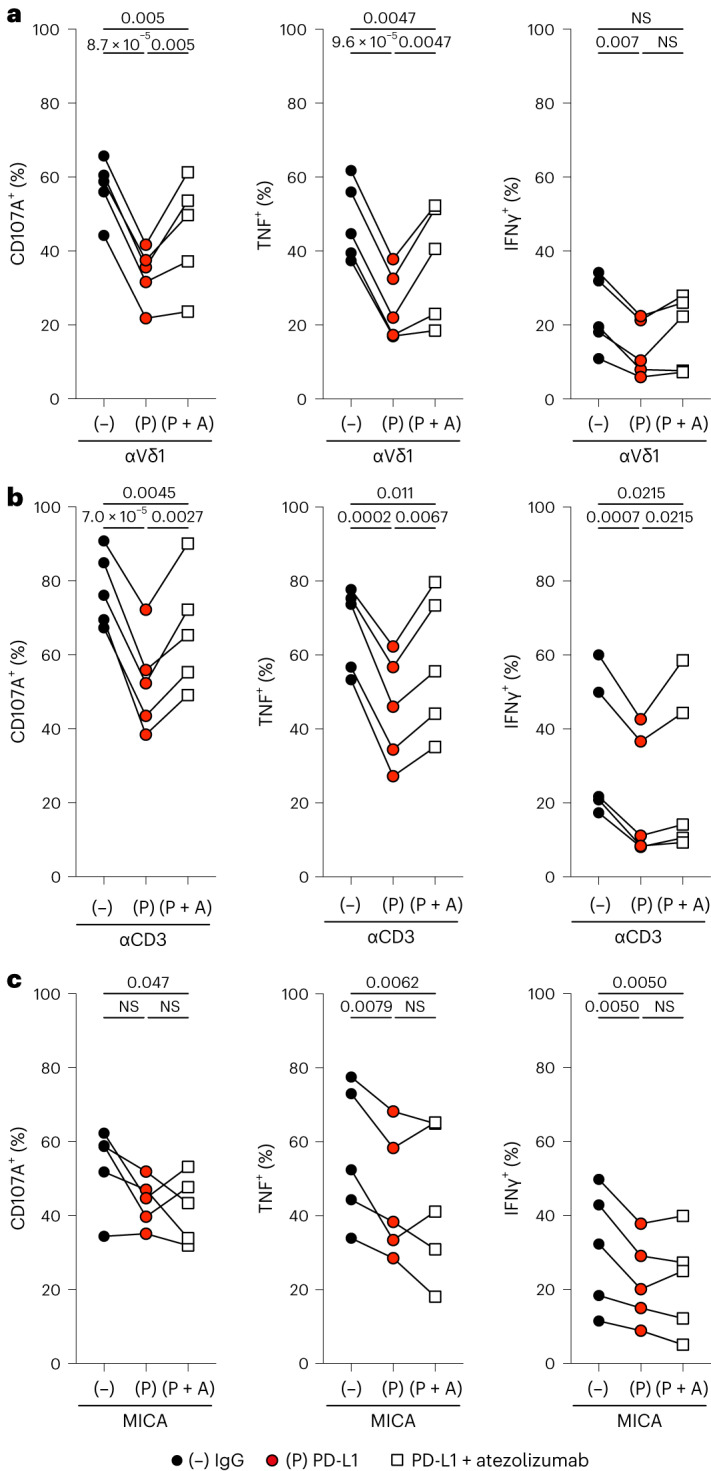
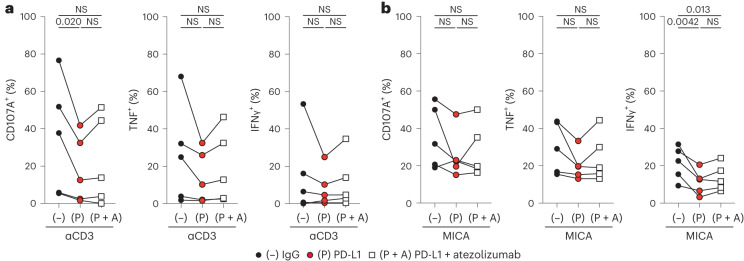
Checkpoint inhibition (CPI), particularly that targeting the inhibitory coreceptor programmed cell death protein 1 (PD-1), has transformed oncology. Although CPI can derepress cancer (neo)antigen-specific αβ T cells that ordinarily show PD-1-dependent exhaustion, it can also be efficacious against cancers evading αβ T cell recognition. In such settings, γδ T cells have been implicated, but the functional relevance of PD-1 expression by these cells is unclear. Here we demonstrate that intratumoral TRDV1 transcripts (encoding the TCRδ chain of Vδ1+ γδ T cells) predict anti-PD-1 CPI response in patients with melanoma, particularly those harboring below average neoantigens. Moreover, using a protocol yielding substantial numbers of tissue-derived Vδ1+ cells, we show that PD-1+Vδ1+ cells display a transcriptomic program similar to, but distinct from, the canonical exhaustion program of colocated PD-1+CD8+ αβ T cells. In particular, PD-1+Vδ1+ cells retained effector responses to TCR signaling that were inhibitable by PD-1 engagement and derepressed by CPI.


Conflict of interest statement

D.D., S.K. and M.L.I. were previously employed on a sponsored research agreement with Gamma Delta Therapeutics. D.D. and S.K. are currently employed on a sponsored research agreement with Takeda Pharmaceuticals (starting in February 2023). I.Z. was previously employed on a sponsored research agreement with Takeda Pharmaceuticals (February–July 2023). D.B. reports personal fees from NanoString and AstraZeneca and has a patent (PCT/GB2020/050221) issued on methods for cancer prognostication. A.H. receives laboratory research funding from Takeda Pharmaceuticals (starting in February 2023) and consults for eGenesis and Prokarium. Y.W. consults for PersonGen Biotherapeutics and E15 VC. The remaining authors declare no competing interests.

Figures

Fig. 1
Fig. 1. Transcriptomic presence of Vδ1+ cells within melanoma predicts the response to anti-PD-1 and anti-PD-L1 CPI therapy.
a, Expression (transcripts per million (TPM)) of TRDV1, TRBC2, CD4 and CD8B plotted according to the objective response to anti-PD-1 and anti-PD-L1 CPI therapy. Mann–Whitney U-test. b, Left, expression of TRDV1 in tumors with below-median neoantigen loads from Liu et al. plotted according to the objective response to anti-PD-1 CPI therapy. Right, progression-free survival (PFS) of patients with below-median neoantigen loads from Liu et al. split on the median expression of TRDV1. log-rank test. c, Left, expression of TRDV1 in tumors with above-median neoantigen loads from Liu et al. plotted according to the objective response to anti-PD-1 CPI therapy. Mann–Whitney U-test. Right, PFS of patients with above-median neoantigen loads from Liu et al. split on the median expression of TRDV1. log-rank test. All P values presented are two-sided where relevant. For the box plots, the boxes denote the medians and interquartile ranges (IQRs); the whiskers denote the minimum and maximum values. NR, nonresponder; NS, not significant; R, responder. Source data
Fig. 2
Fig. 2. Expression of PD-1 on Vδ1+ cells is associated with distinct biology compared with its expression on CD8+ T cells.
a, Schematic of nonenzymatic extraction of lymphocytes from primary human tissue and subsequent expansion protocol. b, Summary flow cytometry data of Vδ1+ cell enrichment in skin-expanded (Exp.) lymphocytes compared with skin lymphocytes obtained by direct enzymatic digestion (Enz.) and grid isolation (Iso.). Repeated measures one-way analysis of variance (ANOVA) followed by Holm–Šídák’s multiple comparisons test. Adjusted P values as indicated. c, Representative flow cytometry plot of PD-1 expression on skin-expanded CD8+ T cells (left) and Vδ1+ cells (right). PD-1 gates were set on paired unstained samples. Representative of n = 5 independent donors. d, Summary flow cytometry data of PD-1 expression on Vδ1+ and CD8+ T cells in skin-expanded lymphocytes from n = 5 independent donors. Paired t-test. The boxes denote the medians and IQRs and the whiskers denote the minimum and maximum values. e, Summary flow cytometry data of PD-1 expression on skin-expanded Vδ1+ cells from n = 4 independent donors after 48-h culture in vitro in the presence of plate-bound IgG (control) or anti-TCR-Vδ1 antibody. Results were plotted as the percentage of Vδ1+ cells positive for PD-1 (left) and mean fluorescence intensity (MFI) of the PD-1+ Vδ1 population (right). Data points are paired according to donor. Paired t-test. f, PCA of cell populations sorted from skin-expanded lymphocytes from healthy skin of independent donors based on normalized counts of all 757 genes in the nCounter Immune Exhaustion Panel (excluding γδ and CD8+ T cell lineage genes and PDCD1; Methods) highlighted according to cell type (Vδ1+ cells, gray circles; CD8+ T cells, white squares). g, PCA of cell populations sorted from skin-expanded lymphocytes highlighted according to PD-1 status. Left, PD-1Vδ1+ (white circles, n = 8 independent donors) and PD-1+Vδ1+ (red circles, n = 8 independent donors) cells are highlighted. Right, PD-1CD8+ T (white squares, n = 9 independent donors) and PD-1+CD8+ T (red squares, n = 6 independent donors) cells are highlighted. All P values presented are two-sided. Source data
Fig. 3
Fig. 3. Expression of PD-1 marks a transcriptional program of tissue residency and survival in Vδ1+ cells, which is distinct from its associations in CD8+ T cells.
a, Differential expression of genes associated with a tissue-resident memory phenotype in human T cells in sorted skin-expanded lymphocytes, plotted as the mean log2 fold change between PD-1+ and PD-1Vδ1+ and CD8+ T cells (Vδ1+n = 7 paired independent donors; CD8+n = 6 paired independent donors). The color denotes directionality and the size of the circle denotes the fold change. Empty circles plotted where no samples within a cell type had detectable counts above the threshold (for example, SELL in Vδ1+ cells) are shown. Paired ratio t-test. The black border denotes P < 0.05. b, Gene expression of CD101 and ZNF683 in Vδ1+ (left) and CD8+ T (right) cells plotted according to PD-1 status. Data points are paired according to the independent donors. Paired ratio t-test. The dotted line signifies the detection threshold (normalized count = 20). c, Differential expression of genes encoding the surface markers of T cell exhaustion and transcription factors implicated in T cell survival, stemness and exhaustion in sorted skin-expanded lymphocytes. Plotted as the mean log2 fold change between PD-1+ and PD-1Vδ1+ and CD8+ T cells (Vδ1+, n = 7 paired independent donors; CD8+, n = 6 paired independent donors). The color denotes directionality and the size of the circle denotes the fold change. Paired ratio t-test. The black border denotes P < 0.05. d, Gene expression of BCL6, IRF4 and TOX in Vδ1+ (left) and CD8+ T (right) cells plotted according to PD-1 status. e, Gene expression of XCL1 and XCL2 in Vδ1+ (left) and CD8+ T (right) cells plotted according to PD-1 status. The data points are paired according to the independent donors. Paired ratio t-test. The dotted line signifies the detection threshold (normalized count = 20). All P values presented are two-sided. Source data
Fig. 4
Fig. 4. PD-1+Vδ1+ cells are functionally competent.
a, Differential expression of genes associated with pro-tumor and anti-tumor T cell functions in sorted skin-expanded lymphocytes, plotted as the mean log2 fold change between PD-1+ and PD-1 Vδ1+ and CD8+ T cells (Vδ1+, n = 7 paired independent donors; CD8+, n = 6 paired independent donors). The color denotes directionality and the size of the circle denotes the fold change. Empty circles plotted where no samples within a cell type had detectable counts above threshold are shown. Paired ratio t-test. The black border denotes P < 0.05. b, Gene expression of FASLG, GZMH, GZMK, PRF1, TNF, KLRK1, NCR1 and IL17A in Vδ1+ (left) and CD8+ T (right) cells plotted according to PD-1 status. The data points are paired according to the independent donors. Paired ratio t-test. The dotted lines denote the limit of detection (normalized count = 20). c, Summary flow cytometry data of surface CD107A and intracellular TNF, IFNγ and IL-17A staining of in vitro-activated, skin-expanded PD-1 (P, white circle) and PD-1+ (P+, black circle) Vδ1+ cells. Cells were activated in vitro with PBS (negative control), plate-bound MICA, plate-bound anti-TCR-Vδ1 or plate-bound anti-CD3 as indicated. The data points are paired according to n = 5 independent donors. Paired t-test. Source data
Fig. 5
Fig. 5. PD-1+Vδ1+ cells can be regulated by PD-1 engagement and derepressed by therapeutic CPI.
a, Summary flow cytometry data of surface CD107A, and intracellular TNF and IFNγ staining, in PD-1+Vδ1+ cells activated in vitro with plate-bound anti-TCR-Vδ1 antibody in the presence of control plate-bound mouse IgG (−), rhPD-L1 (P) or rhPD-L1 and atezolizumab (P + A). b, Summary flow cytometry data of surface CD107A, and intracellular TNF and IFNγ staining in PD-1+Vδ1+ cells activated in vitro with plate-bound anti-CD3 antibody in the presence of control plate-bound mouse IgG (−), rhPD-L1 (P) or rhPD-L1 and atezolizumab (P + A). c, Summary flow cytometry data of surface CD107A, and intracellular TNF and IFNγ staining, in PD-1+Vδ1+ cells activated in vitro with plate-bound MICA in the presence of control plate-bound mouse IgG (−), rhPD-L1 (P) or rhPD-L1 and atezolizumab (P + A). A repeated measures one-way ANOVA followed by a Holm–Šídák’s multiple comparisons test was used. The data points are paired according to n = 5 independent donors. Adjusted P values are shown. All P values presented are two-sided. Source data
Fig. 6
Fig. 6. Primary tumor-derived PD-1+Vδ1+ cells are variably regulated by PD-1 engagement and derepressed by therapeutic CPI.
a, Summary flow cytometry data of surface CD107A, and intracellular TNF and IFNγ staining, in NSCLC-expanded PD-1+Vδ1+ cells activated in vitro with plate-bound anti-CD3 antibody in the presence of control plate-bound mouse IgG (−), rhPD-L1 (P) or rhPD-L1 and atezolizumab (P + A). b, Summary flow cytometry data of surface CD107A, and intracellular TNF and IFNγ staining, in NSCLC-expanded PD-1+Vδ1+ cells activated in vitro with plate-bound MICA in the presence of control plate-bound mouse IgG (−), rhPD-L1 (P) or rhPD-L1 and atezolizumab (P + A). A repeated measures one-way ANOVA followed by a Holm–Šídák’s multiple comparisons test was used. The data points are paired according to n = 5 independent donors. Adjusted P values are shown. All P values presented are two-sided. Source data
Extended Data Fig. 1
Extended Data Fig. 1. RNAseq TCR V gene alignment.
A, Heatmap of TRAV and TRBV genes detected across all five melanoma public datasets analysed for Fig. 1 segregated by TRDV1 status (detected versus not detected) demonstrating a coordinated global lack of TCR V gene alignment. Unfilled cells represent undetected genes. Colour scale denotes Log2(TPM + 1) gene expression. B, Objective response rates of entire cohort of baseline cases (n = 216), baseline cases where TRDV1 was not detected (n = 89) and cases where TRDV1 was either below (TRDV1 low, n = 63) or above (TRDV1 high, n = 64) median (see Methods). Source data
Extended Data Fig. 2
Extended Data Fig. 2. Grid isolation and expansion enriches for skin-derived Vδ1+ cells and improves yield.
A, Representative flow cytometry dot plots demonstrating Vd1+ cell enrichment in skin-expanded lymphocytes (Exp) compared with direct enzymatic digestion (Enz) and grid isolation (Iso). Gated on live, single, CD45+ cells. Representative of n = 5 independent donors. B, Summary flow cytometry data of intracellular Ki-67 staining in grid-isolated Vδ1+ cells (Iso) and after 14 days of expansion (Exp). Ki-67 MFI index calculated as Ki-67 MFI for the whole Vδ1+ population divided by the MFI of the isotype control for the same population. Paired t test. C, Summary data of absolute numbers of Vδ1+ cells obtained from a single grid at the end of 3 weeks of grid isolation (Iso) and at the end of 3 weeks of expansion (Exp). Ratio paired t test. Datapoints represent individual skin donors. All P values presented are two-sided. For box plots, boxes denote medians and interquartile ranges, and whiskers denote minimum and maximum values. Source data
Extended Data Fig. 3
Extended Data Fig. 3. NanoString transcriptomic analysis of skin-derived grid-expanded Vδ1+ and CD8+ T cells.
A, Representative gating strategy for sorting PD-1- and PD-1 + Vδ1+ and CD8+ T cells from bulk, skin-expanded lymphocytes. PD-1 gate set on fluorescence minus one (FMO) control (blue). PD-1- and PD-1 + Vδ1+ and CD8+ T cells (red) were sorted and lysed in RLT buffer for downstream analysis using the NanoString nCounter Immune Exhaustion Panel. Representative of n = 9 independent donors. B, Expression of anticipated canonical lineage genes in each sorted population assessed by NanoString. Dotted line = detection threshold (normalised count = 20). Datapoints represent gene expression in each cell type sorted from individual donors. Source data
Extended Data Fig. 4
Extended Data Fig. 4. PD-1 expression on Vδ1+ cells is associated with distinct biology compared to its expression on CD8+ T cells.
A, PC1 from Fig. 2F plotted by cell type. Datapoints paired by PD-1 status and donor (n = 14 pairs). Paired t test. B, PC2 from Fig. 2G plotted by cell type and PD-1 status and paired by donor (Vδ1 n = 7 pairs, CD8 n = 6 pairs). Paired t test. All P values presented are two-sided. n.s. = not significant. Source data
Extended Data Fig. 5
Extended Data Fig. 5. In vitro activation of skin-expanded Vδ1+ cells.
A, Schema of in vitro activation assay. Plates were coated with anti-TCR-Vδ1, anti-CD3 or MICA along with either mouse IgG (control) or rhPD-L1 overnight. Atezolizumab was added 30 minutes prior to addition of skin-expanded lymphocytes to relevant wells. Skin-expanded lymphocytes were seeded in the presence of brefeldin A and incubated for 5 hours at 37oC before staining for flow cytometry and acquisition. Representative flow cytometry plots of surface CD107A, and intracellular TNFα, IFNγ and IL-17A staining after activation with B, MICA, C, anti-TCR-Vδ1 or D, anti-CD3. Gated either PD-1- or PD-1 + Vδ1+ cells. Representative of n = 5 independent donors.
Extended Data Fig. 6
Extended Data Fig. 6. PD-1+ CD8+ T cells are suppressed after PD-1 engagement with variable de-repression by therapeutic CPI.
Summary flow cytometry data of surface CD107A, and intracellular TNFα and IFNγ staining in skin-expanded PD-1+ CD8+ T cells activated in vitro with plate-bound anti-CD3 in the presence of control plate-bound mouse IgG (-), rhPD-L1 (P), or rhPD-L1 and atezolizumab (P + A). Repeated measures one-way ANOVA followed by Holm-Sidak’s multiple comparisons test. Datapoints paired by n = 5 independent donors. Adjusted P values indicated. All P values presented are two-sided. n.s. = not significant. Source data
Extended Data Fig. 7
Extended Data Fig. 7. Functional regulation of primary NSCLC-expanded Vδ1+ and CD8 T+ cells by PD-1.
A, Donor level flow cytometry staining of surface CD107A, and intracellular TNFα, IFNγ and IL-17A in NSCLC-expanded PD-1+ Vδ1+ cells activated in vitro with plate-bound anti-CD3 (top) and MICA (bottom) in the presence of control plate-bound mouse IgG (-), rhPD-L1 (P), or rhPD-L1 and atezolizumab (P + A). B, Donor level flow cytometry staining of surface CD107A, and intracellular TNFα, IFNγ and IL-17A in PD-1+ NSCLC-expanded CD8+ T cells activated in vitro with plate-bound anti-CD3 (top) and MICA (bottom) in the presence of control plate-bound mouse IgG (-), rhPD-L1 (P), or rhPD-L1 and atezolizumab (P + A). Cell values and shading denote percentage of parent gate (PD-1+ Vδ1 cells or PD-1+ CD8+ T cells) positive for stain. C, Summary flow cytometry data of surface CD107A, and intracellular TNFα and IFNγ staining in NSCLC-expanded PD-1+ CD8+ T cells activated in vitro with plate-bound anti-CD3 antibody in the presence of control plate-bound mouse IgG (-), rhPD-L1 (P), or rhPD-L1 and atezolizumab (P + A). Repeated measures one-way ANOVA followed by Holm-Sidak’s multiple comparisons test. Datapoints paired by n = 5 independent donors. Adjusted P values indicated. All P values presented are two-sided. n.s. = not significant. Source data

References

    1. Schadendorf D, et al. Pooled analysis of long-term survival data from phase II and phase III trials of ipilimumab in unresectable or metastatic melanoma. J. Clin. Oncol. 2015;33:1889–1894. doi: 10.1200/JCO.2014.56.2736. - DOI - PMC - PubMed
    1. Wolchok JD, et al. Long-term outcomes with nivolumab plus ipilimumab or nivolumab alone versus ipilimumab in patients with advanced melanoma. J. Clin. Oncol. 2022;40:127–137. doi: 10.1200/JCO.21.02229. - DOI - PMC - PubMed
    1. Long GV, et al. Epacadostat plus pembrolizumab versus placebo plus pembrolizumab in patients with unresectable or metastatic melanoma (ECHO-301/KEYNOTE-252): a phase 3, randomised, double-blind study. Lancet Oncol. 2019;20:1083–1097. doi: 10.1016/S1470-2045(19)30274-8. - DOI - PubMed
    1. Larkin J, et al. Five-year survival with combined nivolumab and ipilimumab in advanced melanoma. N. Engl. J. Med. 2019;381:1535–1546. doi: 10.1056/NEJMoa1910836. - DOI - PubMed
    1. Tumeh PC, et al. PD-1 blockade induces responses by inhibiting adaptive immune resistance. Nature. 2014;515:568–571. doi: 10.1038/nature13954. - DOI - PMC - PubMed

Publication types

MeSH terms

Substances