. 2024 Jan 3;10(1):6.
doi: 10.1038/s41531-023-00602-0.

Resting-state EEG measures cognitive impairment in Parkinson's disease

Affiliations

Resting-state EEG measures cognitive impairment in Parkinson's disease

Md Fahim Anjum et al. NPJ Parkinsons Dis. .

Abstract

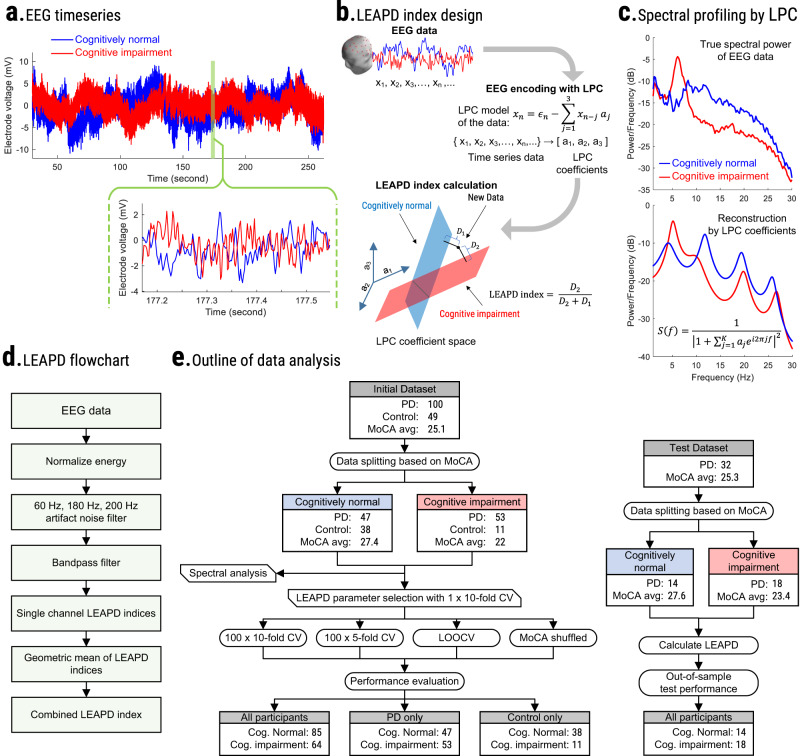
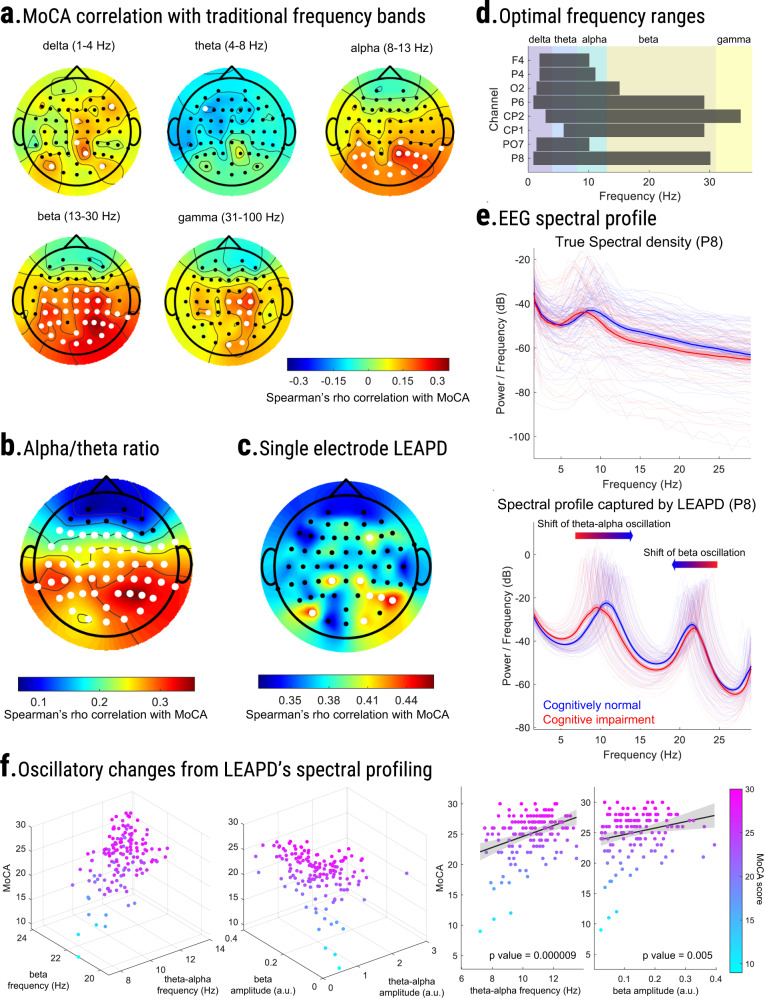
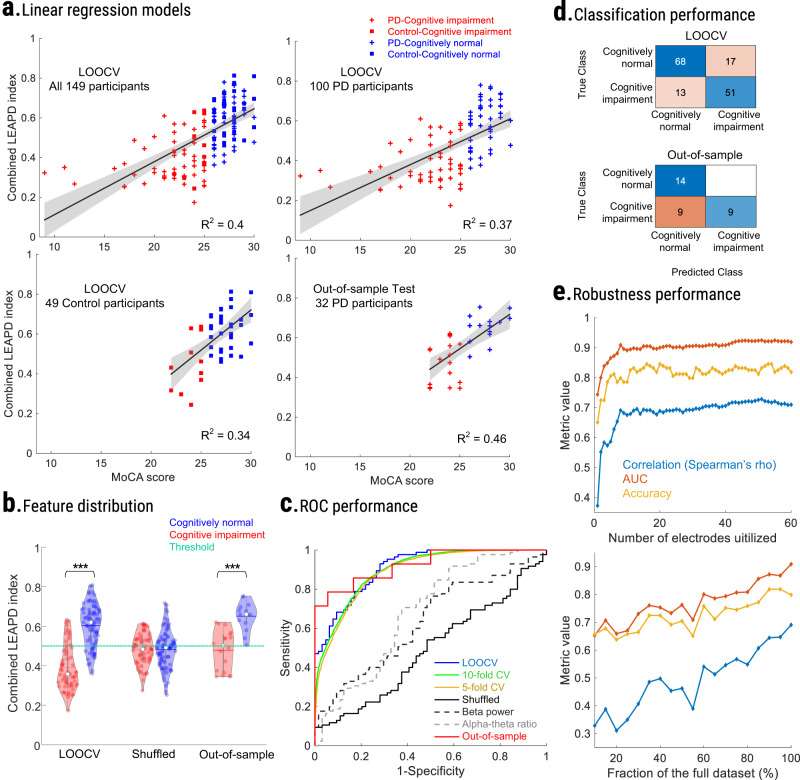
Cognitive dysfunction is common in Parkinson's disease (PD). We developed and evaluated an EEG-based biomarker to index cognitive functions in PD from a few minutes of resting-state EEG. We hypothesized that synchronous changes in EEG across the power spectrum can measure cognition. We optimized a data-driven algorithm to efficiently capture these changes and index cognitive function in 100 PD and 49 control participants. We compared our EEG-based cognitive index with the Montreal cognitive assessment (MoCA) and cognitive tests across different domains from National Institutes of Health (NIH) Toolbox using cross-validations, regression models, and randomization tests. Finally, we externally validated our approach on 32 PD participants. We observed cognition-related changes in EEG over multiple spectral rhythms. Utilizing only 8 best-performing electrodes, our proposed index strongly correlated with cognition (MoCA: rho = 0.68, p value < 0.001; NIH-Toolbox cognitive tests: rho ≥ 0.56, p value < 0.001) outperforming traditional spectral markers (rho = -0.30-0.37). The index showed a strong fit in regression models (R2 = 0.46) with MoCA, yielded 80% accuracy in detecting cognitive impairment, and was effective in both PD and control participants. Notably, our approach was equally effective (rho = 0.68, p value < 0.001; MoCA) in out-of-sample testing. In summary, we introduced a computationally efficient data-driven approach for cross-domain cognition indexing using fewer than 10 EEG electrodes, potentially compatible with dynamic therapies like closed-loop neurostimulation. These results will inform next-generation neurophysiological biomarkers for monitoring cognition in PD and other neurological diseases.


Conflict of interest statement

The authors declare no competing interests.

Figures

Fig. 1
Fig. 1. Methodology of the study.
a Example of EEG time series comparison between a PD participant with normal cognition (blue) and a participant with cognitive impairment (red) from a representative electrode P8. b Example illustration of single-electrode LEAPD index: EEG data (x1,x2,,xn,) are encoded by linear predictive coding (LPC) which fits the data into a 3rd order autoregressive model where each sample (xn) is modeled by the weighted sum of 3 past consecutive samples (middle). These weights (a1,a2,a3) are LPC coefficients that represent the EEG data and become a single point in a high-dimensional LPC coefficient space (bottom; LPC coefficients as axes). After finding separate affine subspaces for cognitively impaired (red) and cognitively normal (blue) participants, LEAPD is calculated for new data by encoding it in that space and finding the relative distances from these affine subspaces. D1 and D2 are the distances from the new data point to the cognitively normal and cognitively impaired affine subspace respectively. c Illustration of spectral profiling via LPC: true spectral power (top) of representative EEG data (P8) from a cognitively normal (blue) and cognitively impaired participant (red). These power spectra show changes in theta, alpha, and beta rhythms related to cognition which are captured by LPC shown by the reconstruction of spectral power from LPC coefficients (bottom). EEG data were bandpass filtered (2–29 Hz). d Steps for combined LEAPD index generation from EEG data from multiple electrodes. e Schematic and data analysis outline of the study for LEAPD and traditional EEG spectral analysis with randomization test and cross-validations for MoCA (left) using 149 participants (Table 1) and outline of out-of-sample validation test (right) using a separate test dataset of 32 PD participants (Table 1). PD Parkinson’s disease. LOOCV leave-one-out cross-validation. MoCA Montreal Cognitive Assessment.
Fig. 2
Fig. 2. EEG feature analysis and parameter choice.
Topographic plots of age-adjusted Spearman’s rho correlation between MoCA scores and a traditional frequency bands, b Log-spectral ratio of alpha (8–13 Hz) and theta (4–8 Hz) rhythm. Electrodes marked as white signifies a statistically significant correlation (p value < 0.05). c Topographic plot of correlations between single-electrode LEAPD indices and MoCA scores during parameter selection for combined LEAPD index using 10-fold single-round cross-validation with the 149 participants (Table 1). Selected electrodes are marked as white. These were utilized across all participants in performance evaluations and analyses except the robustness performance of LEAPD. d Optimal frequency ranges that resulted in the maximum correlation between MoCA and LEAPD in a single-round 10-fold cross-validation during the parameter optimization of LEAPD at selected EEG electrodes. Vertical color blocks represent canonical frequency bands. e Comparison of spectral densities between cognitively impaired (red) and cognitively normal (blue) groups from single-electrode (P8) raw EEG data (top) and EEG-encoded linear predictive coding (LPC) models (bottom) capturing unique spectral profiles with dominant oscillations in theta-alpha (7–13 Hz) and beta rhythms. EEG data were bandpass filtered (2–29 Hz) before the encoding and LPC order was 7. Thick lines show mean spectral densities; lighter lines are individual spectral densities, and shaded areas show the standard error of the mean. The arrows mark the directions of the shifts of the spectral peaks from cognitive impairment to normal cognition. f Frequencies and amplitudes of the oscillatory modes captured by LPC in panel e vary with MoCA scores in a statistically significant manner: 3D scatter plots (left) of theta-alpha (7−13 Hz) and beta oscillations (13–25 Hz) captured by LPC with MoCA scores (z axes) in oscillation frequency (Hz) and amplitude (a.u.). Each dot represents data from one participant and is colored according to MoCA (color bar; right). The 2D scatter plots (right) show linear regression models where theta-alpha oscillation frequency and beta oscillation amplitude increase with MoCA scores. Data in all panels are from 149 participants (Table 1).
Fig. 3
Fig. 3. Performance evaluation of LEAPD.
a Scatter plot for linear regression models between MoCA and combined LEAPD indices for all 149 participants (top left; Table 1), Parkinson’s disease-only (top right; n = 100), and controls (bottom left; n = 49) during LOOCV and for 32 out-of-sample PD participants (bottom right; Table 1). All models were statistically significant (Table 2). b Violin plots of combined LEAPD indices (y axis) for cognitively impaired (red) and cognitively normal (blue) participants during LOOCV with 149 participants (Table 1) before (left) and after MoCA score shuffling among participants (middle) and during out-of-sample test with 32 PD (right). The green dotted line represents the detection cutoff (value = 0.5). In all cases, *** indicates group-level rank-sum test p value < 0.001. c Receiver operative characteristic (ROC) curve for LEAPD in various cross-validations as well as in shuffled MoCA data (solid black), and for the top-performing traditional spectral features (dashed lines; beta power and alpha/theta log ratio at P4) in data from 149 participants. In addition, ROC performance in out-of-sample test with 32 PD was compared (red). d Classification performances of LEAPD with confusion matrices for 149 participants during LOOCV (top) and 32 PD participants (bottom) during out-of-sample test. e Robustness of LEAPD performance: Spearman’s rho correlation with MoCA scores (blue), classifier accuracy (yellow), and AUC (red) performance of LEAPD while varying the number of EEG electrodes utilized for the combined LEAPD index (top). The x axis is the number of EEG electrodes utilized, and the y axis is the metric (AUC, classifier accuracy, or Spearman’s rho value). LEAPD performance in terms of correlation with MoCA (blue), classifier accuracy (yellow), and AUC (red) while truncating the dataset (bottom). The x axis is the size of the dataset after truncation compared to the original size in percentage. Data in panel e from 149 participants (Table 1). PD Parkinson’s disease, LOOCV leave-one-out cross-validation, CV cross-validation.

Update of

References

    1. Foltynie T, Brayne CEG, Robbins TW, Barker RA. The cognitive ability of an incident cohort of Parkinson’s patients in the UK. The CamPaIGN study. Brain. 2004;127:550–560. doi: 10.1093/brain/awh067. - DOI - PubMed
    1. Muslimović D, Post B, Speelman JD, Schmand B. Cognitive profile of patients with newly diagnosed Parkinson disease. Neurology. 2005;65:1239–1245. doi: 10.1212/01.wnl.0000180516.69442.95. - DOI - PubMed
    1. Aarsland D, Andersen K, Larsen JP, Lolk A. Prevalence and characteristics of dementia in Parkinson disease: an 8-year prospective study. Arch. Neurol. 2003;60:387–392. doi: 10.1001/archneur.60.3.387. - DOI - PubMed
    1. Hely MA, Reid WGJ, Adena MA, Halliday GM, Morris JGL. The Sydney multicenter study of Parkinson’s disease: The inevitability of dementia at 20 years: twenty year Sydney Parkinson’s study. Mov. Disord. 2008;23:837–844. doi: 10.1002/mds.21956. - DOI - PubMed
    1. Litvan I, et al. Diagnostic criteria for mild cognitive impairment in Parkinson’s disease: movement disorder society task force guidelines. Mov. Disord. 2012;27:349–356. doi: 10.1002/mds.24893. - DOI - PMC - PubMed