. 2024 Jan 3;26(1):12.
doi: 10.1186/s13075-023-03220-6.

Transcriptional profiling of human cartilage endplate cells identifies novel genes and cell clusters underlying degenerated and non-degenerated phenotypes

Affiliations

Transcriptional profiling of human cartilage endplate cells identifies novel genes and cell clusters underlying degenerated and non-degenerated phenotypes

Kyle Kuchynsky et al. Arthritis Res Ther. .

Abstract

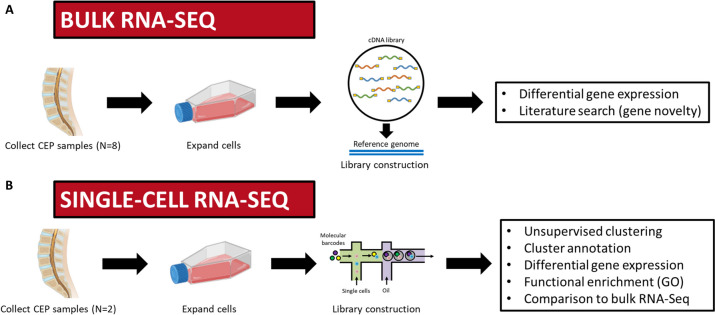
Background: Low back pain is a leading cause of disability worldwide and is frequently attributed to intervertebral disc (IVD) degeneration. Though the contributions of the adjacent cartilage endplates (CEP) to IVD degeneration are well documented, the phenotype and functions of the resident CEP cells are critically understudied. To better characterize CEP cell phenotype and possible mechanisms of CEP degeneration, bulk and single-cell RNA sequencing of non-degenerated and degenerated CEP cells were performed.

Methods: Human lumbar CEP cells from degenerated (Thompson grade ≥ 4) and non-degenerated (Thompson grade ≤ 2) discs were expanded for bulk (N=4 non-degenerated, N=4 degenerated) and single-cell (N=1 non-degenerated, N=1 degenerated) RNA sequencing. Genes identified from bulk RNA sequencing were categorized by function and their expression in non-degenerated and degenerated CEP cells were compared. A PubMed literature review was also performed to determine which genes were previously identified and studied in the CEP, IVD, and other cartilaginous tissues. For single-cell RNA sequencing, different cell clusters were resolved using unsupervised clustering and functional annotation. Differential gene expression analysis and Gene Ontology, respectively, were used to compare gene expression and functional enrichment between cell clusters, as well as between non-degenerated and degenerated CEP samples.

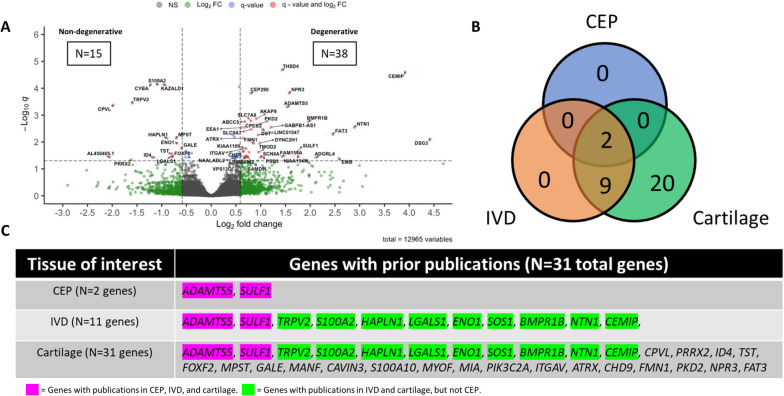
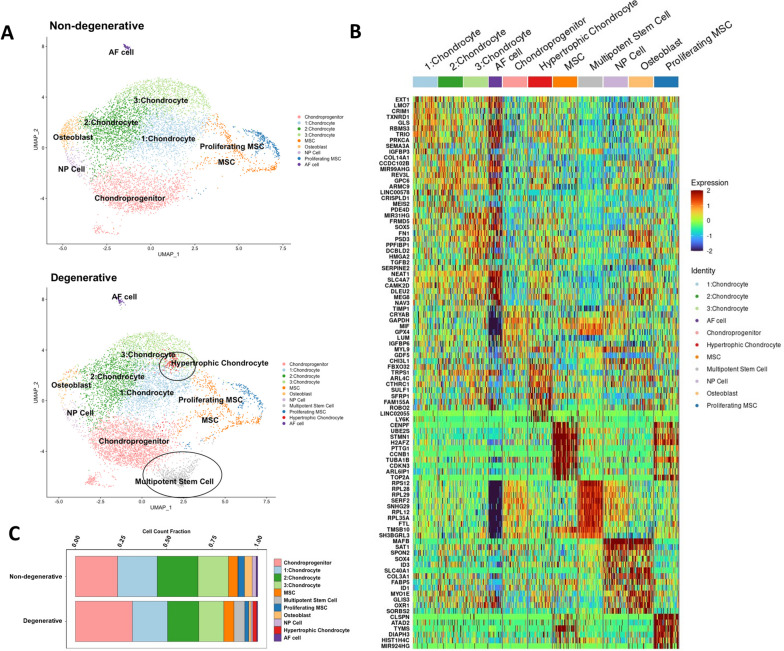
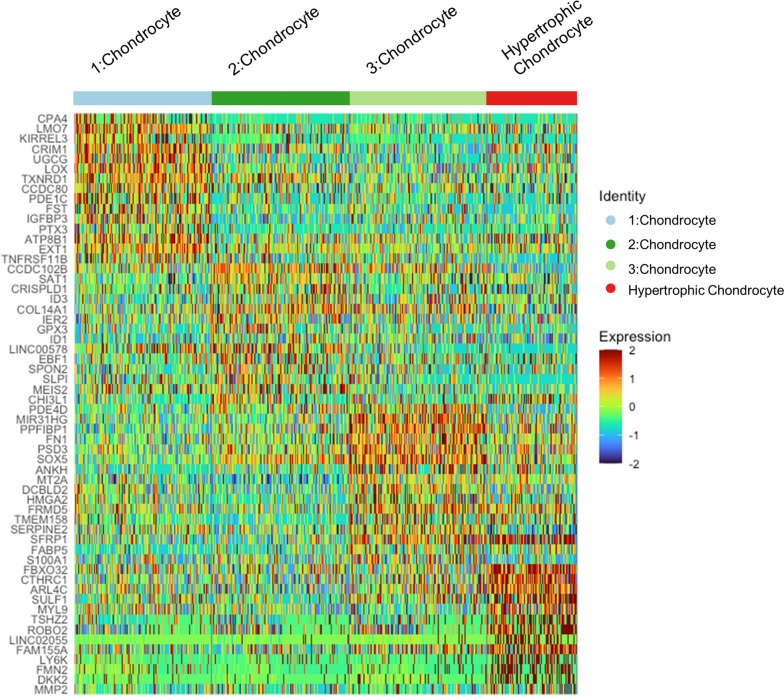
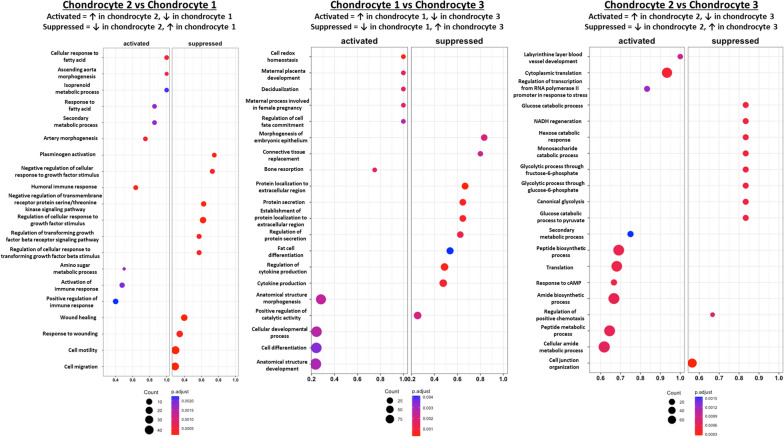
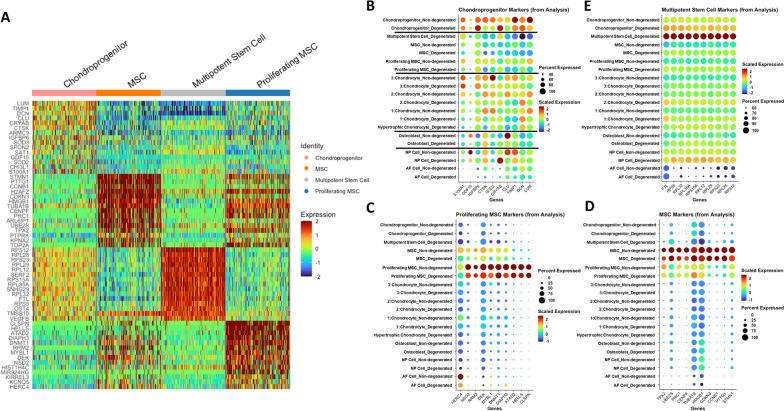
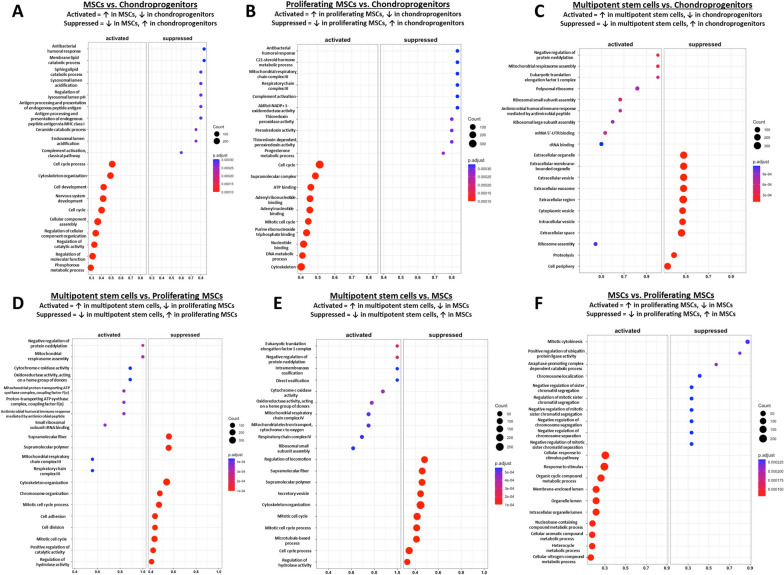
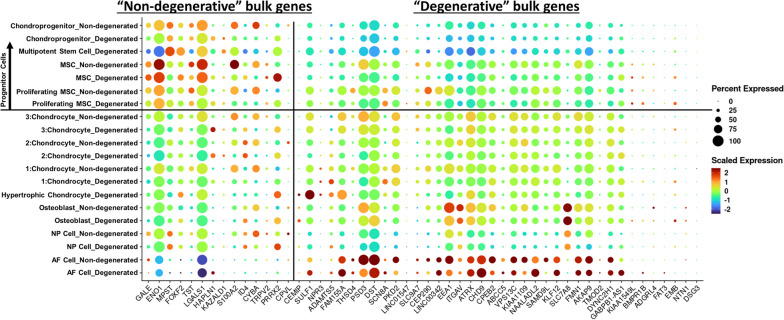
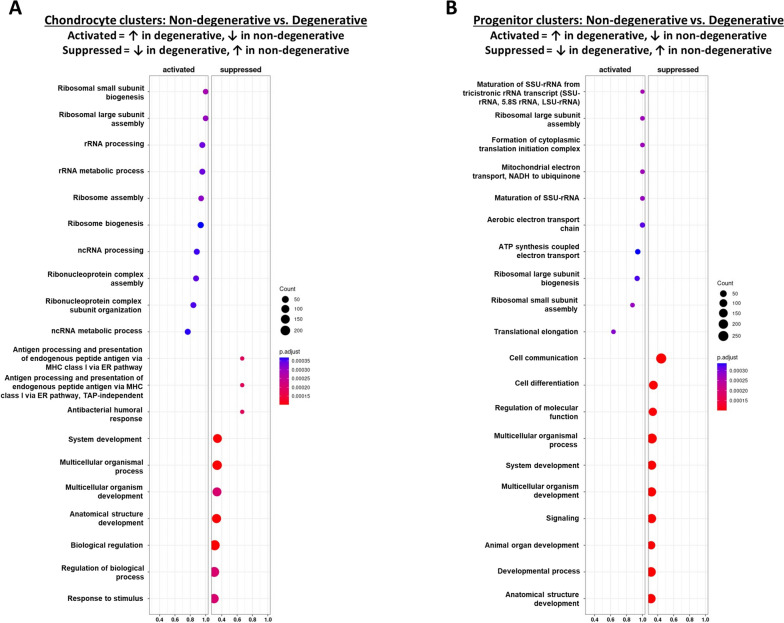
Results: Bulk RNA sequencing revealed 38 genes were significantly upregulated and 15 genes were significantly downregulated in degenerated CEP cells relative to non-degenerated cells (|fold change| ≥ 1.5). Of these, only 2 genes were previously studied in CEP cells, and 31 were previously studied in the IVD and other cartilaginous tissues. Single-cell RNA sequencing revealed 11 unique cell clusters, including multiple chondrocyte and progenitor subpopulations with distinct gene expression and functional profiles. Analysis of genes in the bulk RNA sequencing dataset showed that progenitor cell clusters from both samples were enriched in "non-degenerated" genes but not "degenerated" genes. For both bulk- and single-cell analyses, gene expression and pathway enrichment analyses highlighted several pathways that may regulate CEP degeneration, including transcriptional regulation, translational regulation, intracellular transport, and mitochondrial dysfunction.

Conclusions: This thorough analysis using RNA sequencing methods highlighted numerous differences between non-degenerated and degenerated CEP cells, the phenotypic heterogeneity of CEP cells, and several pathways of interest that may be relevant in CEP degeneration.

Keywords: Bulk RNA-Seq; Cartilage endplate; Degeneration; Human; Intervertebral disc; Single-cell RNA-Seq.


Conflict of interest statement

The authors declare no competing interests.

Figures

Fig. 1
Fig. 1
Conceptual workflow of RNA sequencing experiments. For both bulk RNA sequencing (A) and single-cell RNA sequencing (B), CEP cells from human cadaveric lumbar spines were isolated, expanded, and processed. A list of analyses performed within each dataset are also listed. Figure created with licensed Biorender.com software
Fig. 2
Fig. 2
Bulk RNA sequencing results. A The breakdown of D.E. genes between non-degenerated and degenerated CEP samples is depicted by a volcano plot. Positive F.C. indicates upregulation in degenerated samples, whereas negative F.C. indicates upregulation in non-degenerated samples. Thresholds for upregulation were set at |F.C.| ≥ 1.5 and significance was set at q < 0.05. Boxed numbers indicate number of significantly D.E. genes in each compartment of plot. B The results of the literature review are summarized by a Venn diagram showing the number of genes previously studied in the CEP, the IVD, or cartilage. C Breakdown of the genes previously studied in each tissue of interest. Purple-highlighted genes were previously studied in all three tissues and green-highlighted genes were previously studied in the IVD and cartilage only. F.C., fold change; D.E., differentially expressed
Fig. 3
Fig. 3
Single-cell RNA sequencing results. A Unsupervised clustering of non-degenerated (upper) and degenerated (lower) CEP samples reveals sample heterogeneity. Most clusters are shared between both samples, though hypertrophic chondrocyte and multipotent stem cell clusters were only present in the degenerated sample (black circles). Cluster annotations were determined from manually curated markers for different cell types predicted to reside within the CEP. B Heatmap of differentially expressed genes across all clusters. C A breakdown of the cellular composition of each sample, by percentage
Fig. 4
Fig. 4
Heatmap of differentially expressed genes across all chondrocyte clusters. Cells from the non-degenerated and degenerated samples were pooled in this analysis
Fig. 5
Fig. 5
Gene ontology comparing functional enrichment of biological processes between different chondrocyte clusters. From left to right: chondrocyte 2 vs. chondrocyte 1, chondrocyte 1 vs. chondrocyte 3, chondrocyte 2 vs. chondrocyte 3. Cells from the non-degenerated and degenerated samples were pooled in this analysis
Fig. 6
Fig. 6
Comparison of progenitor cell clusters in all samples. A Heatmap of differentially expressed genes across all progenitor cell clusters. Cells from the non-degenerated and degenerated samples were pooled in this analysis. BE Dot plots of top differentially expressed markers for B chondroprogenitor cells, C proliferating MSCs, D MSCs, and E multipotent stem cells from the current analysis. Black lines on B separate chondroprogenitors, MSCs, and chondrocyte clusters
Fig. 7
Fig. 7
Gene ontology of biological processes comparing different progenitor cell clusters. A MSCs vs. chondroprogenitors. B Proliferating MSCs vs. chondroprogenitors. C Multipotent stem cells vs. chondroprogenitors. D Multipotent stem cells vs. proliferating MSCs. E Multipotent stem cells vs. MSCs. F MSCs vs. proliferating MSCs. For each figure, a description of “Activated” and “Suppressed” is provided
Fig. 8
Fig. 8
Dot plot of significantly D.E. markers with |F.C.| ≥ 1.5 identified in bulk RNA-Seq analysis. Vertical line separates the markers on the x-axis between “non-degenerated” bulk genes (left, F.C. < − 1.5) and “degenerative” bulk genes (right, F.C. > + 1.5). Horizontal line separates the clusters on the y-axis between progenitor cells (above) and more differentiated cells (below). D.E., differentially expressed; F.C., fold change
Fig. 9
Fig. 9
Gene ontology of biological processes comparing non-degenerated and degenerated cell clusters. A Non-degenerated chondrocytes 1, 2, and 3 (pooled) vs. degenerated chondrocytes 1, 2, and 3 (pooled). B Non-degenerated chondroprogenitors, MSCs, and proliferating MSCs (pooled) vs. degenerated chondroprogenitors, MSCs, and proliferating MSCs (pooled). For each panel, a description of “Activated” and “Suppressed” is provided

References

    1. James SL, et al. Global, regional, and national incidence, prevalence, and years lived with disability for 354 diseases and injuries for 195 countries and territories, 1990–2017: a systematic analysis for the Global Burden of Disease Study 2017. Lancet. 2018;392:1789–1858. doi: 10.1016/S0140-6736(18)32279-7. - DOI - PMC - PubMed
    1. Andersson G. Epidemiological features of chronic low-back pain. 1999. - PubMed
    1. Wu A, et al. Global low back pain prevalence and years lived with disability from 1990 to 2017: estimates from the Global Burden of Disease Study 2017. Ann Transl Med. 2020;8:299–299. doi: 10.21037/atm.2020.02.175. - DOI - PMC - PubMed
    1. Katz JN. Lumbar disc disorders and low-back pain: socioeconomic factors and consequences. J Bone Joint Surg Am. 2006;88:21–24. - PubMed
    1. Ferreira ML, et al. Global, regional, and national burden of low back pain, 1990–2020, its attributable risk factors, and projections to 2050: a systematic analysis of the Global Burden of Disease Study 2021. Lancet Rheumatol. 2023;5:e316–e329. doi: 10.1016/S2665-9913(23)00098-X. - DOI - PMC - PubMed

Publication types

MeSH terms