. 2023 Dec 21:11:rbad111.
doi: 10.1093/rb/rbad111. eCollection 2024.

Fibrous topology promoted pBMP2-activated matrix on titanium implants boost osseointegration

Affiliations

Fibrous topology promoted pBMP2-activated matrix on titanium implants boost osseointegration

Ting He et al. Regen Biomater. .

Abstract

Titanium (Ti) implants have been extensively used after surgical operations. Its surface bioactivity is of importance to facilitate integration with surrounding bone tissue, and ultimately ensure stability and long-term functionality of the implant. The plasmid DNA-activated matrix (DAM) coating on the surface could benefit osseointegration but is still trapped by poor transfection for further application, especially on the bone marrow mesenchymal stem cells (BMSCs) in vivo practical conditions. Herein, we constructed a DAM on the surface of fibrous-grained titanium (FG Ti) composed of phase-transition lysozyme (P) as adhesive, cationic arginine-rich lipid (RLS) as the transfection agent and plasmid DNA (pDNA) for bone morphology protein 2 (BMP2) expression. The cationic lipid RLS improved up to 30-fold higher transfection than that of commercial reagents (Lipofectamine 2000 and polyethyleneimine) on MSC. And importantly, Ti surface topology not only promotes the DAM to achieve high transfection efficiency (∼75.7% positive cells) on MSC due to the favorable combination but also reserves its contact induction effect for osteoblasts. Upon further exploration, the fibrous topology on FG Ti could boost pDNA uptake for gene transfection, and cell migration in MSC through cytoskeleton remodeling and induce contact guidance for enhanced osteointegration. At the same time, the cationic RLS together with adhesive P were both antibacterial, showing up to 90% inhibition rate against Escherichia coli and Staphylococcus aureus with reduced adherent microorganisms and disrupted bacteria. Finally, the FG Ti-P/pBMP2 implant achieved accelerated bone healing capacities through highly efficient gene delivery, aligned surface topological structure and increased antimicrobial properties in a rat femoral condylar defect model.

Keywords: aligned surface topology; antibacterial activity; osseointegration; plasmid DNA-activated matrix.


Figures

None
Graphical abstract
Figure 1.
Figure 1.
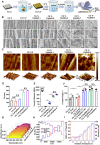
Fabrication and characterization of the DAM composed of multilayered film (pDNA/RLS)6 on different Ti samples. (A) Illustration of the preparation process for DAM on Ti substrates. P was first deposited on the Ti, followed by sequential and repeated adsorption of pDNA and RLS n cycles to obtain the multilayer film (pDNA/RLS)n. (B) FE-SEM images of the surface morphology of various Ti samples. (C) 2D and 3D AFM images of different Ti samples (20 μm ×20 μm). (D) Root mean square roughness (Rq) of the different substrates obtained by AFM. (E) Young’s modulus of DAM films was obtained by AFM imaging of indentations and calculated by the Herz sphere model. The film was built up on the same specimen and five random spots were scanned. (F) The water contact angle degree (°) and image of different Ti samples. (G) Detection of the pDNA adsorption as a function of bilayer number during the multi-layer DAM fabrication by the solid UV-vis using the diffuse reflection module. (H) The real-time shifts of frequency (ΔF) and dissipation (ΔD) and (I) mass change per unit area (ΔM, μg/cm2) and corresponding thickness (nm) during the multi-layer fabrication, which were monitored by the QCM-D sensor. *P < 0.05, NS, no significance.
Figure 2.
Figure 2.
Transfection efficiency and contact guidance phenomenon of DAM on different Ti samples. (A) Fluorescence microscopy pictures and (B) MFI analysis of BMSCs and MC3T3-E1 cells transfected with pEGFP on different Ti samples. Scale bar: 100 μm. (C) Representative morphology of BMSCs observed by CLSM with phalloidine stained cytoskeleton protein F-actin (red) and DAPI stained nucleus (blue) after 36 h-culture on different Ti substrates. Scale bars: 50 or 10 μm. White dotted box: magnification areas. (D) Cell-orientation analysis on different Ti samples, calculated by the cell occurrence frequency (%) and angles (°) along the rolling direction (RD) of FG Ti and arbitrary direction of CG Ti. (E) Analysis of the BMSCs movement. The migration trajectory of BMSCs on different Ti surfaces was monitored by a live cell imaging system. The cells were imaged at 5-min intervals for 12 h. (F) Scatterplot and box plot of cell migration velocity and net displacements, together with the normal curve (n = 50). In the box plots, the median is represented by the middle line, while the top and bottom of the box correspond to the 75th and 25th percentiles, respectively. The whiskers extend to the 90th and 10th percentiles, providing an overview of the data’s spread. (G) CLSM observation of uptake of Cy5-labeled RLS/pGL3 lipoplexes by BMSCs on CG Ti and FG Ti substrates after 2–6 h incubation. Red: Cy5-labeled RLS/pGL3 lipoplexes, green: FITC-phalloidin-labeled F-actin, blue: DAPI-labeled nucleus. Scale bar: 50 μm. (H) Internalized Cy5-labeled RLS/pGL3 complexes of BMSCs on CG Ti and FG Ti substrates after 6 h incubation, detected by flow cytometry. *P < 0.05, NS, no significance.
Figure 3.
Figure 3.
The osteogenic capacity of BMSCs on different Ti samples in vitro. (A) Q-PCR analysis of BMP2 mRNA levels in BMSCs cells cultured on different Ti substrates for 48 h. (B) WB band and (C) related semi-quantitative analysis of BMP2 protein levels in BMSCs cells transfected with RLS/pBMP2 lipoplexes at a preferred N/P ratio of 30 for 48 h. β-actin was considered as a housekeeping control. (D) ARS staining of BMSCs cultured on the different Ti surfaces for 7 days. Scale bar, 50 μm. (E) the relative mRNA expression of the osteogenic marker gene in BMSCs cultured on the different DAM-deposited Ti samples for 3, 7 and 14 days. All values were standardized according to the expression of GAPDH. *P < 0.05, NS, no significance.
Figure 4.
Figure 4.
Antimicrobial evaluation of different Ti substrates in vitro. (A) E.coli and S.aureus colony formation on LB agarose plates for 18 h after culturing with different Ti substrates for 12 h. Antibacterial rates of (B) E.coli and (C) S.aureus were calculated by colony numbers normalized to the control group of FG Ti, n = 3. (D) FE-SEM observation of the early morphology of S.aureus and E.coli adhered on different Ti substrates for 24 h. White boxed regions were enlarged at the upper right corner. Scale bars: 5 or 2 μm. (E) TEM images of bacterial sections after being treated with PBS and RLS solution (1 mg/ml) for 1 h. Black dotted box: the magnification area. Scale bars: 1 μm, 200 nm. *P < 0.05, NS, no significance.
Figure 5.
Figure 5.
Osseointegration of FG Ti, FG Ti-P/pEGFP-6, FG Ti-P/pBMP2-6 rods at the third and sixth weeks after implantation. The implants were screwed into rods with a diameter of 2.0 mm, and length of 4.0 mm and placed at the rat femoral condyle. (A) 3D micro-CT reconstruction images of femoral condyles captured from various angles (front view, left view, rearview), showing the status of the implants and osteointegration progress after surgery at indicated time points. The acquisitions were performed on a micro-CT system at a resolution of 18 μm at 90 kV, 80 μA. (B) Micro-CT quantitative analyses of the osteogenesis indices, including BV/TV, BMC, BMD, Tb. N, Tb. Th, Tb. Sp in the third and sixth weeks using Mimics Medical 21.0 software within 1 mm around the implants (n = 5). pEGFP is a control for the osteogenic gene pBMP2. *P < 0.05, NS, no significance.
Figure 6.
Figure 6.
Bone integration effect of different Ti implants in the sixth week after surgery. (A) Optical microscope images of bone tissue around the different implants stained with toluidine blue on hard-tissue slices. Yellow dotted box: magnification areas. White arrows: new bone. Scale bars: 600 μm, 250 μm. (B) CLSM images of the new bone formation tissue around the implants of FG Ti, FG Ti-P/pEGFP-6 and FG Ti-P/pBMP2-6 by CA and TE labeling. The rats were serially intraperitoneally injected with CA (1%, w/w, 30 mg/kg) and TE (1%, w/w, 30 mg/kg) for 14 and 3 days before execution, respectively. The tissue sections were observed by CLSM with 488 nm (CA) and 405 nm (TE) excitation, respectively. Scale bar: 50 μm. The red arrows referred to the spacing between green and yellow fluorescence. Quantitative statistics of (C) new bone areas and (D) BIC by toluidine blue staining and (E) bone mineralization deposition rates (MAR) from CA and TE fluorescence labeling. n = 5, *P < 0.05.

Similar articles

Cited by

References

    1. Ma Z, Liu B, Li S, Wang X, Li J, Yang J, Tian S, Wu C, Zhao D.. A novel biomimetic trabecular bone metal plate for bone repair and osseointegration. Regener Biomater 2023;10:rbad003. - PMC - PubMed
    1. He Y, Yao M, Zhou J, Xie J, Liang C, Yin D, Huang S, Zhang Y, Peng F, Cheng S.. Mg(OH)2 nanosheets on Ti with immunomodulatory function for orthopedic applications. Regener Biomater 2022;9:rbac027. - PMC - PubMed
    1. Guo C, Wu J, Zeng Y, Li H.. Construction of 3D bioprinting of HAP/collagen scaffold in gelation bath for bone tissue engineering. Regener Biomater 2023;10:rbad067. - PMC - PubMed
    1. Liu L, Wang J, Li Y, Liu B, Zhang W, Wang AW, Xu Q, Zhao B, Ma L.. C. Laminin 332-functionalized coating to regulate the behavior of keratinocytes and gingival mesenchymal stem cells to enhance implant soft tissue sealing. Regener Biomater 2022;9:rbac054. - PMC - PubMed
    1. Gan Q, Pan H, Zhang W, Yuan Y, Qian J, Liu C.. Fabrication and evaluation of a BMP-2/dexamethasone co-loaded gelatin sponge scaffold for rapid bone regeneration. Regener Biomater 2022;9:rbac008. - PMC - PubMed