. 2023 Dec 14:34:37-50.
doi: 10.1016/j.bioactmat.2023.12.001. eCollection 2024 Apr.

Lysosomal destabilization: A missing link between pathological calcification and osteoarthritis

Affiliations

Lysosomal destabilization: A missing link between pathological calcification and osteoarthritis

Tao Ye et al. Bioact Mater. .

Abstract

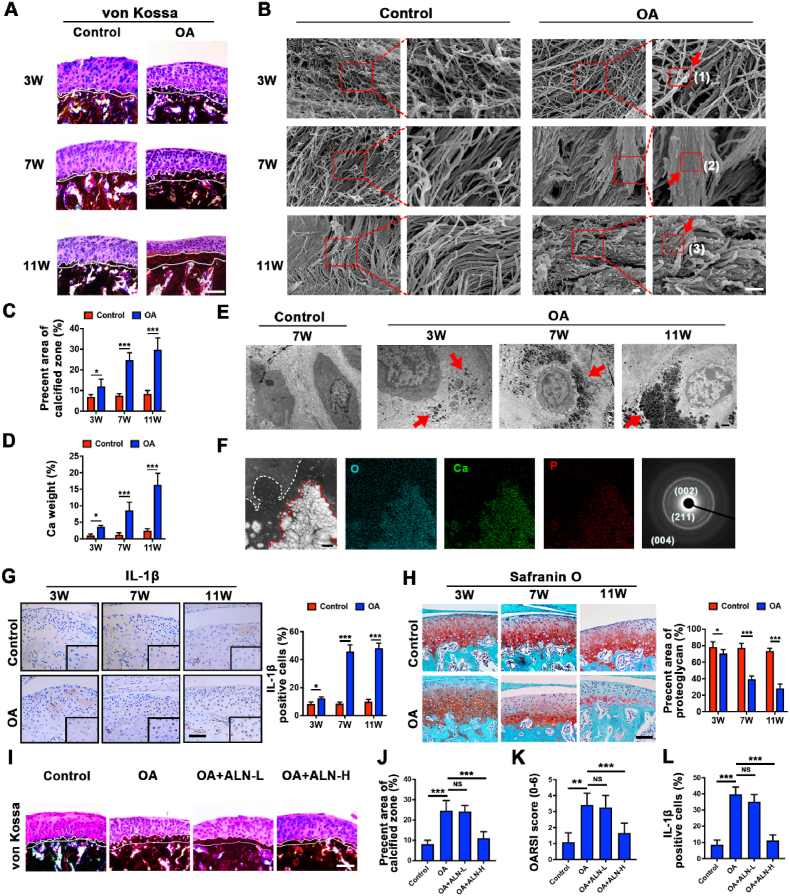
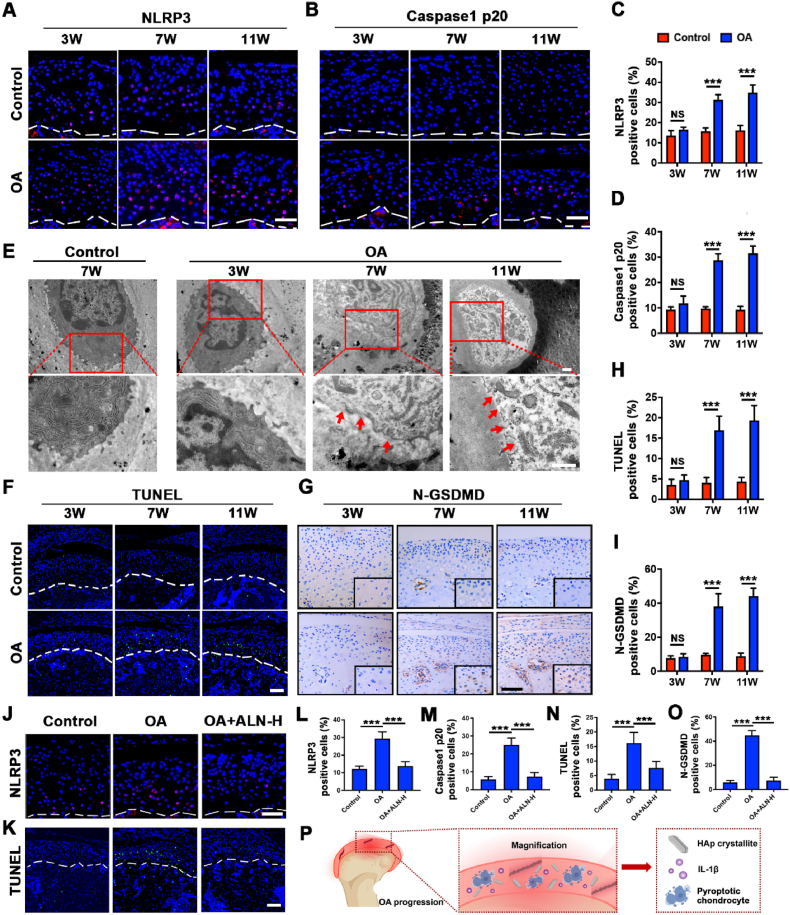
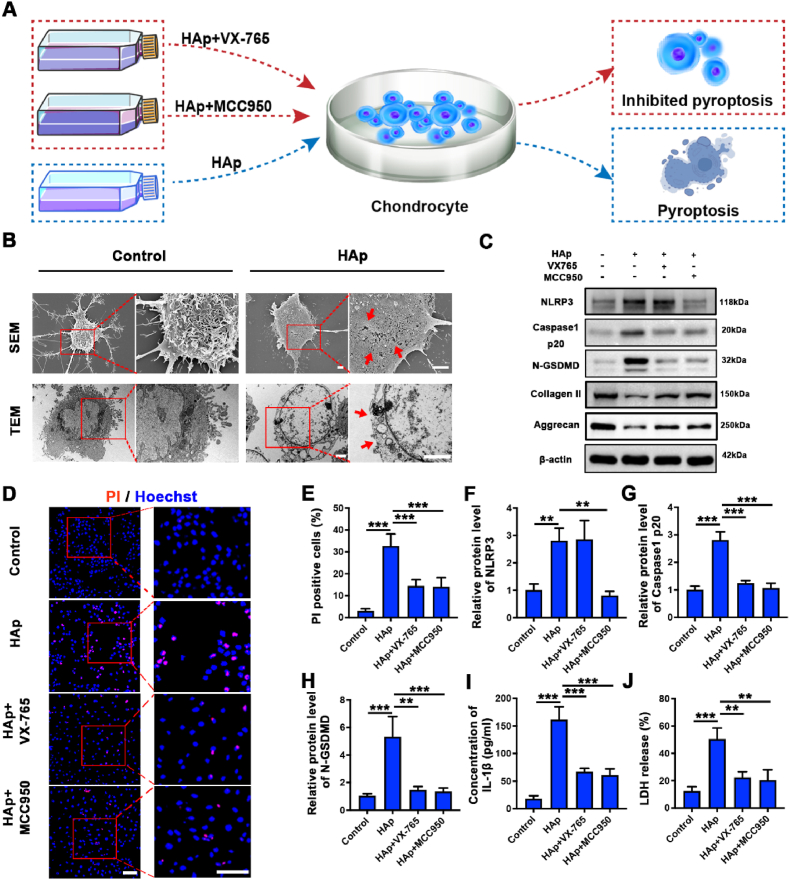
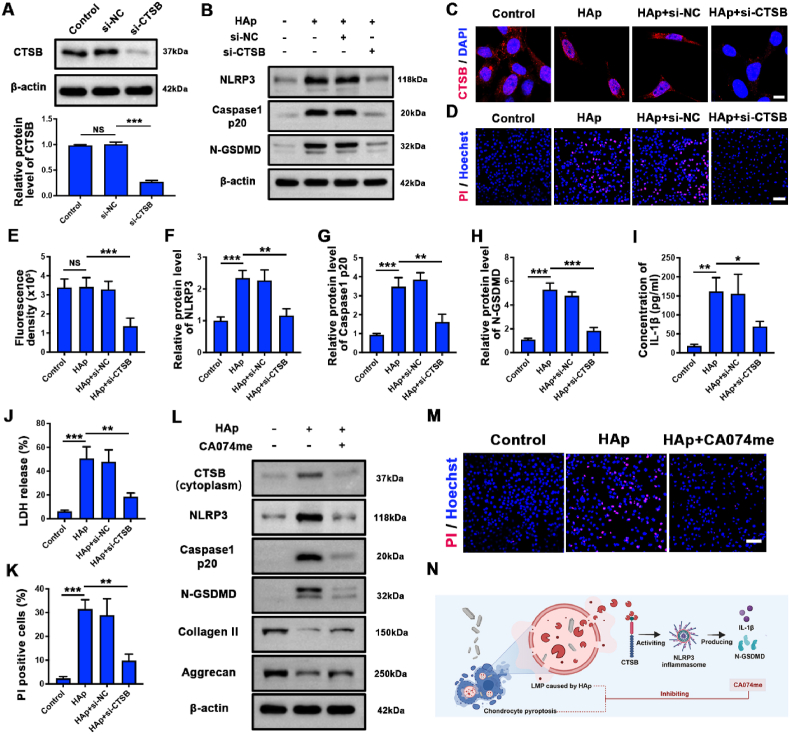
Calcification of cartilage by hydroxyapatite is a hallmark of osteoarthritis and its deposition strongly correlates with the severity of osteoarthritis. However, no effective strategies are available to date on the prevention of hydroxyapatite deposition within the osteoarthritic cartilage and its role in the pathogenesis of this degenerative condition is still controversial. Therefore, the present work aims at uncovering the pathogenic mechanism of intra-cartilaginous hydroxyapatite in osteoarthritis and developing feasible strategies to counter its detrimental effects. With the use of in vitro and in vivo models of osteoarthritis, hydroxyapatite crystallites deposited in the cartilage are found to be phagocytized by resident chondrocytes and processed by the lysosomes of those cells. This results in lysosomal membrane permeabilization (LMP) and release of cathepsin B (CTSB) into the cytosol. The cytosolic CTSB, in turn, activates NOD-like receptor protein-3 (NLRP3) inflammasomes and subsequently instigates chondrocyte pyroptosis. Inhibition of LMP and CTSB in vivo are effective in managing the progression of osteoarthritis. The present work provides a conceptual therapeutic solution for the prevention of osteoarthritis via alleviation of lysosomal destabilization.

Keywords: Chondrocyte pyroptosis; Hydroxyapatite; Lysosomal destabilization; Osteoarthritis; Pathological calcification.


Conflict of interest statement

The authors declare no conflict of interest.

Figures

Image 1
Abbreviations: HAp, hydroxyapatite; CTSB, cathepsin B; NLRP3, NOD-like receptor protein-3.
Fig. 1
Fig. 1
Hydroxyapatite deposition was associated with IL-1β expression and cartilage degeneration. A) von Kossa and hematoxylin & eosin co-staining of sagittal central sections of the temporomandibular joint (TMJ) from the 3-, 7- and 11-week control and osteoarthritis (OA) groups. Areas stained black within the white lines indicated calcified cartilage zone. Scale bar: 100 μm. B) SEM images of the cartilage derived from the control and OA groups. Scale bar: 400 nm. High magnification of the areas depicted by the red rectangles showed calcified particulates and mineralized deposits (red arrows). Scale bar: 400 nm. C) Quantitative analysis of the percentage area of calcified cartilage to whole cartilage in (A) (n = 6). D) Quantitative analysis of calcium element distribution in the cartilage in (B) (n = 6). E) Representative TEM images of the extracellular matrix of cartilage specimen derived from the 7-week control group and OA groups. Red arrows indicated the mineral deposits in the extracellular matrix. Scale bar: 1 μm. F) Elemental mapping and selected area electron diffraction (SAED) of the mineral deposits in the extracellular matrix of a 7-week osteoarthritic cartilage specimen. The chondrocyte was within dotted white lines while the area within dotted red lines was used for SAED test (the left panel). SAED patterns showing diffraction rings corresponding to (002), (211), (004) crystallographic planes of hydroxyapatite (the right panel). O: oxygen (blue), Ca: calcium (green), P: phosphorus (red). Scale bar: 1 μm. G) Immunochemical staining of IL-1β protein and quantitative analysis of the percentage of the IL-1β-positive chondrocyte in sagittal central sections of the TMJ from the control and OA groups. H) Safranin O staining and quantitative analysis of the percentage of the area of proteoglycans to whole cartilage in sagittal central sections of the TMJ from the control and OA groups. I) von Kossa and hematoxylin & eosin co-staining of sagittal central sections of the TMJ from different groups. OA + ALN-L: osteoarthritis with low dose of alendronate (0.1 mg/kg); OA + ALN-H: osteoarthritis with high dose of alendronate (1 mg/kg). Scale bar: 100 μm. J-L) Quantitative analysis of the percentage area of calcified cartilage, the OARSI score and the percentage of IL-1β-positive chondrocytes in cartilage of (I), (S2E) and (S2F) respectively (n = 6). Statistical analyses in (C, D, G, H) were performed using two-way ANOVA with Holm-Šidák multiple comparison tests, while those in (J–L) were performed using one-way ANOVA with Holm-Šidák multiple comparison tests. NS, no significance; *, P < 0.05; **, P < 0.01; ***, P < 0.001.
Fig. 2
Fig. 2
Potential link between hydroxyapatite deposition and chondrocyte pyroptosis. A) Immunofluorescence staining of NLRP3 protein in the cartilage derived from different groups. NLRP3, red; DAPI, blue. Scale bar: 50 μm. B) Immunofluorescence staining of Caspase1 p20 protein in the cartilage derived from different groups. Caspase1 p20, red; DAPI, blue. Scale bar: 50 μm. C-D) Quantitative analysis of the percentage of NLRP3-positive and Caspase1 p20-positive chondrocytes in (A) and (B) respectively (n = 6). E) Representative TEM images of the cartilage specimens derived from the 7-week control group and osteoarthritis (OA) groups. The red arrows in magnified images indicated cell membrane ruptures. Scale bar: 1 μm. F) TUNEL staining of the cartilage derived from different groups. TUNEL, green; DAPI, blue. Scale bar: 100 μm. G) Immunochemical staining of N-GSDMD protein in the cartilage derived from different groups. Scale bar: 100 μm. H–I) Quantitative analysis of the percentage of TUNEL-positive and N-GSDMD-positive chondrocytes in (F) and (G) respectively (n = 6). J) Immunofluorescence staining of NLRP3 protein in the cartilage derived from different groups. NLRP3, red; DAPI, blue. OA + ALN-H: osteoarthritis with high dose of alendronate (1 mg/kg). Scale bar: 50 μm. K) TUNEL staining of the cartilage derived from different groups. TUNEL, green; DAPI, blue. Scale bar: 100 μm. L-O) Quantitative analysis of the percentage of NLRP3, Caspase1 p20, TUNEL and N-GSDMD-positive chondrocytes in (J), (S3C), (K) and (S3D) respectively. P) Schematic depicting the pathological changes in osteoarthritic cartilage from in vivo experiments. Statistical analyses in (C, D, H, I) were performed using two-way ANOVA with Holm-Šidák multiple comparison tests, while those in (L–O) were performed using one-way ANOVA with Holm-Šidák multiple comparison tests. NS, no significance; ***, P < 0.001. The dotted white lines in fluorescence staining images indicated the boundary of cartilage and subchondral bone.
Fig. 3
Fig. 3
Hydroxyapatite triggered chondrocyte pyroptosis via activation of NLRP3 inflammasome. A) Schematic depicting the design and results of the in vitro experiment. B) Representative SEM and TEM images of chondrocytes cultured with or without hydroxyapatite (HAp). Magnified images showed cell membrane pores and ruptures (red arrows). Scale bar: 2 μm. C) NLRP3, Caspase1 p20, N-GSDMD, collagen II and aggrecan protein levels of chondrocytes after the designated treatment, as determined by Western blot. D) Fluorescence co-staining of propidium iodide (PI) and Hoechst 33342 in chondrocytes of different groups. Scale bar: 100 μm. E) Quantitative analysis of the percentage of PI positive chondrocyte in (D) (n = 3). F–H) Quantitative analysis of NLRP3, Caspase1 p20 and N-GSDMD protein levels in (C) (n = 3). I-J) Quantitative analysis of IL-1β and lactate dehydrogenase (LDH) levels in chondrocyte culture supernatants in different groups (n = 3). Statistical analyses were performed using one-way ANOVA with Holm-Šidák multiple comparison tests. **, P < 0.01; ***, P < 0.001.
Fig. 4
Fig. 4
Intracellular LMP and CTSB cytosolic release that occurred in chondrocytes after hydroxyapatite uptake. A) Representative TEM images of chondrocytes cultured with 100 μg/mL hydroxyapatite (HAp) for 24h. Scale bar: 300 nm. The magnified image showed HAp distribution in lysosomes. The discontinuity in lysosome membranes was indicated by red arrows. Scale bar: 300 nm. B) Fluorescence staining of rhodamine–phalloidin in chondrocytes cultured with 100 μg/mL fluorexon-labeled HAp for 6h. Scale bar: 10 μm. C) Fluorescence staining of lysotracker in living chondrocytes cultured with 100 μg/mL fluorexon-labeled HAp for 6h. Scale bar: 10 μm. D) Immunofluorescence co-staining of galectin-3 (Gal-3) and lysosome-associated membrane protein 2 (LAMP2) proteins in chondrocytes cultured with or without 100 μg/mL HAp. Scale bar: 5 μm. E) Quantitative analysis of the number of Gal-3 and LAMP2 co-localized puncta per cell in (D) (n = 3). F) Representative TEM images of chondrocytes in the cartilage specimen derived from the 7-week osteoarthritis (OA) groups. Magnified images show phagocytosis of crystallites in the chondrocytes. The dotted white lines represent the cell membranes. Scale bar: 500 nm. G) Elemental mapping and selected area electron diffraction (SAED) of the crystallites within the lysosomes of chondrocytes. SAED patterns showing diffraction rings corresponding to (002), (211), (004) crystallographic planes of HAp. O: oxygen (purple), Ca: calcium (yellow), P: phosphorus (red). Scale bar: 200 nm. H) Immunofluorescence co-staining of Gal-3 and LAMP2 proteins in the cartilage derived from different groups. Upper panel: merged images; Lower panel: single-channel images of Gal-3. Scale bar: 10 μm. I) Quantitative analysis of the Manders's coefficients for co-localization of Gal-3 and LAMP2 in (H) (n = 6). J) Immunofluorescence co-staining of Gal-3 and LAMP2 proteins in the cartilage derived from different groups. OA + ALN-H: osteoarthritis with high dose of alendronate (1 mg/kg). Upper panel: merged images; Lower panel: single-channel images of Gal-3. Scale bar: 10 μm. K) Immunofluorescence staining of cathepsin B (CTSB) protein in cartilage derived from different groups. Inset: single-channel images of CTSB. Scale bar: 10 μm. L) Quantitative analysis of the Manders's coefficients for co-localization of Gal-3 and LAMP2 in (J) (n = 6). M) Quantitative analysis of the number of CTSB puncta per chondrocyte in (K) (n = 6). Statistical analyses were performed using Student's t-test in (E), two-way ANOVA with Holm-Šidák multiple comparison tests in (I and M), and one-way ANOVA with Holm-Šidák multiple comparison tests in (L). NS, no significance; **, P < 0.01; ***, P < 0.001.
Fig. 5
Fig. 5
Hydroxyapatite induced cytosolic CTSB contributed to NLRP3 inflammasome activation and caused chondrocyte pyroptosis. A) The Western blot result and quantitative analysis of Cathepsin B (CTSB) protein level of chondrocytes after transfected with siRNA targeting CTSB (si-CTSB). B) NLRP3, Caspase1 p20 and N-GSDMD protein levels of chondrocytes after the designated treatment, as determined by Western blot. C) Immunofluorescence staining of CTSB protein in chondrocytes of different groups. Scale bar: 10 μm. D) Fluorescence co-staining of propidium iodide (PI) and Hoechst 33342 in chondrocytes of different groups. Scale bar: 100 μm. E) Quantitative analysis of the fluorescence intensity of CTSB protein in (C) (n = 3). F–H) Quantitative analysis of NLRP3, Caspase1 p20 and N-GSDMD protein levels in (B) (n = 3). I-J) Quantitative analysis of IL-1β and lactate dehydrogenase (LDH) levels in chondrocyte culture supernatants of different groups (n = 3). K) Quantitative analysis of the percentage of PI-positive chondrocytes in (D) (n = 3). L) Cytosolic CTSB protein level and total NLRP3, Caspase1 p20, N-GSDMD, collagen II and aggrecan protein levels of chondrocytes after the designated treatment, as determined by Western blot. M) Fluorescence co-staining of PI and Hoechst 33342 in chondrocytes of different groups. Scale bar: 100 μm. N) Schematic depicting the mechanism whereby hydroxyapatite (HAp) triggered chondrocyte pyroptosis. Statistical analyses were performed using one-way ANOVA with Holm-Šidák multiple comparison tests. NS, no significance; *, P < 0.05; **, P < 0.01; ***, P < 0.001.
Fig. 6
Fig. 6
Alleviation of LMP and inhibition of CTSB represented potential therapeutic targets in the management of experimental osteoarthritis. A) Schematic depicting the design and results of the in vivo experiment. B) von Kossa and hematoxylin & eosin co-staining in the cartilage derived from different groups. The areas between the white lines indicated calcified cartilage. Scale bar: 100 μm. C) Quantitative analysis of the percentage of calcified cartilage to whole cartilage in (B) (n = 6). D) Immunofluorescence staining of CTSB protein in cartilage derived from different groups. CTSB, red; DAPI, blue. Scale bar: 10 μm. E) Quantitative analysis of fluorescence intensity of CTSB in (D) (n = 6). F) Immunofluorescence co-staining of galectin-3 (Gal-3) and lysosome-associated membrane protein 2 (LAMP2) proteins in cartilage derived from different groups. The white arrows indicated the Gal-3 and LAMP2 colocalized area. Gal-3, green; LAMP2, red; DAPI, blue. Scale bar: 10 μm. G) Quantitative analysis of the Manders's coefficients for co-localization of Gal-3 and LAMP2 in (F) (n = 6). H) Immunofluorescence staining of NLRP3 protein in cartilage derived from different groups. NLRP3, red; DAPI, blue. Scale bar: 50 μm. I) Quantitative analysis of the percentage of NLRP3-positive chondrocytes in (H) (n = 6). J) Fluorescence staining of TUNEL in cartilage derived from different groups. TUNEL, green; DAPI, blue. Scale bar: 100 μm. K) Quantitative analysis of the percentage of TUNEL-positive chondrocytes in (J) (n = 6). L) Safranin O staining in cartilage derived from different groups. Scale bar: 100 μm. M) Quantitative analysis of the percentage of proteoglycans-positive area to whole cartilage in (L) (n = 6). Statistical analyses were performed using one-way ANOVA with Holm-Šidák multiple comparison tests. NS, no significance; *, P < 0.05; **, P < 0.01; ***, P < 0.001. The dotted white lines in fluorescence staining images indicated the boundary of cartilage and subchondral bone.

Similar articles

Cited by

References

    1. Kapoor M., Martel-Pelletier J., Lajeunesse D., Pelletier J.P., Fahmi H. Role of proinflammatory cytokines in the pathophysiology of osteoarthritis. Nat. Rev. Rheumatol. 2011;7(1):33–42. - PubMed
    1. Berenbaum F. Osteoarthritis as an inflammatory disease (osteoarthritis is not osteoarthrosis!) Osteoarthritis Cartilage. 2013;21(1):16–21. - PubMed
    1. Wu J., Li H., Hu F., Luo P. Stevioside attenuates osteoarthritis via regulating Nrf2/HO-1/NF-kappaB pathway. J. Orthop. Translat. 2023;38:190–202. - PMC - PubMed
    1. Dai B., Zhu Y., Li X., Liang Z., Xu S., Zhang S., Zhang Z., Bai S., Tong W., Cao M., Li Y., Zhu X., Liu W., Zhang Y., Chang L., Yung P.S., Ki-Wai Ho K., Xu J., Ngai T., Qin L. Blockage of osteopontin-integrin beta3 signaling in infrapatellar fat pad attenuates osteoarthritis in mice. Adv. Sci. 2023;10(22) - PMC - PubMed
    1. Wen C., Xiao G. Advances in osteoarthritis research in 2021 and beyond. J. Orthop. Translat. 2022;32:A1–A2. - PMC - PubMed

LinkOut - more resources