

Unsupervised machine learning for risk stratification and identification of relevant subgroups of ascending aorta dimensions using cardiac CT and clinical data
- PMID: 38173875
- PMCID: PMC10762320
- DOI: 10.1016/j.csbj.2023.11.021
Unsupervised machine learning for risk stratification and identification of relevant subgroups of ascending aorta dimensions using cardiac CT and clinical data
Abstract
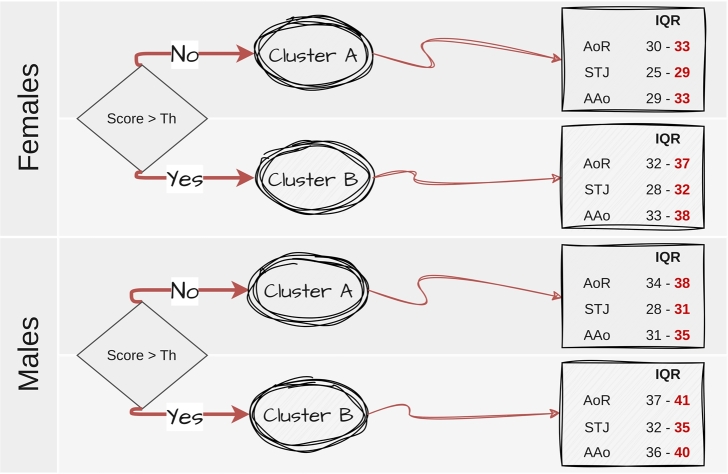
The potential of precision population health lies in its capacity to utilize robust patient data for customized prevention and care targeted at specific groups. Machine learning has the potential to automatically identify clinically relevant subgroups of individuals, considering heterogeneous data sources. This study aimed to assess whether unsupervised machine learning (UML) techniques could interpret different clinical data to uncover clinically significant subgroups of patients suspected of coronary artery disease and identify different ranges of aorta dimensions in the different identified subgroups. We employed a random forest-based cluster analysis, utilizing 14 variables from 1170 (717 men/453 women) participants. The unsupervised clustering approach successfully identified four distinct subgroups of individuals with specific clinical characteristics, and this allows us to interpret and assess different ranges of aorta dimensions for each cluster. By employing flexible UML algorithms, we can effectively process heterogeneous patient data and gain deeper insights into clinical interpretation and risk assessment.
Keywords: Aortic dimensions; Clusterization; Computed tomography coronary angiography; Coronary artery disease; Unsupervised learning.
© 2023 The Author(s).
Conflict of interest statement
The authors declare that they have no known competing financial interests or personal relationships that could have appeared to influence the work reported in this paper.
Figures


Similar articles
-
Unsupervised Learning for Automated Detection of Coronary Artery Disease Subgroups.J Am Heart Assoc. 2021 Dec 7;10(23):e021976. doi: 10.1161/JAHA.121.021976. Epub 2021 Nov 30. J Am Heart Assoc. 2021. PMID: 34845917 Free PMC article.
-
Identification of clinical heterogeneity and construction of a novel subtype predictive model in patients with ankylosing spondylitis: An unsupervised machine learning study.Int Immunopharmacol. 2023 Apr;117:109879. doi: 10.1016/j.intimp.2023.109879. Epub 2023 Feb 21. Int Immunopharmacol. 2023. PMID: 36822084
-
Model-Based and Model-Free Techniques for Amyotrophic Lateral Sclerosis Diagnostic Prediction and Patient Clustering.Neuroinformatics. 2019 Jul;17(3):407-421. doi: 10.1007/s12021-018-9406-9. Neuroinformatics. 2019. PMID: 30460455 Free PMC article.
-
Unsupervised machine learning methods and emerging applications in healthcare.Knee Surg Sports Traumatol Arthrosc. 2023 Feb;31(2):376-381. doi: 10.1007/s00167-022-07233-7. Epub 2022 Nov 15. Knee Surg Sports Traumatol Arthrosc. 2023. PMID: 36378293 Review.
-
Radiogenomics and Artificial Intelligence Approaches Applied to Cardiac Computed Tomography Angiography and Cardiac Magnetic Resonance for Precision Medicine in Coronary Heart Disease: A Systematic Review.Circ Cardiovasc Imaging. 2021 Dec;14(12):1133-1146. doi: 10.1161/CIRCIMAGING.121.013025. Epub 2021 Dec 17. Circ Cardiovasc Imaging. 2021. PMID: 34915726
Cited by
-
Unsupervised learning analysis on the proteomes of Zika virus.PeerJ Comput Sci. 2024 Nov 11;10:e2443. doi: 10.7717/peerj-cs.2443. eCollection 2024. PeerJ Comput Sci. 2024. PMID: 39650519 Free PMC article.
-
Artificial intelligence-powered solutions for automated aortic diameter measurement in computed tomography: a narrative review.Ann Transl Med. 2024 Dec 24;12(6):116. doi: 10.21037/atm-24-171. Epub 2024 Dec 18. Ann Transl Med. 2024. PMID: 39817238 Free PMC article. Review.
References
-
- Muraru D., Maffessanti F., Kocabay G. Ascending aorta diameters measured by echocardiography using both leading edge-to-leading edge and inner edge-to-inner edge conventions in healthy volunteers. Eur Heart J Cardiovasc Imaging. 2014;15:415–422. - PubMed
-
- Parachuri K., Salhab V. Aortic size distribution in the general population: explaining the size paradox in aortic dissection. Cardiology. 2015;4:265–272. - PubMed
-
- Ceja-Rodriguez A., Realyvasquez M. Differences in aortic diameter measurements with intravascular ultrasound and computed tomography after blunt traumatic aortic injury. Ann Vasc Surg. 2018;50:148–153. - PubMed
-
- Wang M., Desai T.K.M. Thoracic aortic aneurysm: optimal surveillance and treatment. Clevel Clin J Med. 2020;9:557–568. - PubMed
LinkOut - more resources
Full Text Sources