. 2023 Dec 3;27(1):108596.
doi: 10.1016/j.isci.2023.108596. eCollection 2024 Jan 19.

KDM5B predicts temozolomide-resistant subclones in glioblastoma

Affiliations

KDM5B predicts temozolomide-resistant subclones in glioblastoma

Vivien Ullrich et al. iScience. .

Abstract

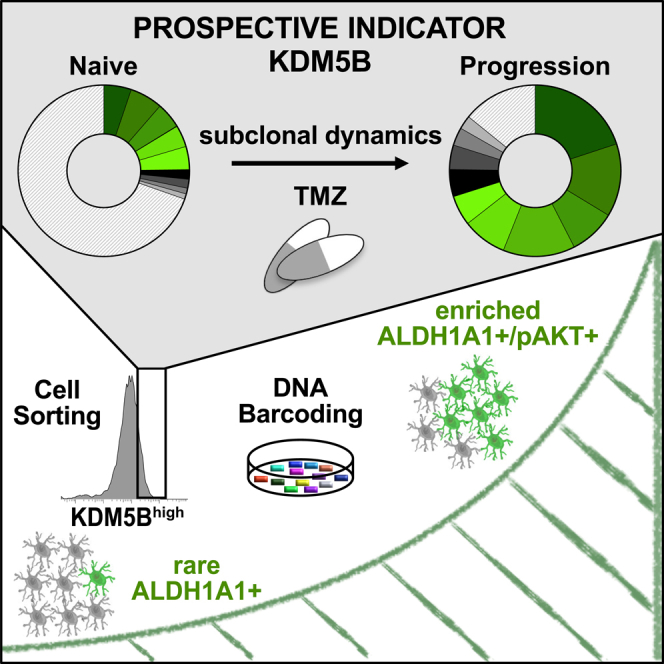
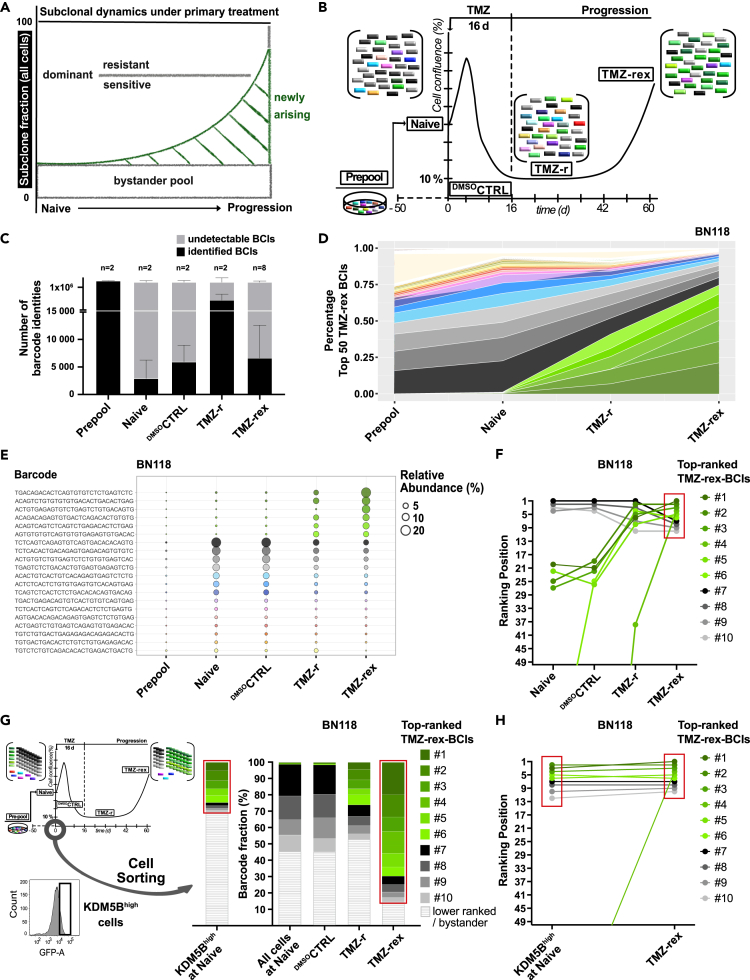
Adaptive plasticity to the standard chemotherapeutic temozolomide (TMZ) leads to glioblastoma progression. Here, we examine early stages of this process in patient-derived cellular models, exposing the human lysine-specific demethylase 5B (KDM5B) as a prospective indicator for subclonal expansion. By integration of a reporter, we show its preferential activity in rare, stem-like ALDH1A1+ cells, immediately increasing expression upon TMZ exposure. Naive, genetically unmodified KDM5Bhigh cells phosphorylate AKT (pAKT) and act as slow-cycling persisters under TMZ. Knockdown of KDM5B reverses pAKT levels, simultaneously increasing PTEN expression and TMZ sensitivity. Pharmacological inhibition of PTEN rescues the effect. Interference with KDM5B subsequent to TMZ decreases cellular vitality, and clonal tracing with DNA barcoding demonstrates high individual levels of KDM5B to predict subclonal expansion already before TMZ exposure. Thus, KDM5Bhigh treatment-naive cells preferentially contribute to the dynamics of drug resistance under TMZ. These findings may serve as a cornerstone for future biomarker-assisted clinical trials.

Keywords: Cancer; Cell biology; Health sciences; Pharmacology.


Conflict of interest statement

The authors declare no conflicts of interest.

Figures

None
Graphical abstract
Figure 1
Figure 1
Presence and dynamics of KDM5Bhigh cells under TMZ exposure (A) Cartoon illustrating the rationale of this study. Visualized is the TMZ-mediated enrichment of subclones observed at disease relapse. Representative immunofluorescent appearance of cellular phenotypes in patient tissue at primary disease (Naive) and after clinical treatment (Relapse). (B–E) Graphs depict personalized qPCR-based gene expression values of short-term expanded pairs of patient cell samples. Patient IDs indicated. Mean of triplicate. R2, Pearson coefficient of determination. Treatment-naive expression levels of ALDH1A1 (B), KDM5A (C), KDM6A (D), and KDM5B (E) were correlated with the ALDH1A1 levels of respective relapse samples. (F) Bar chart showing frequency of co-expressing cells at the indicated time points of the treatment scheme: drug-on, exposure to vehicle (0.5% DMSO or 0.1% ethanol), or 500 μM TMZ, or 50 μM CCNU, or 10 μM dasatinib; drug-off, no drug exposure. Flow cytometry analysis, in duplicate/triplicate on sample IDs BN46, BN118; presented as mean ± SD. p values obtained by Kruskal-Wallis with Dunn’s post-hoc test. (G) Phase contrast appearance and vital EGFP fluorescence of representative patient cell sample (naive-E049) transduced with KDM5B promoter-EGFP reporter construct as indicated by the cartoon (pLU-JARID1Bprom-EGFP-BLAST, provided by a study by Roesch et al.). Scale bar, 100 μM. (H) Graph plotting flow cytometry data obtained from KDM5Bhigh subpopulations of reporter construct-transduced, naive BN46KDM5B−EGFP patient cells. Time points and TMZ (500 μM) -on/-off schedule as indicated. Data represent the percent increase of KDM5Bhigh cells (relative number of cells that reached the set fluorescence threshold), normalized to the naive time point. (I) Bar plots depicting the increase of KDM5Bhigh subpopulations in reporter construct-bearing naive (BN46KDM5B−EGFP, BN118KDM5B−EGFP, E049KDM5B−EGFP, E056KDM5B−EGFP) and relapse (TMZ→eRBN46 KDM5B−EGFP, cRBN118 KDM5B−EGFP) patient cell samples (compare Table S1). Time points and TMZ (500 μM) -on/-off schedule as indicated. Values normalized to corresponding (0.5%) DMSO controls and shown as mean ± SD. p values calculated using a Kruskal-Wallis test with Dunn’s post-hoc test. (J) Bar plot indicating 7-AAD+ cell frequencies in KDM5Bhigh vs. KDM5Blow subpopulations of construct-bearing naive BN46KDM5B−EGFP and naive BN118KDM5B−EGFP patient cell samples. Triplicate data, obtained by flow cytometry after TMZ (500 μM) -on/-off schedule as indicated, shown as mean ± SD. Left inset: Representative plots (BN46KDM5B−EGFP), including (0.5%) DMSO-control. p value by Wilcoxon rank-sum test (gated). (K) CellTrace experiment. Histogram of Far Red peaks revealing high, moderate, and slow-cycling subpopulations by flow cytometry (representative case, naive BN118KDM5B−EGFP). Bar chart representing mean fluorescence intensity (MFI) of KDM5B-EGFP reporter for each Far Red peak. Triplicate data as mean ± SD. p values by Kruskal-Wallis test. See also Figure S1 and Table S1.
Figure 2
Figure 2
KDM5B mediates cellular TMZ response through the PTEN-AKT axis (A) Bar chart depicting flow cytometry MFI data obtained from two naive patient samples (BN46, BN118). Treatment scheme as indicated, comprised TMZ (500 μM) -on/-off periods vs. 0.5% DMSO-control. Data obtained on day 5 in triplicate, shown as mean ± SD. p values calculated by Mann-Whitney test. (B) Bar chart showing percentage of co-expressing cells, determined by flow cytometry from two naive patient samples (BN46 and BN118) at the indicated time points of the treatment scheme: drug-on, exposure to vehicle (0.5% DMSO or 0.1% ethanol), or 500 μM TMZ, or 50 μM CCNU, or 10 μM dasatinib; drug-off, no drug exposure. Duplicate or triplicate data as mean ± SD. p values by Kruskal-Wallis with Dunn’s post-hoc test. (C) Flow cytometry profiling of KDM5B-expression in ALDH1A1+/pAKT+ cells. Data from genetically unmodified, naive patient samples BN46 (shown) and BN118 after exposure to TMZ (500 μM) -on/-off schedule as indicated. (D) Protein expression patterns of PI3K-AKT-PTEN pathway genes subsequent to KDM5B knockdown by SMARTpool: ON-TARGETplus siRNA. Western Blot analysis of naive BN118 cells. (E) Quantification data derived from quadruplicate western Blot analysis of naive patient samples BN46 and BN118. Treatment scheme as indicated. Data normalized as indicated and presented as mean ± SD. (F) siKDM5B-knockdown/PTEN inhibitor-rescue experiment. Cartoon illustrates series of experiments conducted with naive patient samples BN46, BN118, E049, and E056. Bar plots present alamarBlue readout data, normalized to the corresponding siNT-controls and shown as mean ± SD. PTEN inhibition (PTENInh) by SF1670 (10 nM for 24 h). (G) Caspase assay subsequent to indicated treatment scheme. Bar chart depicting MFI data of active caspase-3. Flow cytometry analysis of patient cell sample BN118 according to indicated treatment scheme. Data in triplicate as mean ± SD. p value by paired t-test. (H) Caspase assay subsequent to indicated treatment schemes, involving TMZ (500 μM), CPI-455 (12 μM), or DMSO (0.5%). Left: Exemplary histograms, respectively color-coded. Bar chart depicting MFI data of active caspase-3. Flow cytometry analysis of patient cell sample BN118. Triplicate, data as mean ± SD. p values by paired t test. (I) 12-day assays of indicated single- and combinatorial drug treatments, involving TMZ (500 μM), CPI-455 (12 μM), C46 (6 μM) or DMSO (0.5%). Bar plots represent alamarBlue cell viability readouts on naive patient samples BN46, and BN118, normalized to the DMSO-control. Duplicate/triplicate analysis, data as mean ± SD. p values by paired t test. See also Figure S2 and Table S1.
Figure 3
Figure 3
KDM5B expression predicts TMZ-triggered subclonal growth (A) Working model. Subclonal dynamics occurs under therapeutic pressure of primary treatment. It results from shifting abundance of treatment-resistant vs. treatment-sensitive cellular hierarchies. Some hierarchies dominate at the naive stage, others appear to arise newly under drug exposure. A bystander pool of cells does not participate in the dynamic course of subclones. (B) Cartoon illustrating the experimental barcoding setup. Naive BN46 and BN118 patient cells were provided with the ClonTracer barcoding construct, exposed to 500 μM TMZ or 0.5% DMSO, and analyzed by NGS at the indicated time points. TMZ-resistant cells, TMZ-r; expanding TMZ-resistant cells, TMZ-rex. (C) NGS-based quantification of detectable barcode identities (BCIs) from (B). Bar charts representing ratios of identifiable vs. undetectable BCIs at the indicated experimental stages. Data points from naive patient samples BN46 and BN118, presented as mean ± SD. (D–H) Note: green-scale, newly arising BCIs under TMZ exposure vs. gray-scale, dominant BCIs at the Naive stage of the experiment. Data from patient sample BN118. (D) Subclonal dynamics from (B), visualized as a stacked plot. Data represent the relative frequencies of the top 50 BCIs, as defined at the TMZ-rex stage, displayed for each stage of the experiments. (E) Subclonal dynamics from (B), visualized as a bubble plot. Data represent relative barcode abundances, barcode identity as specified, at the indicated time points of the experiments. Barcodes of at least 1% relative abundance shown. (F) Subclonal dynamics from (B), visualized as a ranked plot. Data represent individual ranking positions of the top 10 BCIs, as defined at the TMZ-rex stage, displayed for each stage of the experiments. (G) Sorting experiment. Cartoon illustrating cell sorting of KDM5Bhigh barcoded cells at the Naive stage of the experiment. Subclonal dynamics and top TMZ-rex can be predicted; visualized as a slice plot (red boxes). Data represent ranking positions of the top 10 BCIs, as defined at the TMZ-rex stage, color-coded for identity and displayed in relative abundance for each stage of the experiment. Abundance of lower-ranked thousands of bystander identities in white. (H) Subclonal dynamics and top TMZ-rex can be predicted; visualized as a ranked plot (red boxes). Data represent individual ranking positions of the top 10 BCIs, as defined at the TMZ-rex stage, color-coded for identity and displayed as ranking positions at the TMZ-rex stage and for the Naive-sorted KDM5Bhigh cells. Note the similarity of ranking positions among the individual BCIs at both time points. See also Figure S3 and Table S1.

References

    1. Chen J., Li Y., Yu T.S., McKay R.M., Burns D.K., Kernie S.G., Parada L.F. A restricted cell population propagates glioblastoma growth after chemotherapy. Nature. 2012;488:522–526. - PMC - PubMed
    1. Lan X., Jörg D.J., Cavalli F.M.G., Richards L.M., Nguyen L.V., Vanner R.J., Guilhamon P., Lee L., Kushida M.M., Pellacani D., et al. Fate mapping of human glioblastoma reveals an invariant stem cell hierarchy. Nature. 2017;549:227–232. - PMC - PubMed
    1. Weller M., van den Bent M., Preusser M., Le Rhun E., Tonn J.C., Minniti G., Bendszus M., Balana C., Chinot O., Dirven L., et al. EANO guidelines on the diagnosis and treatment of diffuse gliomas of adulthood. Nat. Rev. Clin. Oncol. 2021;18:170–186. - PMC - PubMed
    1. Gimple R.C., Yang K., Halbert M.E., Agnihotri S., Rich J.N. Brain cancer stem cells: resilience through adaptive plasticity and hierarchical heterogeneity. Nat. Rev. Cancer. 2022;22:497–514. - PubMed
    1. Kebir S., Ullrich V., Berger P., Dobersalske C., Langer S., Rauschenbach L., Trageser D., Till A., Lorbeer F.K., Wieland A., et al. A Sequential Targeting Strategy Interrupts AKT-Driven Subclone-Mediated Progression in Glioblastoma. Clin. Cancer Res. 2023;29:488–500. - PMC - PubMed