. 2024 Feb 2;134(3):269-289.
doi: 10.1161/CIRCRESAHA.123.322993. Epub 2024 Jan 4.

Directional Endothelial Communication by Polarized Extracellular Vesicle Release

Affiliations

Directional Endothelial Communication by Polarized Extracellular Vesicle Release

Sneha Raju et al. Circ Res. .

Abstract

Background: Extracellular vesicles (EVs) contain bioactive cargo including miRNAs and proteins that are released by cells during cell-cell communication. Endothelial cells (ECs) form the innermost lining of all blood vessels, interfacing with cells in the circulation and vascular wall. It is unknown whether ECs release EVs capable of governing recipient cells within these 2 separate compartments. Given their boundary location, we propose ECs use bidirectional release of distinct EV cargo in quiescent (healthy) and activated (atheroprone) states to communicate with cells within the circulation and blood vessel wall.

Methods: EVs were isolated from primary human aortic ECs (plate and transwell grown; ±IL [interleukin]-1β activation), quantified, visualized, and analyzed by miRNA transcriptomics and proteomics. Apical and basolateral EC-EV release was determined by miRNA transfer, total internal reflection fluorescence and electron microscopy. Vascular reprogramming (RNA sequencing) and functional assays were performed on primary human monocytes or smooth muscle cells±EC-EVs.

Results: Activated ECs increased EV release, with miRNA and protein cargo related to atherosclerosis. EV-treated monocytes and smooth muscle cells revealed activated EC-EV altered pathways that were proinflammatory and atherogenic. ECs released more EVs apically, which increased with activation. Apical and basolateral EV cargo contained distinct transcriptomes and proteomes that were altered by EC activation. Notably, activated basolateral EC-EVs displayed greater changes in the EV secretome, with pathways specific to atherosclerosis. In silico analysis determined compartment-specific cargo released by the apical and basolateral surfaces of ECs can reprogram monocytes and smooth muscle cells, respectively, with functional assays and in vivo imaging supporting this concept.

Conclusions: Demonstrating that ECs are capable of polarized EV cargo loading and directional EV secretion reveals a novel paradigm for endothelial communication, which may ultimately enhance the design of endothelial-based therapeutics for cardiovascular diseases such as atherosclerosis where ECs are persistently activated.

Keywords: RNA-seq; atherosclerosis; microRNA; monocytes; muscle, smooth; proteomics.


Conflict of interest statement

Disclosures N.J. Galant is a cofounder and CEO of Paradox Immunotherapeutics. The other authors report no conflicts.

Figures

Figure 1.
Figure 1.
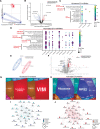
Endothelial cells (ECs) release increased CD63-positive small extracellular vesicles (sEVs) in response to activation. A, NTA of extracellular vesicle (EV) concentration binned by particle size (nm) after isolation from human aortic endothelial cell (HAEC) conditioned media (8×10⁷ cells, from quiescent [EV-free media, 24 h] and activated [100 pg/mL IL (interleukin)-1β in EV-free media, 24 h] states; n=4). B, Quantification of EC-EV mean concentration across all EV sizes (n=4). C, Western blot depicting EV markers (CD63, Alix, and CD9) in EV lysates isolated from supernatants of quiescent and activated HAECs and HAEC cell lysate (CL) control (n=3). Arrows show position of correct protein band and molecular weight markers indicated on left. D, Densitometry of EV lysate derived CD63 normalized to HAEC cell lysate control (n=3). E, Cryogenic electron microscopy (cryo-EM) of EVs isolated from quiescent and activated HAEC cell supernatant. Arrows indicate EV structures. Scale bar, 50 nm. F, Quantification of EV mean diameter by NTA (n=8). G, Transmission electron microscopy (TEM) of 90-nm ultramicrotomed HAEC monolayers. Dashed circles indicate multivesicular bodies. Scale bar, 1 µm. Representative image (n=3). Bar graphs show mean±SEM. Statistical significance assessed by unpaired t test (B, D, and F). NTA indicates nanoparticle tracking analysis.
Figure 2.
Figure 2.
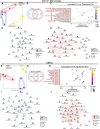
Endothelial small extracellular vesicle (sEV) miRNA and protein cargo are distinct in identity and predicted function in activated vs quiescent conditions. A, Unfiltered principal component (PC) analysis (PCA) showing miRNA profiles of sEVs isolated from conditioned media of activated (red) vs quiescent (blue) human aortic endothelial cells (HAECs; 8×10⁷ cells, 100 pg/mL IL [interleukin]-1β, 24 h; n=3). B, Volcano plot of HAEC secreted extracellular vesicle (EV) miRNA transcriptome with red and blue representing EV-miRNA contents enriched in activated and quiescent states, respectively (false discovery rate [FDR] step up, <0.05; fold change, >|2|). C, Pathway analysis of the top 10 (by FDR) quiescent HAEC-EV enriched miRNAs (miRTarBase) delineated significant Kyoto Encyclopedia of Genes and Genomes (KEGG) pathways (FDR, <0.05) for miRNA associations of miR-208b-3p, miR-513a-3p, and miR-587. Data points are sized by GeneRatio (genes altered in pathway/total number of unique genes in analysis) and color scaled by FDR. D, Pathway analysis of top 10 (by FDR) activated HAEC-EV enriched miRNAs (miRTarBase), showing individual miRNA associations of KEGG pathways of interest. Data points are sized by GeneRatio as in C and color scaled by FDR. E, Unfiltered PCA showing protein profiles of sEVs isolated from conditioned media of activated (red) vs quiescent (blue) HAECs as in A. F, Volcano plot of HAEC secreted EV proteome with red and blue representing EV-protein contents enriched in activated and quiescent states, respectively (P<0.05; fold change, >|1.5|; n=4). G, Proteomap (v2.0, Homo Sapiens) generated from all differentially enriched quiescent endothelial cell (EC)–EV proteins weighted by mass abundance. KEGG orthology terms (left) and respective proteins (right) contributing to the pathways are illustrated. H, Proteomap (v2.0, Homo Sapiens) generated from all differentially enriched activated EC-EV proteins calculated as in H. I and J, EV interactome generated by capturing differentially expressed EV-miRNA (top 25 by FDR) and all EV proteins in quiescent (I) and activated (J) states, followed by network reduction to retain the top 15 of each group based on degree of interactions. EV miRNAs shown in blue or red, EV proteins in turquoise or pink, and predicted targets in open black circles. Node size denotes significant value. Cancer- and infection-associated pathways were excluded from analysis.
Figure 3.
Figure 3.
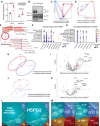
Endothelial small extracellular vesicles (sEVs) distinctly alter the transcriptional landscape of recipient monocytes and smooth muscle cells (SMCs) depending on whether they are derived from quiescent or activated endothelium. A, Unfiltered principal component analysis (PCA) plot depicting clustering of media control (yellow), quiescent endothelial cell–extracellular vesicles (EC-EVs; blue), and activated EC-EVs (red) treated CD14+ monocyte mRNA transcriptome (n=3). B, Venn diagram depicting number of shared and unique RNA transcripts comparing activated vs quiescent EC-EV treatment. C, Gene ontology (GO) pathway analysis of the effects of activated vs quiescent EC-EVs on the monocyte RNA transcriptome (adjusted P<0.05; |log2(foldchange)|, >0). Data points are sized by GeneRatio (genes altered in pathway/total number of unique genes in analysis) and color scaled by false discovery rate (FDR). Upregulated ratio was calculated by dividing the number of upregulated genes by the total number of genes known to function in each pathway. D and E, Interactomes integrating activated EC-EV secretome (top 15 miRNAs and all EV proteins) with differentially expressed monocyte transcripts based on the degree of interactions. Downregulated EC-EV cargo and concordant upregulated monocyte targets are depicted in D. Upregulated EC-EV cargo and concordant downregulated monocyte targets are depicted in E. EV protein and recipient cell mRNA overlap represented in yellow. F, Unfiltered PCA plot depicting clustering of EC-EV–treated SMC mRNA transcriptome as in A (n=3). G, Venn diagram depicting SMC RNA transcripts as in B. H, Kyoto Encyclopedia of Genes and Genomes (KEGG) pathway analysis of the effects of activated vs quiescent EC-EVs on the SMC RNA transcriptome (adjusted P<0.05; |log2(Foldchange)|, >0). Data visualization completed as in C. I and J, Interactomes as in D and E integrating differentially expressed SMC transcripts.
Figure 4.
Figure 4.
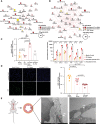
Multimodal evidence determining quiescent endothelial cells (ECs) release small extracellular vesicles (sEVs) to apical and basolateral compartments. A, Workflow showing EC-sEV isolation from compartments. Briefly, human aortic endothelial cells (HAECs) were seeded at confluence on semipermeable transwell inserts to sequester sEVs from apical and basolateral compartments. sEVs were isolated by ultracentrifugation or size exclusion chromatography, concentrated, and validated according to Minimal Information for Studies of Extracellular Vesicles 2018 guidelines. Created with BioRender.com. B, Representative cryo-EM images of apical (top) and basolateral (bottom) quiescent EC-sEVs. Arrows denote sEV structures. Scale bar, 50 nm. C and D, NTA quantifying mean diameter (C) and concentration (D) of EC-sEVs in apical and basolateral compartments (n=5). E and F, Protein expression of extracellular vesicle (EV) markers (positive [CD63, CD81, and Alix] and negative [calnexin]) in cell lysate, apical EV and basolateral EV samples (n=3). Western blot with arrows showing position of correct protein band and molecular weight markers indicated on left (E). Densitometric analysis of EV markers (F). G through J, Total internal reflection fluorescence (TIRF) microscopy (n=3). Sections depicting ECs transfected with fluorescent plasmid (pHluorinCD63) set for detection of basolateral EV release±positive (histamine, 100 μM; 1 min) and negative (GW4869, 0.5 μM; 4 h) controls (G and I). Quantification of basolateral EV release (H and J). For histamine stimulated cells, vesicles in the TIRF zone were quantified and normalized to the number of cells in the field (H). For GW4869 stimulated cells, integrated densities of CD63-pHluorin under basal conditions and after pretreatment were quantified. Scale bar, 10 µm (J). K, Model for exogenous miRNA transfer between ECs and monocytes (see Methods for full details). Briefly, HAECs were transfected with exogenous miRNA-39 (C elegans) and then seeded onto an inverted transwell to avoid direct cell-cell contact with nonadherent monocytes. Monocytes were placed either in a solitary chamber (apical or basolateral, unilateral coculture experiment) or simultaneously in the apical and basolateral chambers (bilateral coculture experiment), with monocytes harvested after 24 hours, and RNA isolated to quantify miRNA-39 expression by reverse transcription quantitative PCR (RT-qPCR) (n=3). L, Transmission electron microscopy of 90-nm ultramicrotomed HAEC monolayers (n=3). Embedded blocks were cut from the basolateral surface: the first 5 mm of resin cut was discarded to get to the apical surface. Circles indicate multivesicular bodies. Scale bar, 1 µm. Bar graphs show mean±SEM. Statistical significance assessed by unpaired t test (C, D, F, and J) and paired t test (H and K). NTA indicates nanoparticle tracking analysis.
Figure 5.
Figure 5.
Quiescent endothelial cells release small extracellular vesicles (sEVs) containing distinct miRNA and protein cargo to apical and basolateral compartments. A, Unfiltered principal component analysis (PCA) of apical (dark colors) and basolateral (light colors) extracellular vesicle (EV)-miRNA depicts clustering by polarity (broad circles; n=4). B, Volcano plot (left) of quiescent human aortic endothelial cell (HAEC) secreted EV-miRNA transcriptome enriched in apical (dark shading) vs basolateral (light shading) compartments. Top miRNA, by false discovery rate (FDR) step up, are labeled in each condition and used for downstream pathway analysis (FDR step up, <0.05). Kyoto Encyclopedia of Genes and Genomes (KEGG) pathway analysis of labeled miRNA in each condition (FDR, <0.05), weighted by the number of miRNAs participating in each pathway depicted by Word Cloud (right). C, Unfiltered PCA of apical (dark colors) and basolateral (light colors) EV-protein profiles showing clustering by polarity (broad circles; n=7 [apical] to 8 [basolateral]). D, Volcano plot (left) of quiescent HAEC secreted EV proteome enriched in apical (dark shading) vs basolateral (light shading) compartments (FDR, <0.05). All differentially enriched (FDR, <0.05) apical vs basolateral proteins in quiescent conditions were inputted to generate proteomaps (v2.0, Homo Sapiens), weighted by protein mass abundance. Apical and basolateral proteomaps are represented by top and bottom, respectively. KEGG orthology terms (left) and respective proteins (right) contributing to the pathways are illustrated. *AGE-RAGE (advanced glycation end products - receptor for AGE) signaling in diabetic complications.
Figure 6.
Figure 6.
Activated endothelial cells (ECs) modulate small extracellular vesicle (sEV) miRNA and protein cargo in a compartment-specific manner with the capacity to uniquely affect circulating monocytes and resident smooth muscle cells. A and B, Comparison of EC activation (red) vs quiescence (blue) on polarized sEV concentration in apical and basolateral compartments as determined by NTA (n=4; A) and Western blot (n=2; B). B, Extracellular vesicle (EV) markers CD63, CD81, and Alix are denoted on the right, with molecular weights on the left. C and D, Unfiltered principal component analysis (PCA) of apical (C) and basolateral (D) EV-miRNA cargo in activated vs quiescent states (n=3). E, Kyoto Encyclopedia of Genes and Genomes (KEGG) pathway analysis (false discovery rate [FDR], <0.05) of top apical (n=10) and basolaterally (n=6) enriched miRNA highlights unique and shared pathways modulated by differentially expressed EV-miRNA in activated conditions (Venn diagram, left). Unique KEGG pathways enriched by activation in apical (dark red, top) and basolateral (light red, bottom) EC-EVs shown on right. Bar graph scaled by −log10(FDR) and labeled with number of genes involved in the pathway. F and G, Activated vs quiescent EV-miRNA analyzed in apical (F) and basolateral (G) compartments. Top 10 EV miRNAs (by FDR) were inputted for KEGG orthology pathway analysis with the addition of miRNA-146a-5p in apical conditions. KEGG pathways (FDR, <0.05) of interest showing individual miRNA associations. Data points are sized by the number of gene targets and color scaled by FDR. H and I, EV proteins enriched in the apical compartment by activated ECs. H, Unfiltered PCA of apical EV-protein profiles in activated vs quiescent states (n=7). I, Volcano plot of differentially enriched EV proteins from the apical compartment in activation (red) and quiescence (blue; P<0.05; fold change, >|1.5|). Top 10 differentially enriched proteins in the activated conditions are labeled. J and K, EV proteins enriched in the basolateral compartment by activated ECs. J, Unfiltered PCA of basolateral EV-protein profiles in activated vs quiescent states (n=8). K, Volcano plot of differentially enriched EV proteins from the basolateral compartment as in I. L and M, All differentially enriched proteins (P<0.05; fold change, >|1.5|) from apical (L) and basolateral (M) activated conditions were inputted to generate proteomaps (v2.0, Homo Sapiens), weighted by protein mass abundance. KEGG orthology terms (left) and respective proteins (right) contributing to the pathways are illustrated. Bar graphs show mean±SEM. Statistical significance assessed by unpaired t test (A). *Signaling pathways regulating pluripotency of stem cells, AGE-RAGE (advanced glycation end products - receptor for AGE) signaling in diabetic complications. NTA indicates nanoparticle tracking analysis.
Figure 7.
Figure 7.
Biological relevance of apical and basolateral activated endothelial cell (EC)–small extracellular vesicles (sEVs). A and B, In silico interactomes were generated by layering apical and basolateral EC-sEV cargo with the transcriptomic responses of sEV-treated monocytes and smooth muscle cells (SMCs), respectively. A, Interactome integrating apical activated EC-sEV secretome (top 15 miRNAs and all extracellular vesicle [EV] proteins) with differentially expressed monocyte transcripts based on the degree of interactions. B, Interactome integrating basolateral activated EC-EV secretome (top 15 miRNAs and all EV proteins) with differentially expressed SMC transcripts based on the degree of interactions. EV miRNAs shown in red, EV proteins in pink, and recipient cell targets in black open circles. Node size denotes significant value. EV-protein and recipient cell mRNA overlap represented in yellow. C, Functional effect of activated EC-sEVs on monocyte survival (left) and secreted proteins (right). Activated EC-sEVs (apical or plate-derived; n=3 and n=2, respectively) were added to monocytes (1.5 to 2×10⁵ cells; 8.97×10⁹ to 2×10¹⁰ sEVs; 24 h) and monocyte annexin V staining detected by flow cytometry. Media alone and EC-sEV depleted media (EV media) were used as controls. Ratios were calculated by normalizing to media control. Targeted multiplex immunoassay (Olink) was performed on supernatants from monocytes grown in each condition. Comparison between activated apical EC-sEV treatment vs media control is reported above each cytokine (q value). D, Functional effect of activated EC-sEVs on SMC proliferation. SMCs were seeded at a density of 3×10⁴ in a 96-well plate. Plate-derived activated EC-sEVs were added to SMCs (1 to 2×10¹⁰ sEVs; 24 h), with media alone or EV media as controls. Proliferation was assessed by Ki67 staining (left) and quantified after normalization to the number of cells (right; n=6 images from 2 independent experiments). Scale bar, 50 µm. E, Murine aortic tissue was isolated, prepared for transmission electron microscopy (TEM), and placed in cross section for visualization of the endothelium with vessel lumen for orientation. Apical (ap) and basolateral (bl) surfaces are marked with arrows illustrating multivesicular bodies. Representative image (n=2 sections, from 2 mice). Scale bar, 500 nm. Bar graphs show mean±SEM. Statistical significance assessed by 1-way (C, left, and D, right) or 2-way (C, right) ANOVA with multiple testing correction using Benjamini-Hochberg false discovery rate (FDR) (C, right, 3 treatment groups, 95 cytokines).
Figure 8.
Figure 8.
Polarized endothelial extracellular vesicle (EV) communication with luminal and abluminal vascular cells. Endothelial cell (EC) small EV (EC-EV) release from apical (luminal) and basolateral (abluminal) surfaces in quiescence and after endothelial activation. Quiescent EC-EVs are depicted in blue (bright blue, apical; light blue, basolateral), while activated EC-EVs are depicted in red (bright red, apical; light red, basolateral). Luminal monocyte is represented in purple with upregulation of proinflammatory transcripts (bright purple) after uptake of activated EC-EVs from the apical surface, compared with uptake of quiescent apical EC-EVs (light purple). Basolateral EC-EVs are taken up by an abluminal resident smooth muscle cell depicted in yellow. Smooth muscle cell uptake of activated basolateral EC-EVs with upregulation of proinflammatory/proatherogenic transcripts (orange), as compared with uptake of quiescent EC-EVs (yellow). Created with BioRender.com. Co-designed by Dr Grace Huang for this project.

References

    1. Vanhoutte PM, Shimokawa H, Feletou M, Tang EH. Endothelial dysfunction and vascular disease - a 30th anniversary update. Acta Physiol (Oxf). 2017;219:22–96. doi: 10.1111/apha.12646 - PubMed
    1. Cines DB, Pollak ES, Buck CA, Loscalzo J, Zimmerman GA, McEver RP, Pober JS, Wick TM, Konkle BA, Schwartz BS, et al. . Endothelial cells in physiology and in the pathophysiology of vascular disorders. Blood. 1998;91:3527–3561. doi: 10.1182/blood.V91.10.3527 - PubMed
    1. Howe KL, Cybulsky M, Fish JE. The endothelium as a hub for cellular communication in atherogenesis: is there directionality to the message? Front Cardiovasc Med. 2022;9:888390. doi: 10.3389/fcvm.2022.888390 - PMC - PubMed
    1. Deanfield JE, Halcox JP, Rabelink TJ. Endothelial function and dysfunction: testing and clinical relevance. Circulation. 2007;115:1285–1295. doi: 10.1161/CIRCULATIONAHA.106.652859 - PubMed
    1. Gao Y, Galis ZS. Exploring the role of endothelial cell resilience in cardiovascular health and disease. Arterioscler Thromb Vasc Biol. 2021;41:179–185. doi: 10.1161/ATVBAHA.120.314346 - PubMed

Publication types