. 2024 Jun;20(6):1314-1334.
doi: 10.1080/15548627.2023.2300913. Epub 2024 Jan 11.

Targeting cancer-associated fibroblast autophagy renders pancreatic cancer eradicable with immunochemotherapy by inhibiting adaptive immune resistance

Affiliations

Targeting cancer-associated fibroblast autophagy renders pancreatic cancer eradicable with immunochemotherapy by inhibiting adaptive immune resistance

Xiaozhen Zhang et al. Autophagy. 2024 Jun.

Abstract

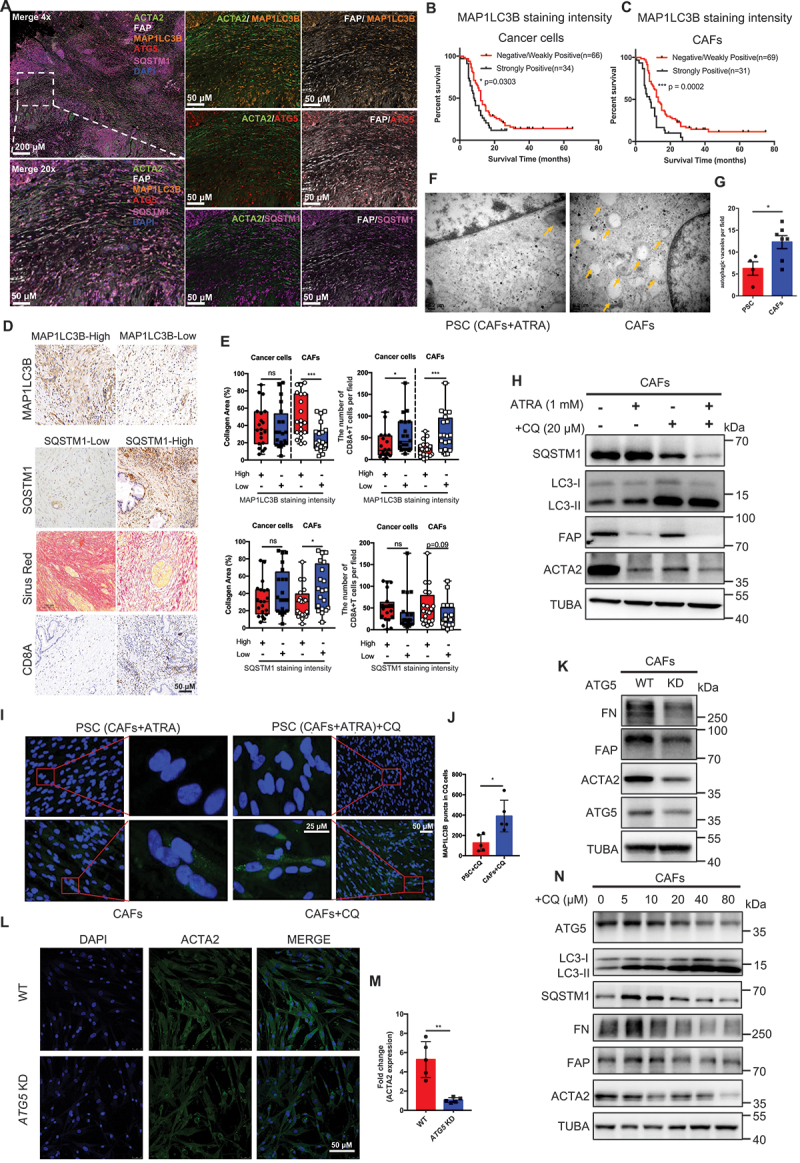
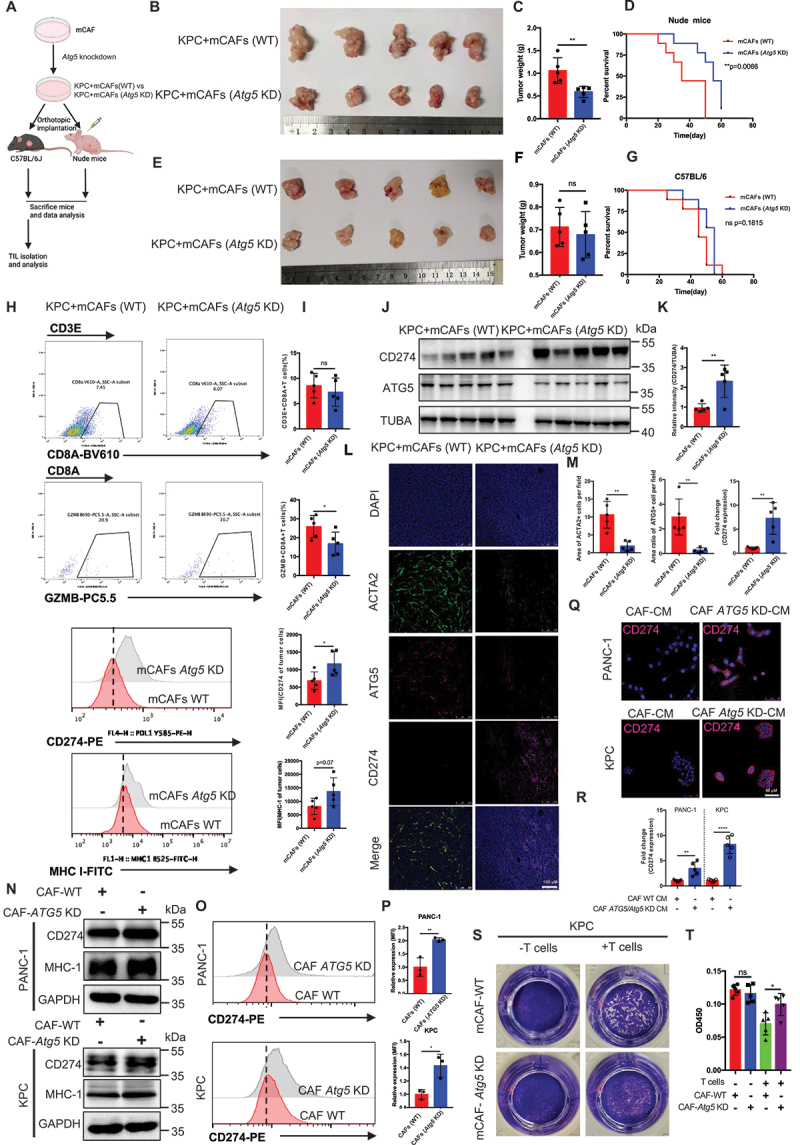
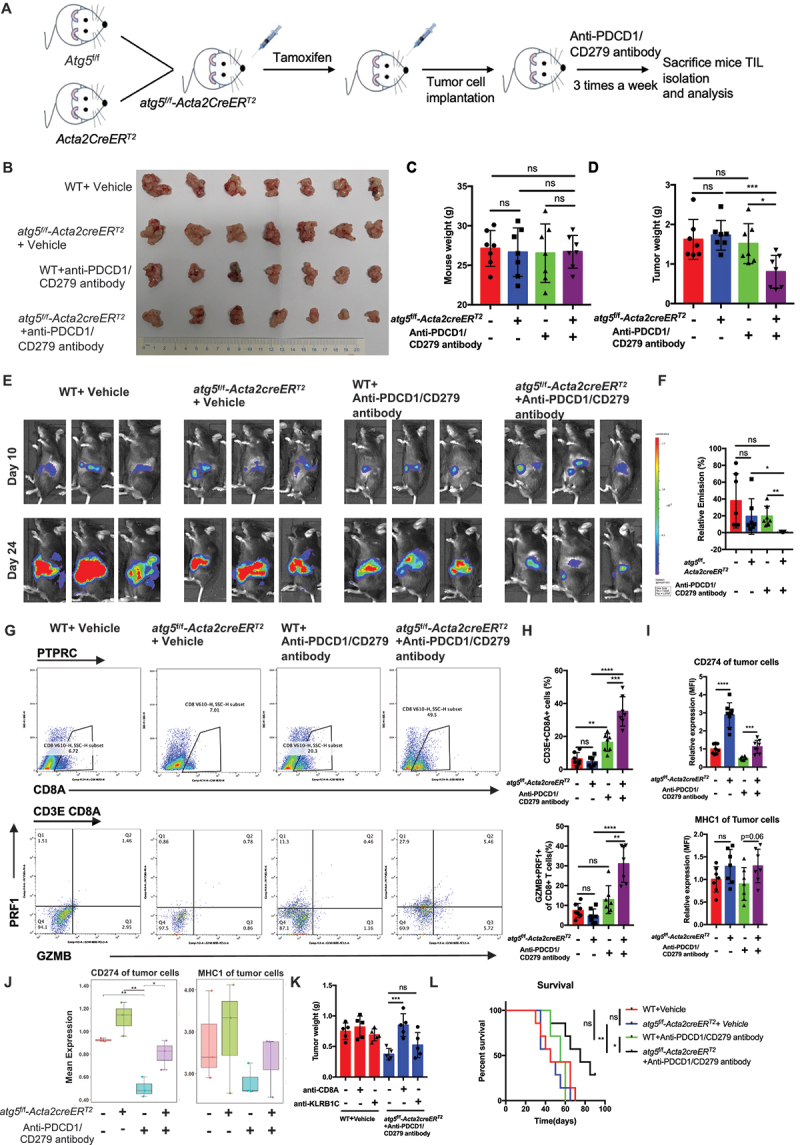
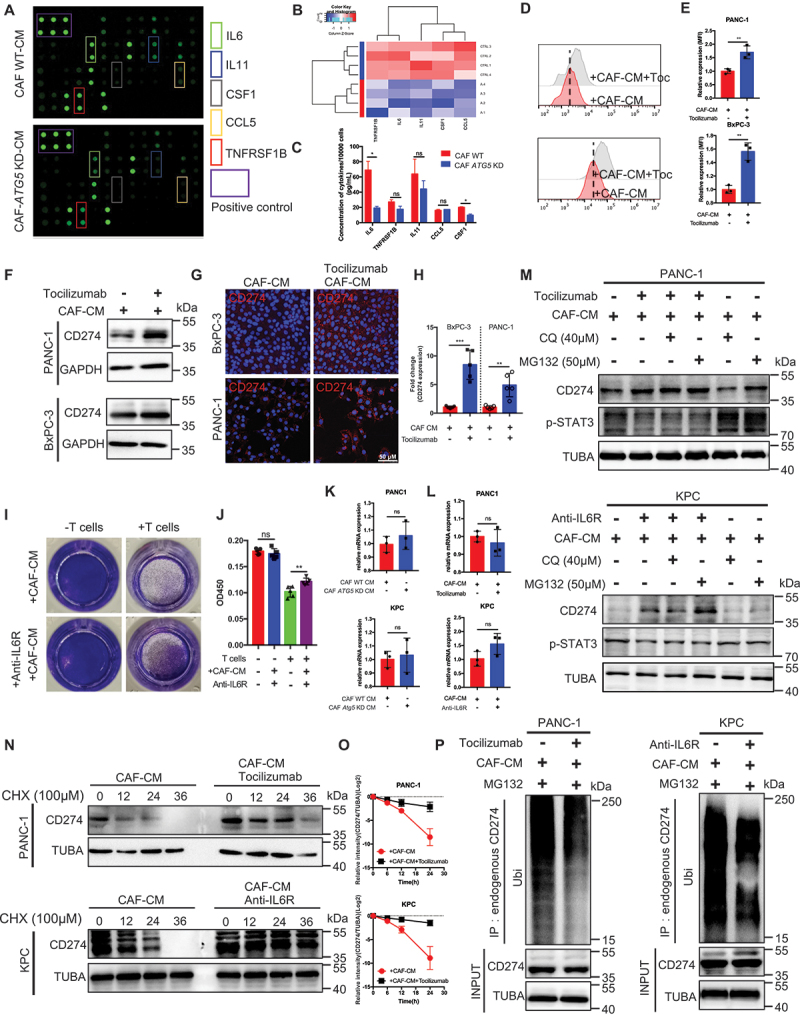
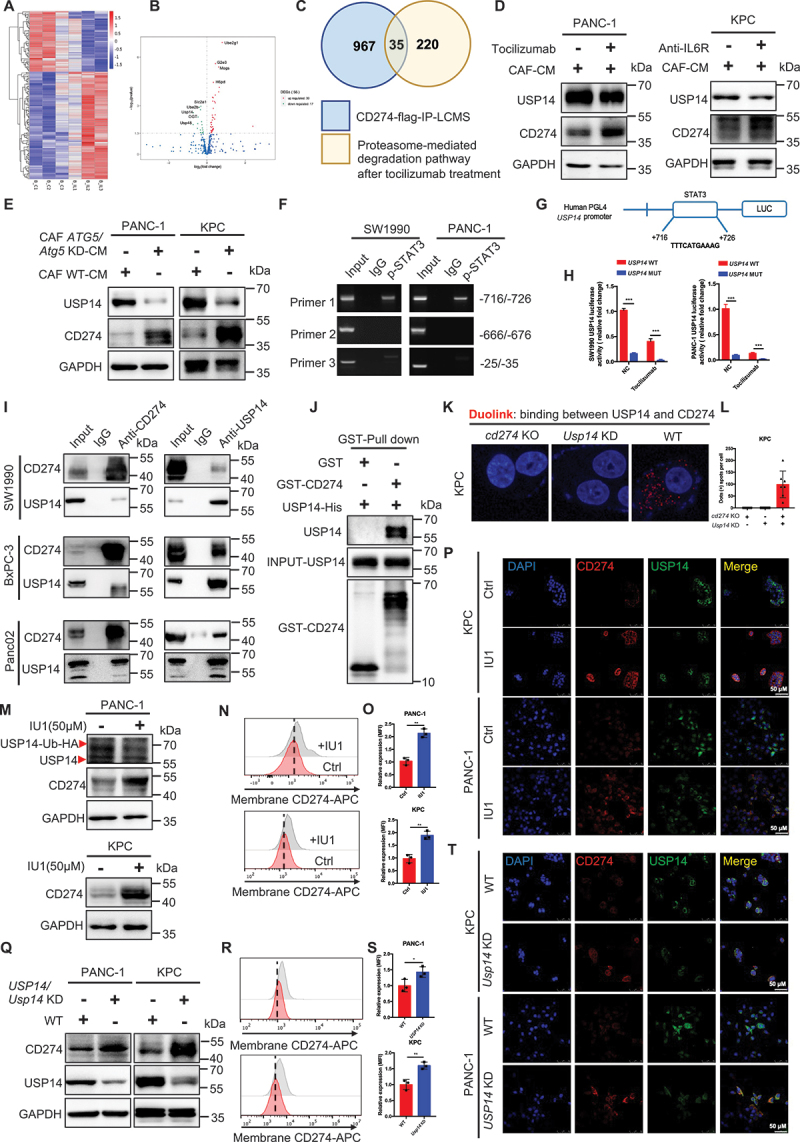
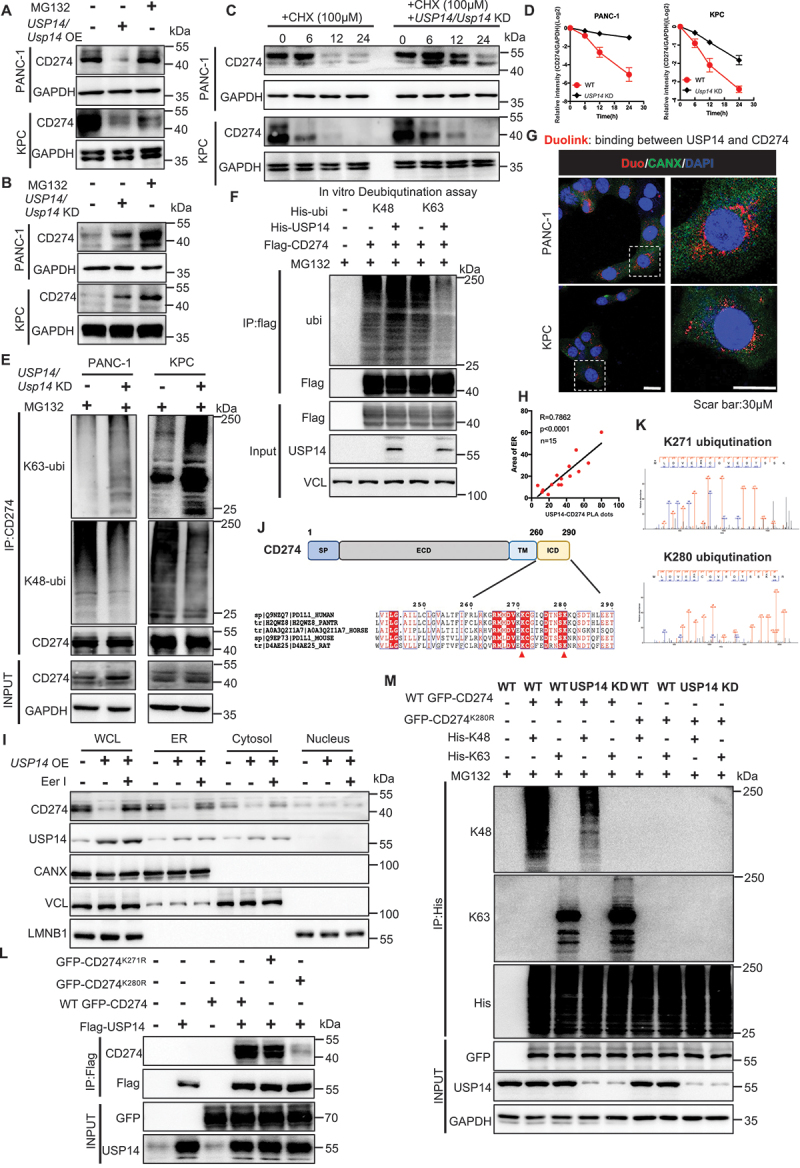
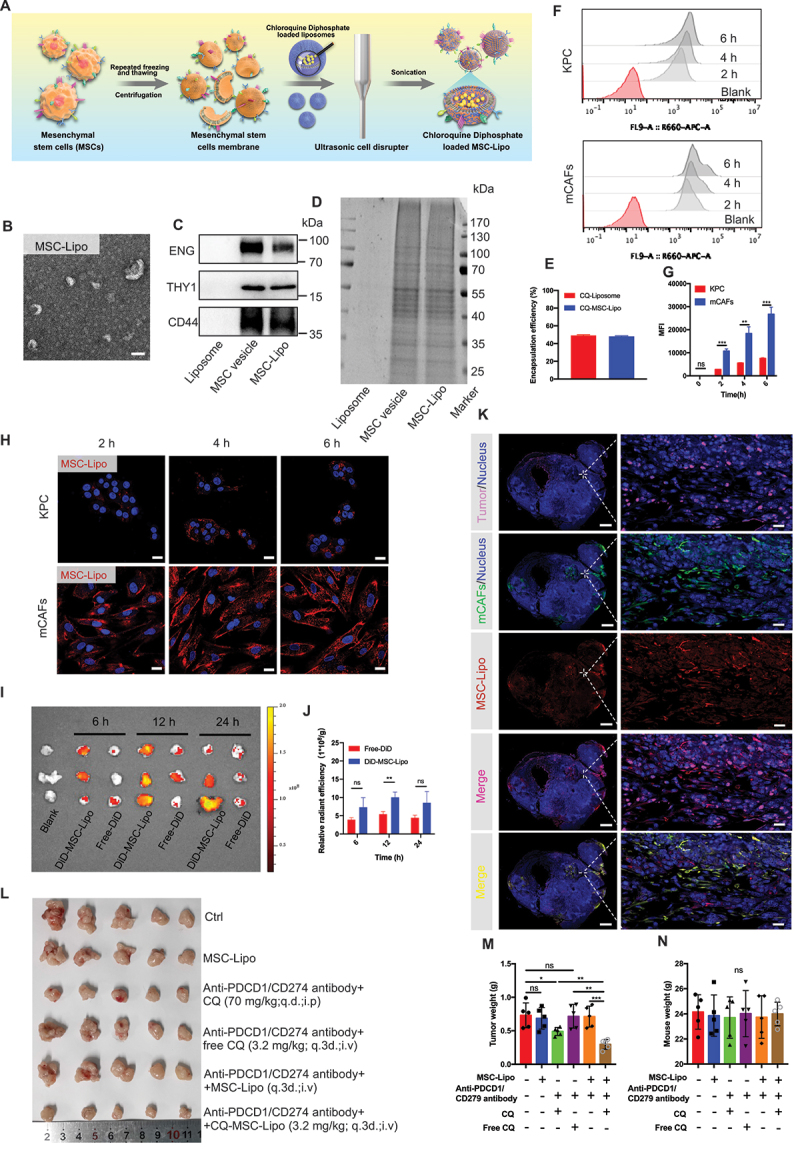
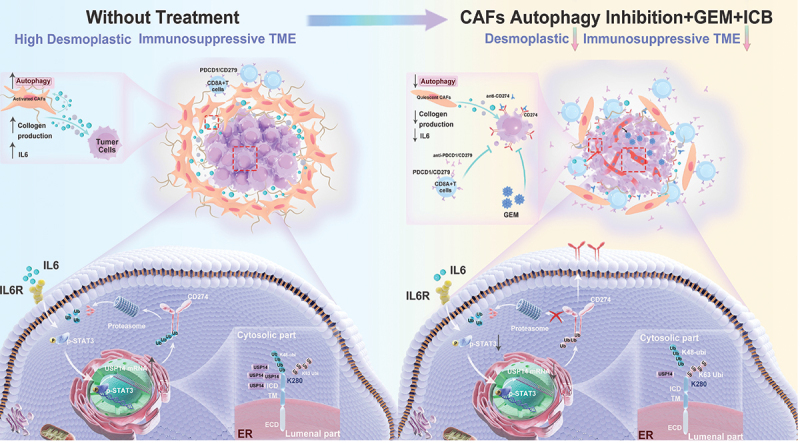
Accumulating evidence suggests that cancer-associated fibroblast (CAF) macroautophagy/autophagy is crucial in tumor development and may be a therapeutic target for pancreatic ductal adenocarcinoma (PDAC). However, the role of CAF autophagy during immune surveillance and cancer immunotherapy is unclear. The present study revealed that the inhibition of CAF autophagy suppresses in vivo tumor development in immune-deficient xenografts. This deletion compromises anti-tumor immunity and anti-tumor efficacy both in vitro and in vivo by upregulating CD274/PDL1 levels in an immune-competent mouse model. A block in CAF autophagy reduced the production of IL6 (interleukin 6), disrupting high desmoplastic TME and decreasing USP14 expression at the transcription level in pancreatic cancer cells. We further identify USP14 as the post-translational factor responsible for downregulating CD274 expression by removing K63 linked-ubiquitination at the K280 residue. Finally, chloroquine diphosphate-loaded mesenchymal stem cell (MSC)-liposomes, by accurately targeting CAFs, inhibited CAF autophagy, improving the efficacy of immunochemotherapy to combat pancreatic cancer.Abbreviation: AIR: adaptive immune resistance; ATRA: all-trans-retinoicacid; CAF: cancer-associated fibroblast; CD274/PDL1: CD274 molecule; CM: conditioned medium; CQ: chloroquine diphosphate; CyTOF: Mass cytometry; FGF2/bFGF: fibroblast growth factor 2; ICB: immune checkpoint blockade; IF: immunofluorescence; IHC: immunohistochemistry; IP: immunoprecipitation; MS: mass spectrometer; MSC: mesenchymal stem cell; PDAC: pancreatic ductal adenocarcinoma; TEM: transmission electron microscopy; TILs: tumor infiltrating lymphocytes; TME: tumor microenvironment; USP14: ubiquitin specific peptidase 14.

Keywords: Adaptive immune resistance; autophagy; cancer-associated fibroblast; pancreatic ductal adenocarcinoma; programmed cell death 1 ligand 1.


Conflict of interest statement

No potential conflict of interest was reported by the author(s).

Figures

Figure 1.
Figure 1.
Mutual regulation of CAF autophagy and activation in pancreatic cancer. (A) multi-IHC staining for MAP1LC3B, ATG5, SQSTM1, ACTA2, FAP and DAPI in PDAC. (B and C) tissue microarray analysis of the prognostic role of MAP1LC3B staining intensity in cancer cells and CAFs in pancreatic cancer. (D and E) MAP1LC3B, SQSTM1, CD8A IHC and Sirius red staining in human PDAC tissues and quantification of collagen deposition using Sirius red staining and the CD8A-positive cell area per field. (F and G) Representative transmission electron microscopy images and statistical results of autophagosomes and autolysosomes in CAFs after adding ATRA (1 mM) or PBS. (H) Western blot analysis of LC3-I, LC3-II, SQSTM1, FAP and ACTA2 in CAFs and PSC (CAFs treated after ATRA) with or without CQ. (I and J) Representative microphotographs and statistical results of MAP1LC3B immunofluorescence staining in CAFs following CQ treatment. The addition of CQ to CAFs induced an accumulation of MAP1LC3B in the cytoplasm. (K) CAFs were subjected to Atg5 KD, followed by IB for the different indicated proteins. (L and M) CAFs were subjected to Atg5 KD, followed by IB for ACTA2 (green) and DAPI (blue). (N) CAFs were treated with CQ and then subjected to IB for the different indicated proteins.
Figure 2.
Figure 2.
Genetic inhibition of CAF autophagy induced CD274-upregualtion mediated immune escape in both immune-competent mice and pancreatic cancer cells. (A) schematic protocols of WT-mCafs and Atg5 KD-mCafs with KPC separately and subcutaneously. injected into immunocompetent and immunodeficient mice (n = 5). (B-G) Representative images displaying tumors, tumor weight, and survival of immunocompetent and immunodeficient mice bearing WT-mCafs and Atg5 KD-mCafs with KPC. (H and I) Representative images and statistical results of tumor-infiltrating lymphocytes and immunomodulators in tumor cells (n = 5). (J and K) immunoblot analysis of CD274 expression in pancreatic tumors with Atg5 KD-mCafs. (L and M) Representative images and further quantification of tumor-bearing Atg5 KD-CAFs followed by immunofluorescence staining for ACTA2 (green), ATG5 (red), CD274 (pink) and DAPI (blue). (Q and R) Representative images and further quantification of tumor cells cocultured with Atg5 KD-CAFs followed by immunofluorescence staining for CD274 (red) and DAPI (blue). (N) immunoblot analysis of CD274 and MHC-1 expression in tumor cell lines cocultured with WT-CAFs and Atg5 KD-CAFs. (O and P) flow cytometry and further quantification of CD274 expression in tumor cell lines cocultured with WT-CAFs and Atg5 KD-CAFs. (S and T) Representative images and statistical results of T cell-mediated cancer cell-killing assay. KPC cells were pre-cocultured with WT-CAFs and Atg5 KD-CAFs for 24 h, then cocultured with activated T cells for 48 h and subjected to crystal violet staining. The ratio of tumor cells to T cells was 1:8.
Figure 3.
Figure 3.
Inhibition of CAF autophagy improved the in vivo anti-tumor effect of immunotherapy. (A) schematic protocol for the genetic inhibition of CAF autophagy combined with anti-PDCD1/CD279 antibody. (B-D) Representative images displaying tumors, tumor weight, and mouse weight of atg5f/f-Acta2creERT2 genetic mice treated with anti-PDCD1/CD279 antibody. (E and F) Representative photograph and statistical results of the IVIS imaging system in mice orthotopically implanted with luciferase-expressing KPC in atg5f/f-Acta2creERT2 genetic mice. (G-I) flow cytometric analysis and statistical results of lymphocytes that have infiltrated the tumors and membrane CD274 and MHC-1 expression on tumor cells (n = 7). (J) CyTOF analysis of membrane CD274 and MHC-1 expression on tumor cells in the four treatment groups (n = 3). (K) the statistical results of tumor weight following pretreatment with anti-CD8A and anti-KLRB1C/NK1.1 in atg5f/f-Acta2creERT2 genetic mice combined with anti-PDCD1/CD279 antibodies. (L) survival curve of orthotopic tumor implantation in atg5f/f-Acta2creERT2 genetic mice. atg5f/f-Acta2creERT2 genetic mice-orthotopic mice were treated with anti-PDCD1/CD279 antibodies until the mice were at the point of death and met the prespecified early removal criteria approved by the IACUC.
Figure 4.
Figure 4.
Deletion of CAF autophagy decreased IL6 secretion, which further increased CD274 expression by the ubiquitin proteasome system in pancreatic tumor cells. (A and B) differential cytokine expression was detected between WT and Atg5 KD CAFs using a cytokine antibody array and further quantified with a heatmap analysis. (C) the concentration of the top five secreted cytokines in the cytokine antibody array was identified by an ELISA. (D and E) flow cytometric analysis and statistical results of CD274 expression in tumor cells with or without tocilizumab under CAF-CM. (F) immunoblot analysis of CD274 expression in tumor cells with or without tocilizumab-treated CAFs. (G and H) Representative images and further quantification of tumor cells with or without tocilizumab-treated CAFs. (I and J) Representative images and statistical results of the T cell-mediated cancer cell-killing assay. KPC cells with or without anti-IL6R pre-cocultured CAFs for 24 h were cocultured with activated T cells for 48 h and subjected to crystal violet staining. The ratio of tumor cells to T cells was 1:8. (K) qRT-PCR examination of CD274 expression in tumor cells cocultured with WT-CAFs and Atg5 KD-CAFs for 24 h. (L) qRT-PCR examination of CD274 expression in tumor cells with or without tocilizumab-treated CAFs. (M) immunoblot analysis of CAFs treated with tocilizumab or anti-IL6R for 24 h with and without chloroquine (40 μM for last 6 h of treatment) or MG132 (20 μM for last 6 h of treatment). (N and O) stability analysis of CD274 in tumor cells treated with or without tocilizumab or anti-IL6R cocultured with CAFs following treatment with CHX. (P) ubiquitination assay of CD274 in tumor cells treated with or without tocilizumab or anti-IL6R and cocultured with CAFs after treatment with MG132.
Figure 5.
Figure 5.
Transcriptional activation of USP14 by STAT3 interacted with and negatively regulated CD274 in pancreatic cancer. (A and B) heatmap and volcano plot of RNAseq in BxPC-3 with or without tocilizumab treatment cocultured with CAFs for 24 h. (C) intersection analysis of the proteasome-mediated degradation pathway in RNAseq and CD274 flag-IP-LCMS. (D) immunoblot analysis of USP14 expression in tumor cells with or without tocilizumab or anti-IL6R treatment and cocultured with CAFs. (E) immunoblot analysis of USP14 expression in tumor cells cocultured with WT-CAFs and Atg5 KD-CAFs for 48 h. (F) chromatin immunoprecipitation (ChIP) assay analysis of the STAT3-bound potential binding site in the USP14 promotor. (G and H) schematic representation of the USP14 promoter cloned into the pGL4 vector. The predicted STAT3-binding motifs were shown and the promoter constructs containing mutations in this region to cause a STAT3-binding deficiency were generated. (I) cell lysates from SW1990, BxPC-3, and Panc02 were separately analyzed by IP and western blotting using the antibodies indicated. Representative images are shown. (J) GST affinity-isolation assay of USP14-his and GST-CD274 proteins. Representative images are shown. (K and L) Representative images and statistical results of individual immunofluorescence staining of the USP14 and CD274 interaction in KPC cells by a duolink assay. The red dots (USP14/CD274 interaction) indicate their interaction. (M-T) immunoblot analysis, flow cytometric analysis, and immunofluorescence staining of CD274 expression in tumor cells following treatment with IU1 (USP14 inhibitor) and Usp14 knockdown.
Figure 6.
Figure 6.
USP14 destabilizes CD274 and specifically removes the K63-linked poly-ubiquitination of CD274 at the K280 residue. (A and B) immunoblot analysis of CD274 expression in tumor cells with USP14 overexpression or knockdown after treatment with MG132. (C and D) stability analysis of CD274 in tumor cells with Usp14 knockdown following treatment with CHX. (E) ubiquitination assay of CD274 in tumor cells with a Usp14 knockdown after treatment with MG132. (F) in vitro deubiquitination assays of recombinant USP14 proteins and enriched K48-linked or K63-linked ubiquitinated CD274 from cell extracts. The mixture was incubated at 30°C for 4 h and subsequently analyzed by immunoblotting. (G and H) Representative images and statistical results of the tumor cells were subjected to a duolink assay combined with immunofluorescence staining using markers for ER (CANX) and nuclei (DAPI). (I) immunoblot analysis of CD274 and USP14 in different fractions, using antibodies against CD274 and USP14, the ER protein CANX, cytosolic TUBA, as well as the nuclear protein, LMNB1. (J) schematic diagram of the USP14-binding motif in amino acid sequences surrounding the potential binding sites of CD274 that were aligned in evolutionarily divergent species. (K) the ubiquitination site on CD274 as identified by mass spectrometry. (L) immunoblot analysis of CD274 expression in flag-USP14 and WT GFP-CD274 or GFP-CD274K271R or GFP-CD274K280R-transfected HEK293T cells. (M) ubiquitination assay of CD274 in USP14 WT and Usp14 knockdown HEK293T cells transfected with WT GFP-CD274 or the GFP-CD274K280R were subjected to his pull-down and SDS-PAGE analyses.
Figure 7.
Figure 7.
Targeting CAF autophagy renders primary PDAC tumors eradicable by immunotherapy via engineering stem cell-derived biomimetic vesicles. (A) the preparation, characterization, and targeting of the therapeutic application of MSC-Lipo. (B) transmission electron microscopy image of MSC-Lipo. Scale bar: 100 nm. (C) immunoblot analysis of liposomes, MSC vesicles, and MSC-Lipo for specific surface markers (ENG/CD105, THY1/CD90, and CD44). (D) SDS-PAGE analysis of the protein contents of liposomes, MSC vesicles, and MSC-Lipo. (E) Encapsulation efficiency of CQ-loaded liposomes and MSC-Lipo (n = 3). (F) flow cytometry analysis of MSC-Lipo uptake by KPC and mCafs at 2 h, 4 h and 6 h and 12 h. (G) quantification of fluorescence intensity (n = 3). (H) KPC and CAFs uptake MSC-Lipo at 2 h, 4 h and 6 h as captured by a confocal laser scanning microscope (red: DiD and blue: DAPI). Scale bar: 20 μm. (I) the distribution and (J) relative radiant efficiency of free-DiD and DiD-MSC-Lipo in tumors at 6 h, 12 h and 24 h after intravenous injection (n = 3). (K) colocalization of MSC-Lipo with KPC and CAFs in the tumor sections at 12 h after an intravenous injection (red: DiD, green: CD326, pink: ACTA2 and blue: DAPI). Scale bar: 2 mm for the original images and 100 μm for the magnified images. (L) photography of tumors at the ending of treatment (n = 5). Tumor weight (M) and body weight (N) at the end of treatment (n = 5).
Figure 8.
Figure 8.
Predicted model of the CAF autophagy-IL6-USP14-CD274 signaling pathway in pancreatic cancer. A schematic model is proposed to illustrate how tumor immune surveillance and desmoplastic TME is regulated by CAF autophagy in pancreatic cancer. Therefore, targeting CAF autophagy improved the efficacy of immunochemotherapy of pancreatic cancer.

References

    1. Kleeff J, Korc M, Apte M, et al. Pancreatic cancer. Nat Rev Dis Primers. 2016;2(1). doi: 10.1038/nrdp.2016.22 - DOI - PubMed
    1. Ho WJ, Jaffee EM, Zheng L.. The tumour microenvironment in pancreatic cancer — clinical challenges and opportunities. Nat Rev Clin Oncol. 2020. Sep 01;17(9):527–540. - PMC - PubMed
    1. Binnewies M, Roberts EW, Kersten K, et al. Understanding the tumor immune microenvironment (TIME) for effective therapy. Nature Med. 2018. May 01;24(5):541–550. doi: 10.1038/s41591-018-0014-x - DOI - PMC - PubMed
    1. Emens LA, Cruz C, Eder JP, et al. Long-term clinical outcomes and biomarker analyses of atezolizumab therapy for patients with metastatic triple-negative breast cancer: a phase 1 study. JAMA Oncol. 2019 Jan 1;5(1):74–82. doi: 10.1001/jamaoncol.2018.4224 - DOI - PMC - PubMed
    1. Garon EB, Rizvi NA, Hui R, et al. Pembrolizumab for the treatment of non-small-cell lung cancer. N Engl J Med. 2015 May 21;372(21):2018–2028. doi: 10.1056/NEJMoa1501824 - DOI - PubMed

Publication types

MeSH terms