. 2024 Jan 4;147(1):9.
doi: 10.1007/s00401-023-02655-0.

Cryptic splicing of stathmin-2 and UNC13A mRNAs is a pathological hallmark of TDP-43-associated Alzheimer's disease

Affiliations

Cryptic splicing of stathmin-2 and UNC13A mRNAs is a pathological hallmark of TDP-43-associated Alzheimer's disease

Ana Rita Agra Almeida Quadros et al. Acta Neuropathol. .

Abstract

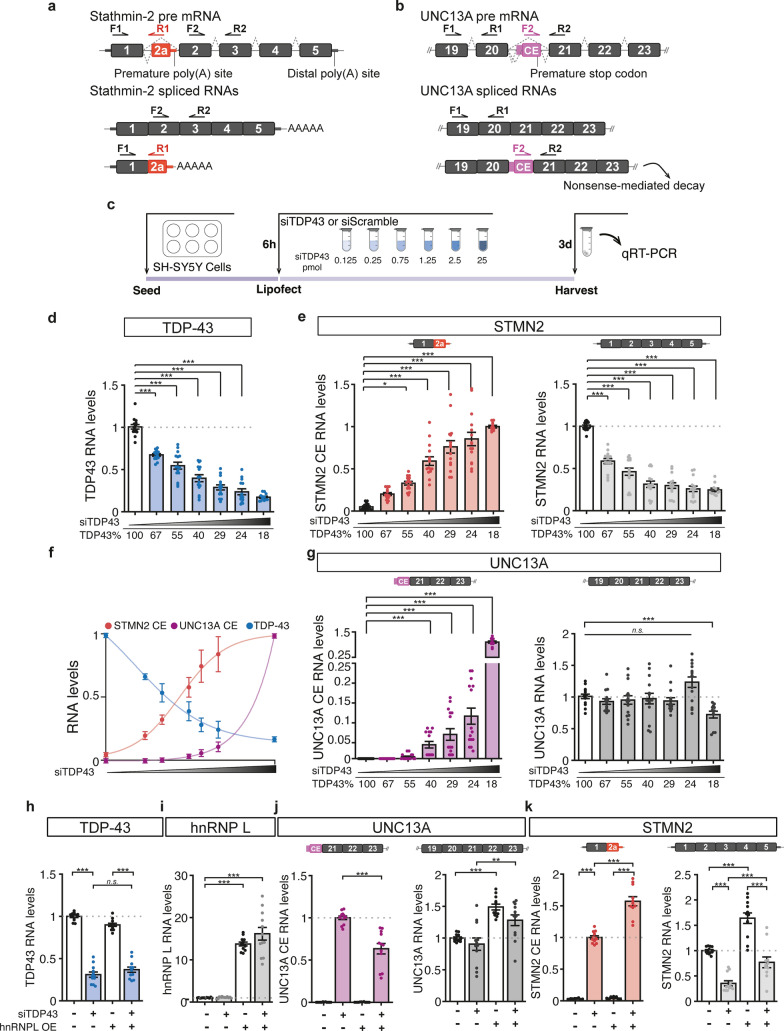
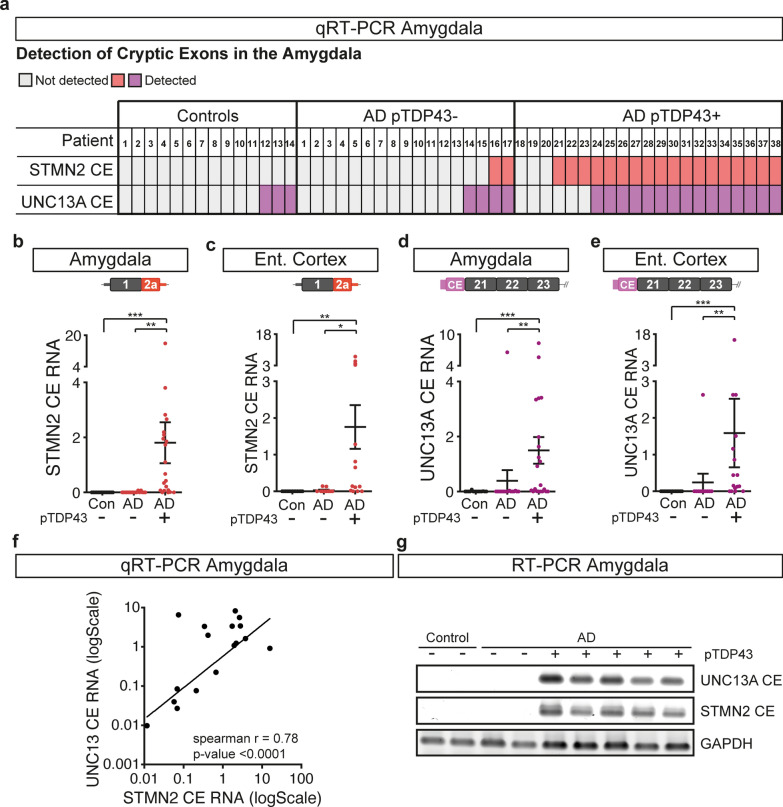
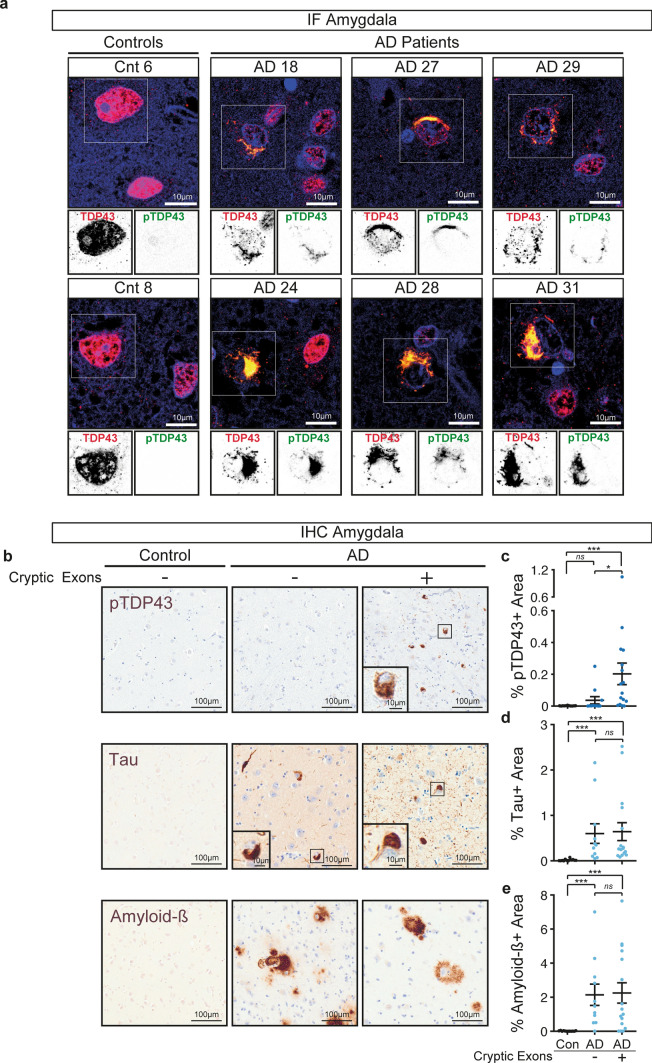
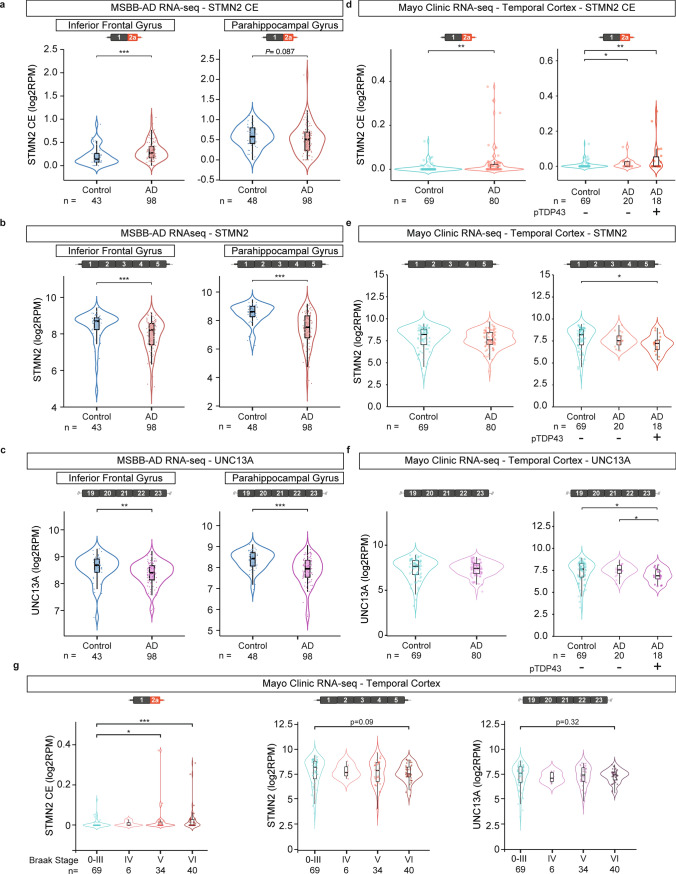
Nuclear clearance and cytoplasmic accumulations of the RNA-binding protein TDP-43 are pathological hallmarks in almost all patients with amyotrophic lateral sclerosis (ALS) and up to 50% of patients with frontotemporal dementia (FTD) and Alzheimer's disease. In Alzheimer's disease, TDP-43 pathology is predominantly observed in the limbic system and correlates with cognitive decline and reduced hippocampal volume. Disruption of nuclear TDP-43 function leads to abnormal RNA splicing and incorporation of erroneous cryptic exons in numerous transcripts including Stathmin-2 (STMN2, also known as SCG10) and UNC13A, recently reported in tissues from patients with ALS and FTD. Here, we identify both STMN2 and UNC13A cryptic exons in Alzheimer's disease patients, that correlate with TDP-43 pathology burden, but not with amyloid-β or tau deposits. We also demonstrate that processing of the STMN2 pre-mRNA is more sensitive to TDP-43 loss of function than UNC13A. In addition, full-length RNAs encoding STMN2 and UNC13A are suppressed in large RNA-seq datasets generated from Alzheimer's disease post-mortem brain tissue. Collectively, these results open exciting new avenues to use STMN2 and UNC13A as potential therapeutic targets in a broad range of neurodegenerative conditions with TDP-43 proteinopathy including Alzheimer's disease.

Keywords: Alzheimer’s disease; Cryptic exons; SCG-10; Stathmin-2; TARDBP; TDP-43; UNC13A.


Conflict of interest statement

The authors report no competing interests to declare.

Figures

Fig. 1
Fig. 1
Impact of reduced TDP-43 levels on the processing of STMN2 and UNC13A mRNAs. a, b Schemes representing STMN2 (a) and UNC13A (b) constitutive exons (black) and cryptic exons (CE, red and purple, respectively) that are included upon TDP-43 loss of function. Forward (F) and reverse (R) primers’ location used to quantify the different transcripts by qRT-PCR in eg, j, k are depicted. c Scheme of experimental design to test the sensitivity of UNC13A and STMN2 cryptic exons to TDP-43 knockdown in neuroblastoma (SH-SY5Y) cells treated with increasing amounts of siRNA against TDP-43 (siTDP43) for 3 days. dg qRT-PCR quantification of the RNA levels of TDP-43 (d, blue), STMN2 transcripts with cryptic exon (e, red), STMN2 full-length (e, light gray), UNC13A transcripts with cryptic exon (g, purple) and UNC13A full-length (g, dark gray). As control, cells were treated with a scramble siRNA. f Levels of TDP-43 (blue), STMN2 cryptic exon (red) and UNC13A cryptic exon (purple) in response to TDP-43 knockdown. Data were fitted using a non-linear curve-fit in Prism, and the x axis is plotted with a log10 scale. hk SH-SY5Y cells genetically modified to overexpress hnRNP L or a GFP control and treated with siRNA against TDP-43 for 3 days (2.5 pmol). qRT-PCR was used to determine the expression levels of TDP-43 (blue, h), hnRNP L (i, gray), UNC13A transcripts with (j, purple) and without cryptic exon (j, dark gray) and STMN2 transcripts with (k, red) and without cryptic exon (k, light gray). dk RNA levels were normalized to GAPDH and to the control group. Levels of full-length RNAs were normalized to cells treated with the control siRNA and transcripts with cryptic exons were normalized to cells treated with highest dose of TDP-43 siRNA. Results from 4 to 5 independent experiments were plotted with each dot representing a technical replicate and bars representing mean ± SEM. Normal distribution of data was tested using D’Agostino & Pearson test and one-way ANOVA, followed by Holm-Šídák’s Multiple comparisons post-hoc test (parametric) or Kruskal–Wallis, followed by a Dunn’s Multiple comparisons post-hoc test (non-parametric) were performed accordingly
Fig. 2
Fig. 2
STMN2 and UNC13A RNAs are mis-processed in post-mortem brain of approximately half of patients with Alzheimer’s disease. a Table depicting the detection of STMN2 (red) or UNC13A (purple) cryptic exons in the amygdala of controls and Alzheimer’s disease patients with (+) and without (−) phosphorylated TDP-43 pathology. be Levels of truncated STMN2 RNA (red) or UNC13A cryptic exon (purple) measured by qRT-PCR in post-mortem amygdala (b, d) or entorhinal cortex (c, e) from patients with Alzheimer’s disease (AD) associated ( +) or not (−) with accumulation of phosphorylated TDP-43. Normal distribution of data was tested using D’Agostino & Pearson test and a one-way ANOVA followed by a Sidak’s multiple comparisons post-hoc test (parametric), or a Kruskal–Wallis, followed by a Dunn’s Multiple comparisons post-hoc test (non-parametric) were performed accordingly. f Log–log plot of STMN2 and UNC13A cryptic exon levels detected in the amygdala of Alzheimer’s disease patients. Correlation was determined using spearman rank coefficient and curve fitting with non-linear regression. g RT-PCR confirming the detection of STMN2 and UNC13A cryptic exons in a subset of the patients with Alzheimer’s disease associated with phosphorylated TDP-43 (pTDP-43) pathology
Fig. 3
Fig. 3
Detection of cryptic exons in the amygdala from Alzheimer’s disease patients correlates with the burden of phosphorylated TDP-43 but not Tau or Amyloid-β. a Representative immunofluorescence images showing full-length TDP-43 (red), phosphorylated TDP-43 (green) and DAPI (blue) of two controls and six Alzheimer’s disease patients. Top panels show merged images and lower insets show grayscale images of TDP-43 or phosphorylated TDP-43. Scale bar is 10 µm. b Example micrographs of post-mortem brain tissue from one control and two Alzheimer’s disease patients after immunohistochemical detection of phosphorylated TDP-43 (pTDP43), total Tau and Amyloid-β. Scale bar is 100 µm in larger panels, and 10 µm in insets. ce Percentage of area occupied by phosphorylated TDP-43 (c), tau (d) or amyloid-β (e) staining in the amygdala of controls or Alzheimer’s disease patients with or without detection of cryptic exons. For each case five regions of interest of equal size were selected and the positive signal for the different markers determined and averaged. Data represent mean ± SEM, each dot represents an individual patient. Normal distribution of data was tested using D’Agostino & Pearson test and one-way ANOVA, followed by Holm-Šídák’s Multiple comparisons post-hoc test (parametric) or Kruskal–Wallis, followed by a Dunn’s Multiple comparisons post-hoc test (non-parametric) were performed accordingly
Fig. 4
Fig. 4
Analysis of STMN2 and UNC13A mRNAs in RNA-seq datasets from Alzheimer’s disease post-mortem tissues. Expression of STMN2 and UNC13A was analyzed using published RNA-seq datasets from the Mount Sinai/JJ Peters VA Medical Center Brain Bank (MSBB-AD) [97] (ac) and from the Mayo Clinic Brain Bank [2, 3, 98] (dg). Levels of STMN2 cryptic exon (red, a, d), STMN2 full-length transcript (red, b, e) and UNC13A full-length transcript expression (purple, c, f) were determined in the parahippocampal and inferior frontal gyri (ac) or temporal cortex (dg) of Alzheimer’s disease patients compared to controls. g Levels of STMN2 cryptic exon (left, red), STMN2 full-length (middle, red) and UNC13A full-length (right, purple) in post-mortem brain tissue from controls (Braak stage 0–III) and Alzheimer’s disease patients segregated according to their Braak stage (Braak stages IV–VI)

References

    1. Afroz T, Chevalier E, Audrain M, Dumayne C, Ziehm T, Moser R, Egesipe AL, Mottier L, Ratnam M, Neumann M, et al. Immunotherapy targeting the C-terminal domain of TDP-43 decreases neuropathology and confers neuroprotection in mouse models of ALS/FTD. Neurobiol Dis. 2023;179:106050. doi: 10.1016/j.nbd.2023.106050. - DOI - PubMed
    1. Allen M, Carrasquillo MM, Funk C, Heavner BD, Zou F, Younkin CS, Burgess JD, Chai HS, Crook J, Eddy JA, et al. Human whole genome genotype and transcriptome data for Alzheimer’s and other neurodegenerative diseases. Sci Data. 2016;3:160089. doi: 10.1038/sdata.2016.89. - DOI - PMC - PubMed
    1. Allen M, Wang X, Burgess JD, Watzlawik J, Serie DJ, Younkin CS, Nguyen T, Malphrus KG, Lincoln S, Carrasquillo MM, et al. Conserved brain myelination networks are altered in Alzheimer’s and other neurodegenerative diseases. Alzheimers Dement. 2018;14:352–366. doi: 10.1016/j.jalz.2017.09.012. - DOI - PMC - PubMed
    1. Alquezar C, Salado IG, de la Encarnacion A, Perez DI, Moreno F, Gil C, de Munain AL, Martinez A, Martin-Requero A. Targeting TDP-43 phosphorylation by casein kinase-1delta inhibitors: a novel strategy for the treatment of frontotemporal dementia. Mol Neurodegener. 2016;11:36. doi: 10.1186/s13024-016-0102-7. - DOI - PMC - PubMed
    1. Amador-Ortiz C, Lin WL, Ahmed Z, Personett D, Davies P, Duara R, Graff-Radford NR, Hutton ML, Dickson DW. TDP-43 immunoreactivity in hippocampal sclerosis and Alzheimer’s disease. Ann Neurol. 2007;61:435–445. doi: 10.1002/ana.21154. - DOI - PMC - PubMed

Publication types