. 2024 Jan 4;134(4):e170453.
doi: 10.1172/JCI170453.

Dynamic metabolism of endothelial triglycerides protects against atherosclerosis in mice

Affiliations

Dynamic metabolism of endothelial triglycerides protects against atherosclerosis in mice

Nabil E Boutagy et al. J Clin Invest. .

Abstract

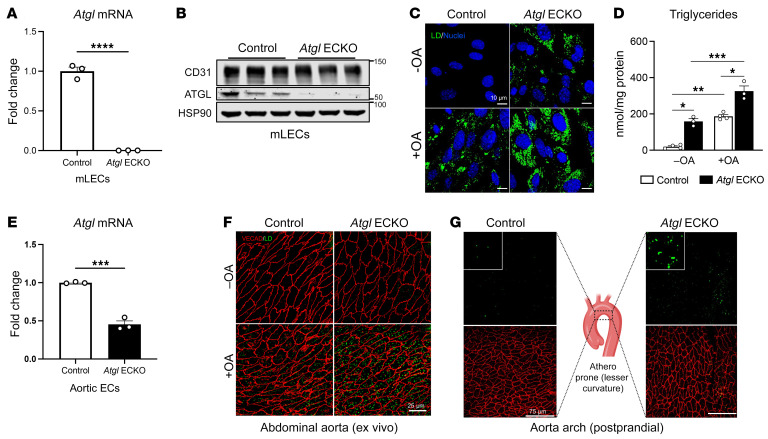
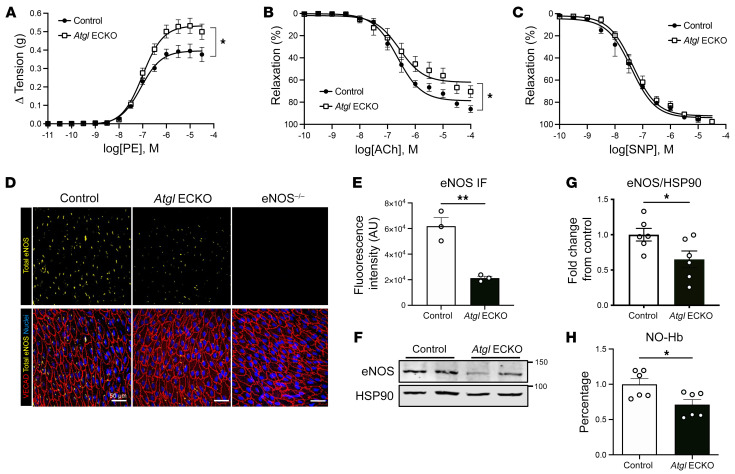
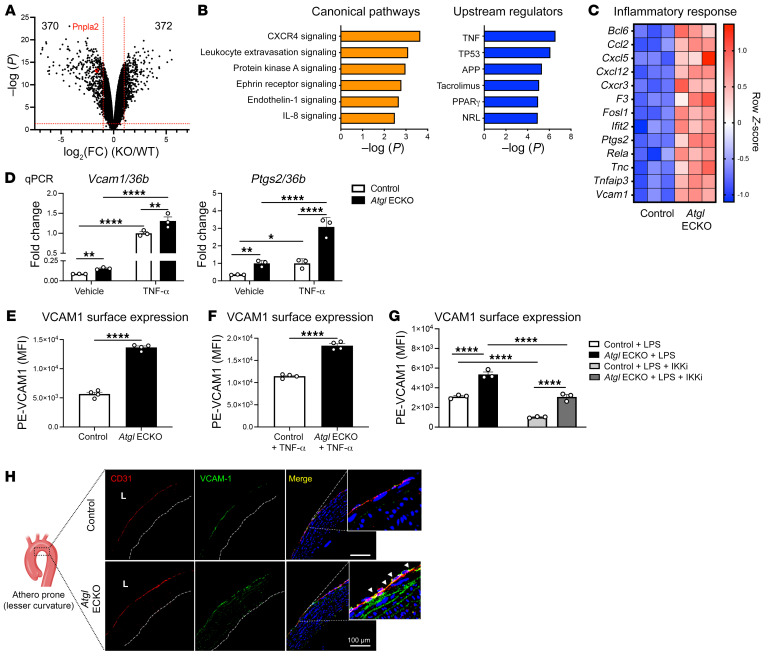
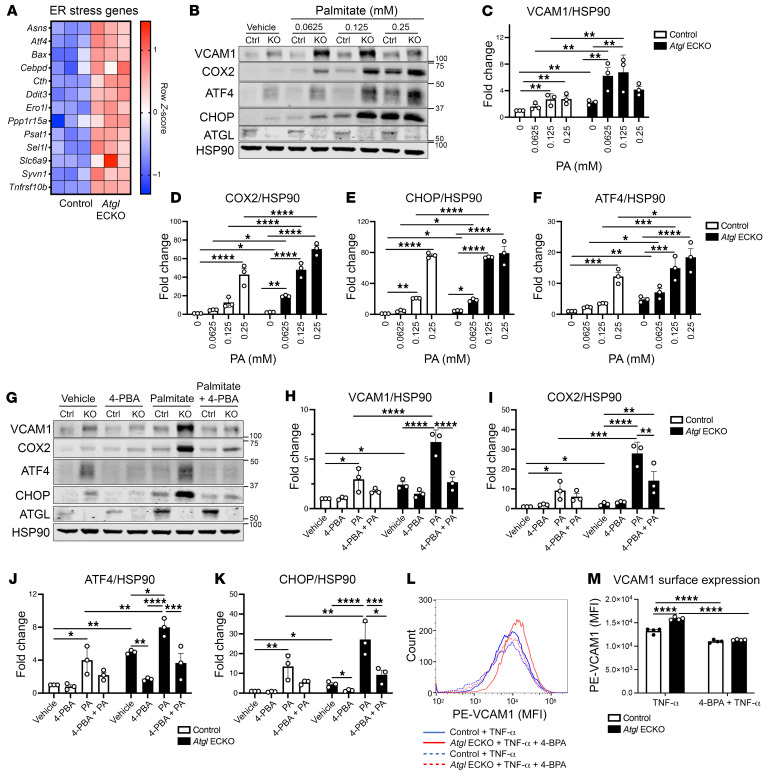
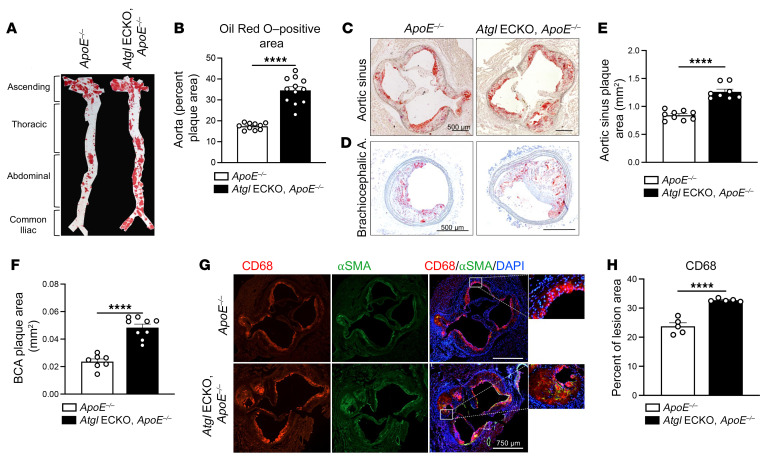
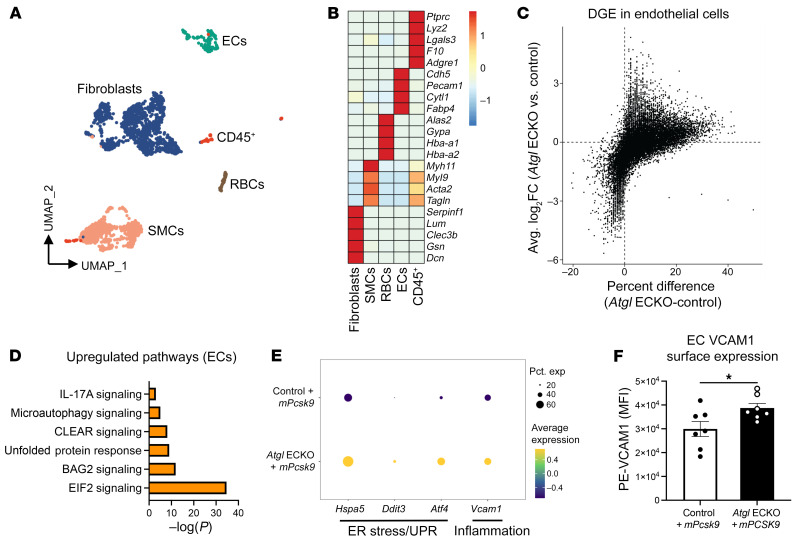
Blood vessels are continually exposed to circulating lipids, and elevation of ApoB-containing lipoproteins causes atherosclerosis. Lipoprotein metabolism is highly regulated by lipolysis, largely at the level of the capillary endothelium lining metabolically active tissues. How large blood vessels, the site of atherosclerotic vascular disease, regulate the flux of fatty acids (FAs) into triglyceride-rich (TG-rich) lipid droplets (LDs) is not known. In this study, we showed that deletion of the enzyme adipose TG lipase (ATGL) in the endothelium led to neutral lipid accumulation in vessels and impaired endothelial-dependent vascular tone and nitric oxide synthesis to promote endothelial dysfunction. Mechanistically, the loss of ATGL led to endoplasmic reticulum stress-induced inflammation in the endothelium. Consistent with this mechanism, deletion of endothelial ATGL markedly increased lesion size in a model of atherosclerosis. Together, these data demonstrate that the dynamics of FA flux through LD affects endothelial cell homeostasis and consequently large vessel function during normal physiology and in a chronic disease state.

Keywords: Atherosclerosis; Endothelial cells; Lipoproteins; Vascular Biology.


Figures

Figure 1
Figure 1. Loss of endothelial-specific ATGL leads to spontaneous vascular LD accumulation in vivo and ex vivo.
(A) qRT-PCR analysis of Atgl mRNA in LECs from control and Atgl ECKO mice (n = 3/group).****P < 0.0001, unpaired, 2-tailed Student’s t test. (B) Representative Western blot analysis showing ATGL protein levels in LECs isolated from control and Atgl ECKO mice. Each replicate is from 3 independent experiments. (C) Representative confocal fluorescence images of LD detected with BODIPY 493/503 (green) in cultured LECs in EGM-2 media supplemented with either vehicle (–OA) or 1 mM OA overnight. Hoechst 33342 (blue) was used for nuclei staining. (D) Corresponding TG levels quantified in cell lysates (n = 3–4/group). *P < 0.01; **P = 0.003; ***P = 0.0001, 1-way ANOVA with Tukey’s post test. Scale bars: 10 μm. (E) qRT-PCR analysis of Atgl mRNA in FACS-purified aortic ECs (CD31+CD45) from control and Atgl ECKO mice (n = 3/group). ***P < 0.001, unpaired, 2-tailed Student’s t test. (F) En face images of abdominal aorta from fasted control and Atgl ECKO mice exposed ex vivo to vehicle (–OA) or 1 mM BSA-complexed OA (+OA) in EGM-2 media for 4 hours (n = 5 mice/group). The aorta was immunostained for VE-cadherin (VECAD) (red), and LD were stained with BODIPY 493/503 (green). Scale bars: 25 μm. (G) En face images of LD formed in ascending aorta (lesser curvature) in vivo 3 hours after an olive oil oral gavage (10 mL/kg) in control (left panel) and Atgl ECKO mice (far right panel). LD were detected using BODIPY 493/503, and ECs were detected by immunostaining for VECAD. The middle panel is a schematic drawing that illustrates the area analyzed (n = 3/group). Scale bar: 75 μm. All data are represented as mean ± SEM.
Figure 2
Figure 2. ATGL deficiency leads to endothelial dysfunction.
(A) Cumulative concentration-response curves of developed isometric tension in response to PE in aortic rings harvested from control and Atgl ECKO mice. (B) Cumulative concentration-response curves representing percentages of relaxation of precontracted vessels in response to ACh and (C) the NO˙ donor, SNP, in aortic rings harvested from control and Atgl ECKO mice. Data are represented as mean values ± SEM of 5 to 6 individual experiments (4 rings per mouse). *P < 0.05, 2-way ANOVA with Šidák’s multiple-comparison test. (D) Representative confocal images of en face immunostaining of eNOS protein levels (yellow) in thoracic aorta from control (far left), Atgl ECKO (middle), and eNOS–/– (far right) mice processed and stained identically. ECs were detected by immunostaining for VECAD (red), and nuclei were stained with DAPI (blue). (E) Quantification of aortic images (n = 3/group). **P < 0.01, unpaired, 2-tailed Student’s t test. Scale bars: 50 μm. (F) Representative Western blot analysis showing eNOS protein levels in aortic homogenates of control and Atgl ECKO mice and (G) quantification of n = 6/group. *P < 0.05, unpaired, 2-tailed Student’s t test. (H) EPR determined nitrosyl-hemoglobin (NO-Hb) in venous blood as an index of NO bioavailability in control and Atgl ECKO mice. n = 6/group. *P < 0.05, unpaired, 2-tailed Student’s t test.
Figure 3
Figure 3. Loss of ATGL in the endothelium upregulates proinflammatory gene expression and VCAM1 surface levels.
(A) Volcano plot for differential expression genes (DEGs) from bulk RNA-Seq in LECs that fall above the threshold values ([log2(fold change [FC]) –1 or 1 and –log10(P) > 1.3], red lines) are pictured. Loss of ATGL upregulated 372 genes and downregulated 370 genes in LECs. Red colored dot represents Pnpla2 (ATGL gene name) for reference. (B) Canonical pathway analysis and URA of signaling pathways and gene regulators, respectively, that were significantly higher in Atgl ECKO compared with control LECs. (C) Clustered heatmap from RNA-Seq data showing significantly changed DEGs involved in inflammation between control and Atgl ECKO LEC (n = 3 replicates/group). (D) qRT-PCR analysis of Vcam1 and Ptgs2 mRNA in LECs at baseline and treated with mouse TNF-α overnight (10 ng/mL, 16 hours) from control and Atgl ECKO mice. n = 3/group. *P < 0.05; **P < 0.01; ****P < 0.0001, 2-way ANOVA with Šidák’s multiple-comparison test. (E) Basal and (F) TNF-α–stimulated (10 ng/mL,16 hours) surface VCAM1 levels between control and Atgl ECKO LECs (n = 4 replicates/group) determined by FACS and PE-VCAM1 (MFI). ****P < 0.0001, unpaired, 2-tailed Student’s t test. (G) Surface VCAM1 levels determined by FACS and PE-VCAM1 (MFI) following overnight (16 hours) LPS (1 μg/mL) treatment ± IKKi (10 μM, 30-minute pretreatment) in LECs. n = 3 replicates/group. ****P < 0.0001, 2-way ANOVA, Šidák’s multiple-comparison test. (H) Representative immunostaining analysis of VCAM1 (green), CD31 (red), and nuclei (DAPI, blue) in the ascending aorta (lesser curvature) from control and Atgl ECKO mice after an overnight fast. n = 3/group. L, lumen. Scale bars: 100 μm.
Figure 4
Figure 4. Loss of endothelial-specific ATGL leads to ER stress–induced inflammation.
(A) Clustered heatmap from RNA-Seq data showing significantly different DEGs involved in ER stress between control and Atgl ECKO LECs. n = 3 replicates/group. (B) Representative Western blot analysis showing higher baseline ER stress marker (ATF4, CHOP) protein levels as well as heightened ER stress and inflammatory (VCAM1, COX2) responsiveness to palmitate (0–0.25 mM, 16 hours) dosing between control and Atgl ECKO LECs. Quantification of VCAM1 (C), COX2 (D), CHOP (E), and ATF4 (F) from palmitate dosing. n = 3 independent experiments. *P < 0.05; **P < 0.01; ***P < 0.0001; ****P < 0.001, 2-way ANOVA, Šidák’s multiple-comparison test. (G) Representative Western blot analysis showing rescue of baseline VCAM1 and ER stress marker (ATF4, CHOP) levels as well as rescue of heightened VCAM1, COX2, ATF4, and CHOP levels in response to palmitate (100 μM, 16 hours) in the presence or absence of the global ER stress inhibitor 4-PBA (2.5 mM, 8-hour pretreatment) in Atgl ECKO LECs. Quantification of VCAM1 (H), COX2 (I), ATF4 (J), and CHOP (K) from G (n = 3 independent experiments). *P < 0.05; **P < 0.01; ***P < 0.001; ****P < 0.0001, 2-way ANOVA, Šidák’s multiple-comparison test. (L) Flow cytometry histogram of PE-VCAM1 between control LECs treated with TNF-α (solid blue), Atgl ECKO LECs treated with TNF-α (solid red), control LECs treated with TNF-α in the presence of 4-PBA (dashed blue), and Atgl ECKO LECs treated with TNF-α in the presence of 4-PBA (dashed red). (M) Quantification of MFI of PE-VCAM1 between control and Atgl ECKO following overnight (16 hours) TNF-α (10 ng/mL) in the presence or absence of 4-PBA (2.5 mM, 8-hour pretreatment). n = 4 replicates/group. ****P < 0.0001, 2-way ANOVA, Šidák’s multiple-comparison test.
Figure 5
Figure 5. Endothelial deficiency of ATGL accelerates atherosclerosis.
(A) Representative en face images of the luminal surface of mouse aorta (aortic root to common iliac bifurcation) stained for Oil Red O to delineate lipid-rich lesions between control and Atgl ECKO on an ApoE–/– background following 12 weeks of atherogenic diet feeding. (B) Corresponding quantification of plaque area as a percentage of total aortic luminal area (n = 10–12/group). ****P < 0.0001, unpaired, 2-tailed Student’s t test. (C) Representative histological staining of aortic sinus stained with Oil Red O and (D) BCA cross sections stained with Oil Red O and hematoxylin for plaque lesions. Scale bars: 500 μm. (E) Quantification of the absolute plaque area (n = 8–9/group) of lesions present in the aortic root and (F) BCA (n = 8–9/group). ****P < 0.0001, unpaired, 2-tailed Student’s t test. (G) Representative immunofluorescence images of aortic sinus cross sections staining of CD68+ macrophages (red) and smooth muscle α-actin+ (SMC) (green) cells. Nuclei were DAPI counterstained (blue) (n = 5/group). Scale bars: 750 μm. (H) Bar graph showing quantification of CD68-positive area as a percentage of plaque lesion area. ****P < 0.0001, unpaired, 2-tailed Student’s t test. Data are represented as mean ± SEM.
Figure 6
Figure 6. Endothelial deficiency of ATGL upregulates ER stress and proinflammatory gene expression in aortic ECs following a short-term atherogenic diet.
(A) Uniform manifold approximation and projection (UMAP) representation of aligned gene expression data in single cells extracted from aortas of control and Atgl ECKO mice injected with rAAV8-mPcsk9 and fed an atherogenic diet for 4 weeks. (B) Heatmap depicting gene-expression patterns of known markers of fibroblasts, SMCs, RBCs, ECs, and CD45+ immune cells. (C) Volcano plot depicting DGE patterns in the EC cluster between Atgl ECKO plus mPcsk9 compared with control plus mPcsk9 mice and expressed as log2 fold change along the y axis versus the percentage of cell expression of individual genes along the x axis. (D) Pathway enrichment of upregulated differentially expressed genes in the EC cluster between Atgl ECKO plus mPcsk9 compared with control plus mPcsk9 mice, expressed as log[–P], and analyzed by IPA. (E) Expression profiles in the EC cluster showing relative expression of the ER stress genes Hspa5, Ddit3, and Atf4 and the proinflammatory gene Vcam1 between control plus mPcsk9 and Atgl ECKO plus mPcsk9 mice. (F) Quantification of MFI of PE-VCAM1 in aortic ECs (CD31+CD45) between control plus mPcsk9 and Atgl ECKO plus mPcsk9. n = 7 replicates/group. *P < 0.05, unpaired, 2-tailed Student’s t test.

Comment in

  • Lipid droplets in the endothelium: The missing link between metabolic syndrome and cardiovascular disease?

References

    1. Boutagy NE, et al. Targeting the vasculature in cardiometabolic disease. J Clin Invest. 2022;132(6):e148556. doi: 10.1172/JCI148556. - DOI - PMC - PubMed
    1. Young SG, et al. A protein of capillary endothelial cells, GPIHBP1, is crucial for plasma triglyceride metabolism. Proc Natl Acad Sci U S A. 2022;119(36):e2211136119. doi: 10.1073/pnas.2211136119. - DOI - PMC - PubMed
    1. He C, et al. NanoSIMS analysis of intravascular lipolysis and lipid movement across capillaries and into cardiomyocytes. Cell Metab. 2018;27(5):1055–1066. doi: 10.1016/j.cmet.2018.03.017. - DOI - PMC - PubMed
    1. Son N-H, et al. Endothelial cell CD36 optimizes tissue fatty acid uptake. J Clin Invest. 2018;128(10):4329–4342. doi: 10.1172/JCI99315. - DOI - PMC - PubMed
    1. Hagberg CE, et al. Vascular endothelial growth factor B controls endothelial fatty acid uptake. Nature. 2010;464(7290):917–921. doi: 10.1038/nature08945. - DOI - PubMed