. 2024 Jan 4;134(4):e170490.
doi: 10.1172/JCI170490.

68Ga-FAPI PET imaging monitors response to combined TGF-βR inhibition and immunotherapy in metastatic colorectal cancer

Affiliations

68Ga-FAPI PET imaging monitors response to combined TGF-βR inhibition and immunotherapy in metastatic colorectal cancer

Ke Li et al. J Clin Invest. .

Abstract

BACKGROUNDImproving and predicting tumor response to immunotherapy remains challenging. Combination therapy with a transforming growth factor-β receptor (TGF-βR) inhibitor that targets cancer-associated fibroblasts (CAFs) is promising for the enhancement of efficacy of immunotherapies. However, the effect of this approach in clinical trials is limited, requiring in vivo methods to better assess tumor responses to combination therapy.METHODSWe measured CAFs in vivo using the 68Ga-labeled fibroblast activation protein inhibitor-04 (68Ga-FAPI-04) for PET/CT imaging to guide the combination of TGF-β inhibition and immunotherapy. One hundred thirty-one patients with metastatic colorectal cancer (CRC) underwent 68Ga-FAPI and 18F-fluorodeoxyglucose (18F-FDG) PET/CT imaging. The relationship between uptake of 68Ga-FAPI and tumor immunity was analyzed in patients. Mouse cohorts of metastatic CRC were treated with the TGF-βR inhibitor combined with KN046, which blocks programmed death ligand 1 (PD-L1) and CTLA-4, followed by 68Ga-FAPI and 18F-FDG micro-PET/CT imaging to assess tumor responses.RESULTSPatients with metastatic CRC demonstrated high uptake rates of 68Ga-FAPI, along with suppressive tumor immunity and poor prognosis. The TGF-βR inhibitor enhanced tumor-infiltrating T cells and significantly sensitized metastatic CRC to KN046. 68Ga-FAPI PET/CT imaging accurately monitored the dynamic changes of CAFs and tumor response to combined the TGF-βR inhibitor with immunotherapy.CONCLUSION68Ga-FAPI PET/CT imaging is powerful in assessing tumor immunity and the response to immunotherapy in metastatic CRC. This study supports future clinical application of 68Ga-FAPI PET/CT to guide precise TGF-β inhibition plus immunotherapy in CRC patients, recommending 68Ga-FAPI and 18F-FDG dual PET/CT for CRC management.TRIAL REGISTRATIONCFFSTS Trial, ChiCTR2100053984, Chinese Clinical Trial Registry.FUNDINGNational Natural Science Foundation of China (82072695, 32270767, 82272035, 81972260).

Keywords: Cancer immunotherapy; Colorectal cancer; Diagnostic imaging; Gastroenterology; Oncology.


Figures
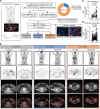
Figure 1
Figure 1. 68Ga-FAPI PET/CT imaging adds value to 18F-FDG PET/CT imaging for detection of metastasis in patients with CRC.
(A) Schematic flow of the patient selection process. In total, 131 patients with metastatic CRC who underwent both 68Ga-FAPI-04 and 18F-FDG PET/CT at the FUSCC were enrolled, including 21 patients with liver metastatic CRC, 98 with peritoneal metastatic CRC, and 12 with other metastases. Among them, 14 patients received surgery after imaging. The relationship between uptake of 68Ga-FAPI and tumor immunity was analyzed. Thirteen patients received immunotherapy after imaging. Patients who underwent 68Ga-FAPI PET/CT and 18F-FDG PET/CT were divided into 3 groups: FDG+FAPI, FDGFAPI+, and FDG+FAPI+. Proportions of each group are shown in the pie chart in the top right corner of the image. Scale bars: 50 μm. (B) Representative clinical 68Ga-FAPI PET/CT and 18F-FDG PET/CT images of patients with metastatic CRC. (C) Comparison of TBR SUVmax of 68Ga-FAPI and 18F-FDG in liver metastatic CRC tumors, n = 21. (D) Comparison of TBR SUVmax of 68Ga-FAPI and 18F-FDG in peritoneal metastatic CRC tumors, n = 98. All numerical data are presented as mean ± SEM. P < 0.0001 by Wilcoxon’s matched-pairs, signed-rank test (C and D).
Figure 2
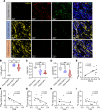
Figure 2. The SUVmax of 68Ga-FAPI PET/CT imaging negatively correlates with antitumor immunity in patients with metastatic CRC.
(A) Representative multi-IHC images of the 3 groups in clinical metastatic CRC samples. FAP-α (yellow), CD8 (red), CD4 (green), and DAPI (blue) were used for staining of cell nuclei. Scale bars: 50 μm. (BD) Quantification of staining for FAP-α, CD8, and CD4 for each group (FDG+FAPI, n = 3; FDGFAPI+, n = 4; FDG+FAPI+, n = 7). (EG) Correlation between CD8, CD4, and FAP-α levels and SUVmax of 68Ga-FAPI in the 14 enrolled patients with metastatic CRC (by Pearson’s correlation analysis). (H and I) Correlation between CD8 levels, CD4 levels, and SUVmax of 18F-FDG in the 14 enrolled patients with metastatic CRC (by Pearson’s correlation analysis). All numerical data are presented as mean ± SEM. *P < 0.05, **P < 0.01 by 1-way ANOVA with Kruskal-Wallis test (BD).
Figure 3
Figure 3. 68Ga-FAPI PET/CT as an imaging biomarker to assess therapeutic response to immunotherapy in patients with metastatic CRC.
Summary of clinical events and prognosis for the 13 patients with metastatic CRC who received immunotherapy after 68Ga-FAPI and 18F-FDG PET/CT. The 13 patients were divided into 3 groups: FDG+FAPI, n = 2; FDGFAPI+, n = 2; and FDG+FAPI+, n = 9. SD, stable disease; PR, partial response; PD, progressive disease; END, end of life. Created with BioRender (biorender.com).
Figure 4
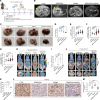
Figure 4. 68Ga-FAPI micro-PET/CT and 18F-FDG micro-PET/CT scans to assess tumor response to combined therapy with TGF-βR inhibitor and ICB KN046 in mice with colorectal peritoneal metastasis.
(A) Schematic of micro-MRI and PET imaging and treatment strategies in mice with MC38 peritoneal metastasis (4 groups, n = 6 per group). Created with BioRender. (B) Representative micro-MRI images of mice with peritoneal metastasis after the indicated treatments. Yellow arrows indicate tumor lesions. (C) Tumor weight of mice with MC38 peritoneal metastasis after the indicated treatments. (DF) Proportion of CD8+ T cells, CD8+IFN-γ+ T cells, and CD8+GZMB+ T cells in CD45+CD3+ cells in peritoneal metastasis tumors harvested from mice in the 4 groups as determined using flow cytometry. (G) Quantified tumor uptake of 68Ga-FAPI in mice with peritoneal metastasis (n = 6 per group). (H) Representative 68Ga-FAPI micro-PET/CT images of mice with peritoneal metastasis after the indicated treatments. B, bladder; K, kidney; T, tumor. (I) Quantified tumor uptake of 18F-FDG in mice with peritoneal metastasis (n = 6 per group). (J) Representative 18F-FDG micro-PET/CT images of mice with peritoneal metastasis after the indicated treatments. (K) Quantified IHC staining of FAP-α in the tumors of mice with peritoneal metastasis after the indicated treatments. (L) Representative IHC staining of FAP-α in the tumors of mice with peritoneal metastasis after the indicated treatments. Scale bars: 20 μm. All numerical data are presented as mean ± SEM. *P < 0.05, **P < 0.01, *** P < 0.001, by 1-way ANOVA with Dunnett’s correct multiple-comparison test (CG, I, and K).
Figure 5
Figure 5. 68Ga-FAPI micro-PET/CT and 18F-FDG micro-PET/CT imaging monitors responses to short-term TGF-β receptor inhibitor treatment in mice with colorectal peritoneal metastasis.
(A) Schematic representation of micro-PET/CT imaging and treatment strategies in mice with MC38 peritoneal metastasis (3 groups: control group, n = 5; SB525334 group, n = 15; and KN046 group, n = 5). Created with BioRender. (B) Representative 68Ga-FAPI micro-PET/CT images of mice with peritoneal metastasis before (day 0) and after (day 7) the indicated treatments. B, bladder; K, kidney; T, tumor. (C) Quantified tumor uptake of 68Ga-FAPI in mice with peritoneal metastasis before (day 0, n = 3 per group) and after (day 7) the indicated treatments. (D) Schematic of micro-PET/CT imaging and treatment strategies in mice with MC38 peritoneal metastasis (5 groups, n = 5 per group). Created with BioRender. (E) Quantified abdomen circumference in tumor-bearing mice with peritoneal metastasis in the 5 groups. (F) Tumor weight of mice with MC38 peritoneal metastasis after the indicated treatments. All numerical data are presented as mean ± SEM. *P < 0.05, **P < 0.01, by 1-way ANOVA with Dunnett’s correct multiple-comparison test (C, E, and F).
Figure 6
Figure 6. Using 68Ga-FAPI micro-PET/CT and 18F-FDG micro-PET/CT imaging to assess sensitization of colorectal liver metastases to ICB KN046 by TGF-β inhibition.
(A) Schematic representation of MRI and PET imaging and treatment strategies in mice with MC38 liver metastasis (4 groups, n = 6 per group). Created with BioRender. (B) Representative micro-MRI images of mice with MC38 liver metastasis after the indicated treatments. Yellow arrows indicate tumor lesions. (C) Representative liver images of mice with liver metastasis after the indicated treatments. (D) Liver weights of mice with MC38 liver metastasis after the indicated treatments. (EG) Proportion of CD8+ T cells, CD8+IFN-γ+ T cells, and CD8+GZMB+ T cells in CD45+ cells in liver metastasis harvested from mice of the 4 groups as measured using flow cytometry. (H) Representative 68Ga-FAPI micro-PET/CT images of mice with liver metastasis after the indicated treatments. B, bladder; K, kidney; T, tumor. (I) Quantified tumor uptake of 68Ga-FAPI in mice with liver metastasis (n = 3 per group). (J) Representative 18F-FDG micro-PET/CT images of mice with liver metastasis after the indicated treatments. (K) Quantified tumor uptake of 18F-FDG in mice with liver metastasis after the indicated treatments (n = 3 per group). (L) IHC staining of FAP-α in tumors of mice with liver metastasis after the indicated treatments. Scale bars: 20 μm. (M) Quantified IHC staining of FAP-α in tumors of mice with liver metastasis after the indicated treatments. All numerical data are presented as mean ± SEM. *P < 0.05, **P < 0.01 by 1-way ANOVA with Dunnett’s correct multiple-comparison test (DG, I, K, and M).
Figure 7
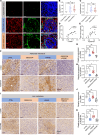
Figure 7. 68Ga-FAPI PET/CT imaging reflects abundance of both myCAFs and iCAFs in metastatic CRC.
(A) Multicolor immunofluorescence staining of α-SMA+ myCAFs (red) and PDGFRA+ iCAFs (green) in tumor tissues from the 14 patients with CRC who received surgery after 68Ga-FAPI and 18F-FDG PET/CT imaging at the FUSCC. Scale bars: 50 μm. (B and C) Quantified multi-immunofluorescence staining of α-SMA and PDGFRA in the tumors of 14 patients with CRC divided into 3 groups. (D) Positive correlation between α-SMA and 68Ga-FAPI SUVmax in the 14 clinical CRC samples (by Pearson’s correlation analysis). (E) Positive correlation between PDGFRA and 68Ga-FAPI SUVmax in the 14 clinical CRC samples (by Pearson’s correlation analysis). (FK) Representative IHC staining and quantitative analyses of α-SMA and PDGFRA expression in both peritoneal metastasis and liver metastasis of mice with CRC treated with the indicated therapies. Scale bars: 50 μm. All numerical data are presented as mean ± SEM. *P < 0.05, **P < 0.01 by 1-way ANOVA with Kruskal-Wallis H test (B and C) and 1-way ANOVA with Dunnett’s correct multiple comparison test (G, H, J, and K).
Figure 8
Figure 8. TGF-β inhibition suppresses CAFs and increases antitumor immunity in metastatic CRC tumors.
(A) Gene set enrichment analysis (GSEA) of the TGF-β signaling pathway in liver metastasis treated with the indicated therapies compared with control (n = 4 per group). (B) GSEA of the granzyme-mediated programmed cell death pathway in liver metastasis treated with the indicated therapies compared with control (n = 4 per group). (C) Heatmap showing scaled normalized expression of marker genes in iCAFs, myCAFs, and granzymes for killer-cell cytotoxicity, interleukin signaling, and T cell activation pathways. (D) A working model showing that TGF-β inhibition reduces CAFs to improve antitumor immunity and increase efficacy of ICBs for cancer treatment.

References

    1. Siegel RL, et al. Cancer statistics, 2022. CA Cancer J Clin. 2022;72(1):7–33. doi: 10.3322/caac.21708. - DOI - PubMed
    1. Franko J, et al. Prognosis of patients with peritoneal metastatic colorectal cancer given systemic therapy: an analysis of individual patient data from prospective randomised trials from the Analysis and Research in Cancers of the Digestive System (ARCAD) database. Lancet Oncol. 2016;17(12):1709–1719. doi: 10.1016/S1470-2045(16)30500-9. - DOI - PubMed
    1. Nagata H, et al. Survival and prognostic factors for metachronous peritoneal metastasis in patients with colon cancer. Ann Surg Oncol. 2017;24(5):1269–1280. doi: 10.1245/s10434-016-5732-z. - DOI - PubMed
    1. Morris VK, et al. Treatment of metastatic colorectal cancer: ASCO guideline. J Clin Oncol. 2023;41(3):678–700. doi: 10.1200/JCO.22.01690. - DOI - PMC - PubMed
    1. André T, et al. Pembrolizumab in microsatellite-instability-high advanced colorectal cancer. N Engl J Med. 2020;383(23):2207–2218. doi: 10.1056/NEJMoa2017699. - DOI - PubMed