. 2024 Feb;300(2):105620.
doi: 10.1016/j.jbc.2023.105620. Epub 2024 Jan 3.

SARM1 regulates NAD+-linked metabolism and select immune genes in macrophages

Affiliations

SARM1 regulates NAD+-linked metabolism and select immune genes in macrophages

Katharine A Shanahan et al. J Biol Chem. 2024 Feb.

Abstract

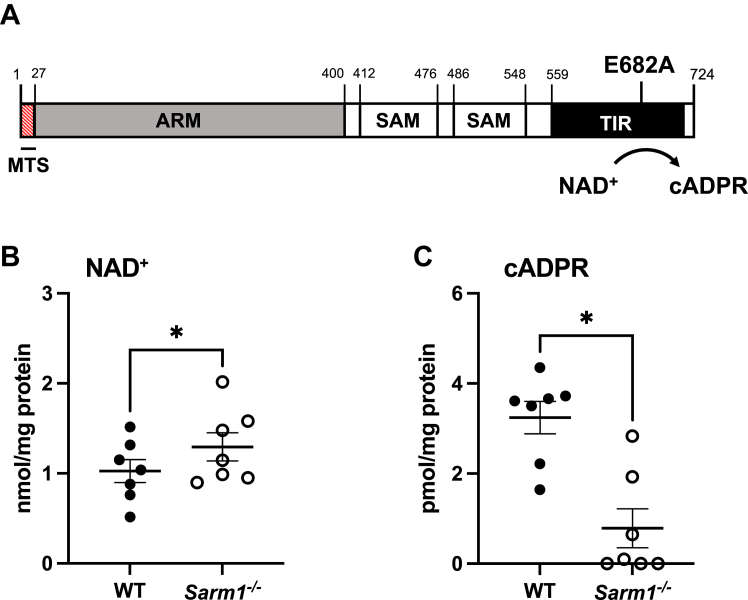
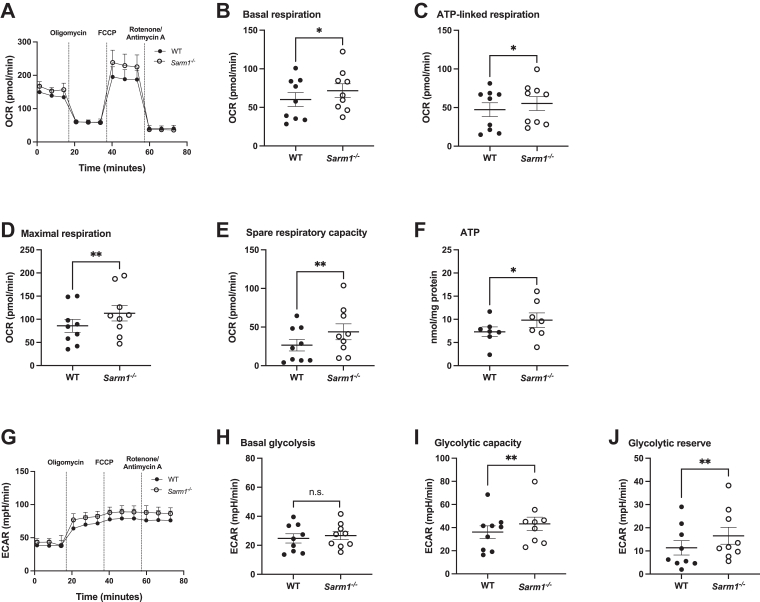
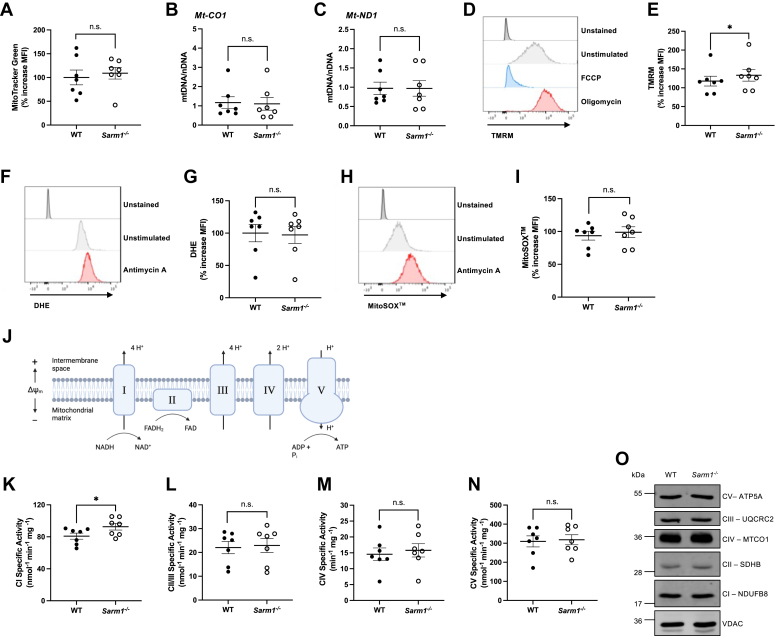
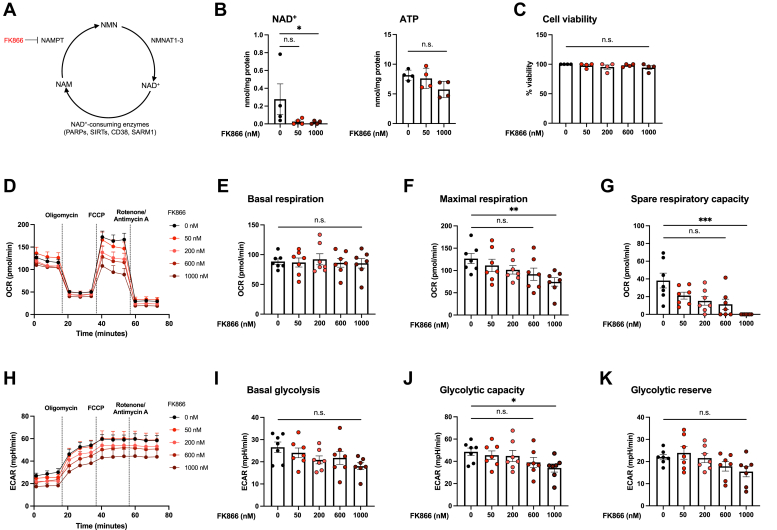
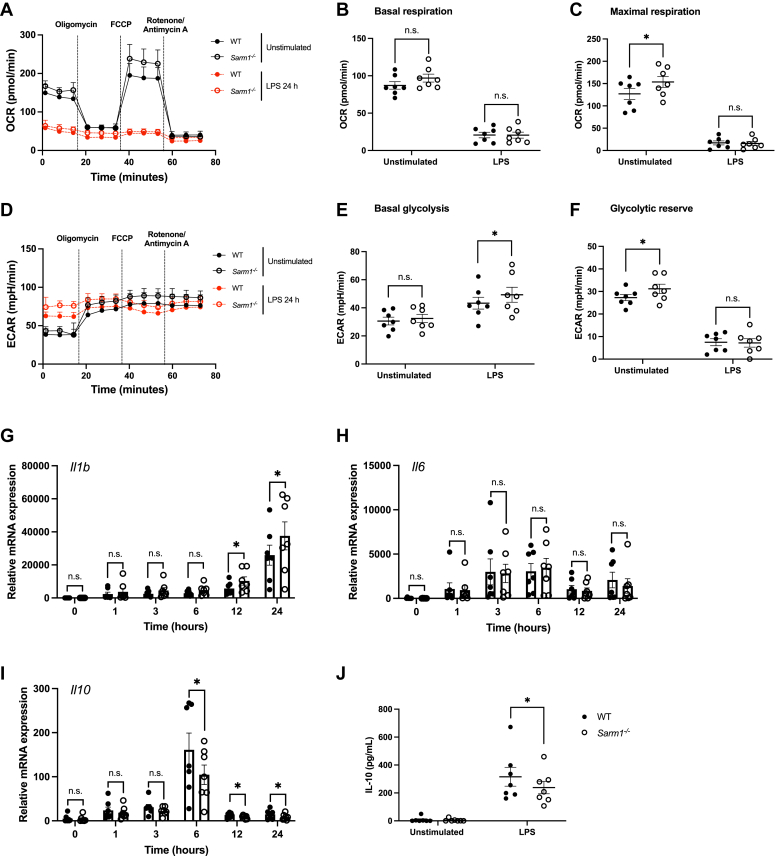
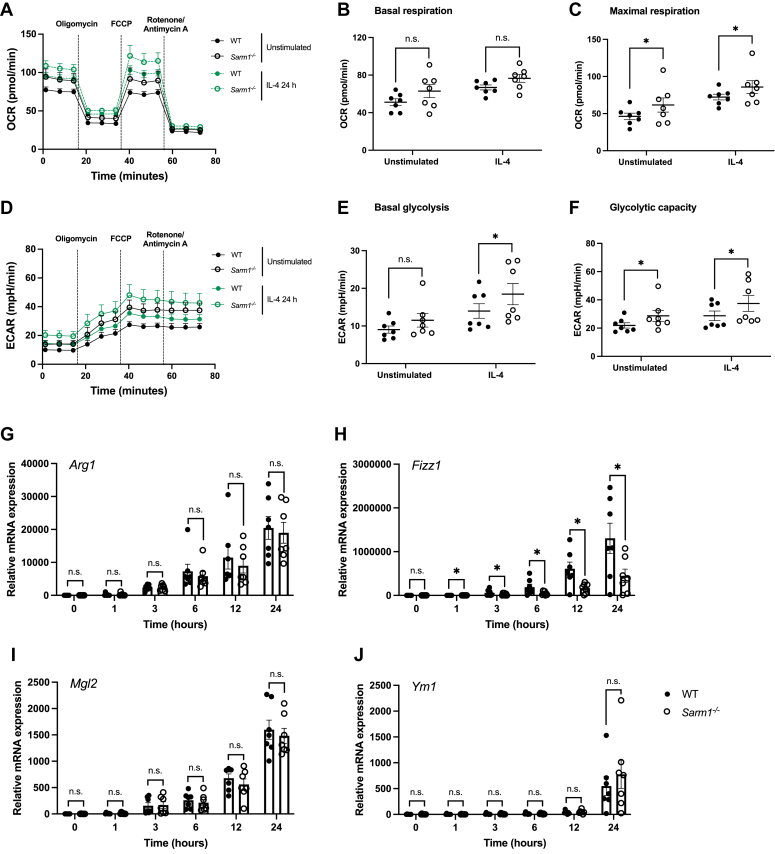
Sterile alpha and HEAT/armadillo motif-containing protein (SARM1) was recently described as a NAD+-consuming enzyme and has previously been shown to regulate immune responses in macrophages. Neuronal SARM1 is known to contribute to axon degeneration due to its NADase activity. However, how SARM1 affects macrophage metabolism has not been explored. Here, we show that macrophages from Sarm1-/- mice display elevated NAD+ concentrations and lower cyclic ADP-ribose, a known product of SARM1-dependent NAD+ catabolism. Further, SARM1-deficient macrophages showed an increase in the reserve capacity of oxidative phosphorylation and glycolysis compared to WT cells. Stimulation of macrophages to a proinflammatory state by lipopolysaccharide (LPS) revealed that SARM1 restricts the ability of macrophages to upregulate glycolysis and limits the expression of the proinflammatory gene interleukin (Il) 1b, but boosts expression of anti-inflammatory Il10. In contrast, we show macrophages lacking SARM1 induced to an anti-inflammatory state by IL-4 stimulation display increased oxidative phosphorylation and glycolysis, and reduced expression of the anti-inflammatory gene, Fizz1. Overall, these data show that SARM1 fine-tunes immune gene transcription in macrophages via consumption of NAD+ and altered macrophage metabolism.

Keywords: NAD(+); NADase; SARM1; cADPR; cytokine induction; macrophages; metabolism.


Conflict of interest statement

Conflict of interest The authors declare that they have no conflicts of interest with the contents of this article.

Figures

Figure 1
Figure 1
Macrophages lacking SARM1 display altered cellular NAD+and cADPR levels.A, domain organization of murine SARM1. SARM1 contains 724 amino acids and consists of a N-terminal MTS (red), an ARM domain (gray), two tandem SAM domains (white), and a C-terminal TIR domain (black). The catalytic residue for the NADase activity of murine SARM1 is a glutamate residue at position 682 (E682) in the TIR domain, which is responsible for cleavage of NAD+ to cADPR. B and C, cellular nucleotides were extracted from WT and Sarm1−/− BMDM. NAD+ levels were determined by HPLC (B), and cADPR concentrations were measured by cycling assay (C) and values were normalized to protein. Data are from seven independent experiments. Significance tested using two-tailed Wilcoxon matched-pairs signed-rank test; ∗p < 0.05. ARM, armadillo repeat; BMDM, bone marrow–derived macrophage; cADPR, cyclic ADP-ribose; MTS, mitochondrial-targeting sequence; SARM1, sterile alpha and HEAT/armadillo motif–containing protein; TIR, toll-interleukin-1R.
Figure 2
Figure 2
Removal of SARM1 alters macrophage oxidative phosphorylation and glycolysis. Real time changes in OCR and ECAR in unstimulated WT and Sarm1−/− BMDM were measured by Seahorse XF analysis. Representative OCR (A) and ECAR (G) traces of nine independent experiments and each experiment was performed with six technical replicates. Dotted lines indicate injection times of mitochondrial inhibitors, oligomycin (1 μM), FCCP (1 μM), rotenone (1 μM), and antimycin A (2 μM). Basal respiration (B), maximal respiration (C), ATP-linked respiration (D), spare respiratory capacity (E), basal glycolysis (H), glycolytic capacity (I), and glycolytic reserve (J) were calculated and displayed as scattered dot plots. B–E and H–J, data are mean ± SEM from nine independent experiments. F, cellular nucleotides were extracted from WT and Sarm1−/− BMDM and ATP levels were determined by HPLC. Data are from seven independent experiments. Significance tested using two-tailed Wilcoxon matched-pairs signed-rank test; ∗p < 0.05, ∗∗p < 0.01. BMDM, bone marrow–derived macrophage; ECAR, extracellular acidification rate; OCR, oxygen consumption rate; SARM1, sterile alpha and HEAT/armadillo motif–containing protein.
Figure 3
Figure 3
SARM1-deficient BMDM exhibit increased ΔΨmand complex I–specific activity, but do not differ in mitochondrial mass or ROS production.A–C, mitochondrial mass was assessed in unstimulated WT and Sarm1−/− BMDM. A, cells were stained with 50 nM MitoTracker Green and analyzed using LSRFortessa. Changes in mitochondrial mass were determined by MFI and presented relative to WT cells. B and C, mitochondrial DNA (mt-CO1 and mt-ND1) was assayed by quantitative RT-PCR and normalized to nuclear DNA. D and E, ΔΨm was measured in unstimulated BMDM using 100 nM TMRM and acquired on LSRFortessa. D, flow cytometry histogram showing experimental controls for ΔΨm. Oligomycin (1 μM) was used as a positive control for TMRM staining and treatment resulted in a peak shift to the right, indicating increased fluorescence. FCCP (50 μM) was used as a negative control and treatment resulted in a peak shift to the left, indicating decreased fluorescence. E, changes in ΔΨm between WT and Sarm1−/− BMDM were determined by MFI and are presented relative to WT cells. F, flow cytometry histogram showing experimental controls for cellular ROS. Antimycin A (1 μM) was used as a positive control for DHE staining and treatment resulted in a peak shift to the right, indicating increased fluorescence. G, unstimulated WT and Sarm1−/− BMDM were analyzed for cellular ROS using 20 μM DHE and acquired on LSRFortessa. Changes in cellular ROS were determined by MFI and are presented relative to WT cells. H, flow cytometry histogram showing experimental controls for mitochondrial ROS. Antimycin A (1 μM) was used as a positive control for MitoSOX staining and treatment resulted in a peak shift to the right, indicating increased fluorescence. I, unstimulated WT and Sarm1−/− BMDM were analyzed for changes in mitochondrial ROS using 5 μM MitoSOX and acquired on LSRFortessa. Changes in mitochondrial ROS were determined by MFI and are presented relative to WT cells. J, diagram of ETC. K–O, mitochondria were isolated from WT and Sarm1−/− BMDM and protein was quantified by Bradford assay. Ten micrograms of mitochondrial protein was added to each assay. Complex I (K), complex II/III (L), complex IV (M), and complex V (N) activities were determined spectrophotometrically and presented as nmol per mg of mitochondrial protein. O, representative immunoblot of three biological replicates. Ten micrograms of mitochondrial protein was immunoblotted for components of the ETC: NDUFB8 (complex I subunit), SDHB (complex II subunit), UQCRC2 (complex III subunit), MTCO1 (complex IV subunit), and ATP5A (complex V) and VDAC as the loading control. A–C, E, G, I, K–N, scattered dot plots show mean ± SEM from seven independent experiments (n = 7) and each experiment was performed with three technical replicates. Significance tested using two-tailed Wilcoxon matched-pairs signed-rank test; ∗p < 0.05, n.s., no significant difference. BMDM, bone marrow–derived macrophage; ETC, electron transport chain; MF1, median fluorescence intensity; SARM1, sterile alpha and HEAT/armadillo motif–containing protein; TMRM, tetramethylrhodamine methyl ester.
Figure 4
Figure 4
Depletion of cellular NAD+reduces maximal respirationand glycolysis in macrophages.A, schematic of the NAD+ salvage pathway, indicating the point at which FK866 inhibits. B, BMDM were treated with 50 nM or 1000 nM FK866 for 18 h, followed by nucleotide extraction. NAD+ and ATP concentrations determined by HPLC analysis and values were normalized to protein. C, WT BMDM were treated with indicated concentrations of FK866 for 18 h and cell viability was measured by viability staining using Zombie Aqua. D–K, WT BMDM were treated with indicated concentrations of FK866 for 18 h and real-time changes in OCR and ECAR were measured by Seahorse XF analysis. Representative OCR (D) and ECAR (H) trace of seven independent experiments and each experiment was performed with five technical replicates. Dotted lines indicate injection times of mitochondrial inhibitors, oligomycin (1 μM), FCCP (1 μM), rotenone (1 μM), and antimycin A (2 μM). Basal respiration (E), maximal respiration (F), spare respiratory capacity (G), basal glycolysis (I), glycolytic capacity (J), and glycolytic reserve (K) were calculated and displayed as bar charts. B and C, data are mean ± SEM from four independent experiments and each experiment was performed with three technical replicates. E−G and I–K, data are mean ± SEM from seven independent experiments and each experiment was performed with five technical replicates. Significance tested using Kruskal–Wallis test; ∗p < 0.05, ∗∗p < 0.01, and ∗∗∗p < 0.001, n.s., no significant difference. BMDM, bone marrow–derived macrophage; ECAR, extracellular acidification rate; OCR, oxygen consumption rate.
Figure 5
Figure 5
SARM1 inhibits the upregulation of glycolysis in proinflammatory macrophages and alters the expression of Il1b and Il10.A–F, WT and Sarm1−/− BMDM were treated with 100 ng/ml LPS for 24 h and real-time changes in OCR and ECAR were measured by Seahorse XF analysis. Representative OCR (A) and ECAR (D) trace of seven independent experiments and each experiment was performed with six technical replicates. Dotted lines indicate injection times of mitochondrial inhibitors, oligomycin (1 μM), FCCP (1 μM), rotenone (1 μM), and antimycin A (2 μM). Basal respiration (B), maximal respiration (C), basal glycolysis (E), and glycolytic reserve (F) were calculated and displayed as scattered dot plots. Data are mean ± SEM from seven independent experiments and each experiment was performed with six technical replicates. G–I, WT and Sarm1−/− BMDM were treated with 100 ng/ml LPS for the indicated times. Expression of Il1b (G), Il6 (H), and Il10 (I) mRNA were assayed by quantitative RT-PCR and normalized to the housekeeping gene β-actin. J, WT and Sarm1−/− BMDM were stimulated with 100 ng/ml LPS for 24 h. Supernatants were assayed for IL-10 protein. Data are mean ± SEM from seven independent experiments and each experiment was performed with three technical replicates. Significance tested using two-tailed Wilcoxon matched-pairs signed-rank test; ∗p < 0.05, n.s., no significant difference. BMDM, bone marrow–derived macrophage; ECAR, extracellular acidification rate; IL, interleukin; LPS, lipopolysaccharide; OCR, oxygen consumption rate; SARM1, sterile alpha and HEAT/armadillo motif-containing protein.
Figure 6
Figure 6
Anti-inflammatory macrophages lacking SARM1 display increased oxidative phosphorylation and glycolysis, but reduced Fizz1 expression.A–F, WT and Sarm1−/− BMDM were treated with 20 ng/ml IL-4 for 24 h and real-time changes in OCR and ECAR were measured by Seahorse XF analysis. Representative OCR (A) and ECAR (D) trace of seven independent experiments and each experiment was performed with six technical replicates. Dotted lines indicate injection times of mitochondrial inhibitors, oligomycin (1 μM), FCCP (1 μM), rotenone (1 μM), and antimycin A (2 μM). Basal respiration (B), maximal respiration (C), basal glycolysis (E), and glycolytic capacity (F) were calculated and displayed as scattered dot plots. Data are mean ± SEM from seven independent experiments and each experiment was performed with six technical replicates. G–J, WT and Sarm1−/− BMDM were treated with 20 ng/ml IL-4 for the indicated times. Expression of Arg1 (G), Fizz1 (H), Mgl2 (I), and Ym1 (J) mRNA were assayed by quantitative RT-PCR and normalized to the housekeeping gene β-actin. Significance tested using two-tailed Wilcoxon matched-pairs signed-rank test; ∗p < 0.05, n.s., no significant difference. BMDM, bone marrow–derived macrophage; ECAR, extracellular acidification rate; IL, interleukin; OCR, oxygen consumption rate; SARM1, sterile alpha and HEAT/armadillo motif-containing protein.

References

    1. Cantó C., Menzies K.J., Auwerx J. NAD(+) metabolism and the control of energy homeostasis: a balancing act between mitochondria and the nucleus. Cell Metab. 2015;22:31–53. - PMC - PubMed
    1. Russell D.G., Huang L., VanderVen B.C. Immunometabolism at the interface between macrophages and pathogens. Nat. Rev. Immunol. 2019;19:291–304. - PMC - PubMed
    1. Xie N., Zhang L., Gao W., Huang C., Huber P.E., Zhou X., et al. NAD+ metabolism: pathophysiologic mechanisms and therapeutic potential. Signal Transduct. Target Ther. 2020;5:227. - PMC - PubMed
    1. Covarrubias A.J., Perrone R., Grozio A., Verdin E. NAD+ metabolism and its roles in cellular processes during ageing. Nat. Rev. Mol. Cell Biol. 2021;22:119–141. - PMC - PubMed
    1. Piedra-Quintero Z.L., Wilson Z., Nava P., Guerau-de-Arellano M. CD38: an immunomodulatory molecule in inflammation and autoimmunity. Front Immunol. 2020;11 - PMC - PubMed

Publication types

LinkOut - more resources