. 2024 Feb 26;11(2):ENEURO.0365-23.2023.
doi: 10.1523/ENEURO.0365-23.2023. Print 2024 Feb.

Mild Deficits in Fear Learning: Evidence from Humans and Mice with Cerebellar Cortical Degeneration

Affiliations

Mild Deficits in Fear Learning: Evidence from Humans and Mice with Cerebellar Cortical Degeneration

Giorgi Batsikadze et al. eNeuro. .

Abstract

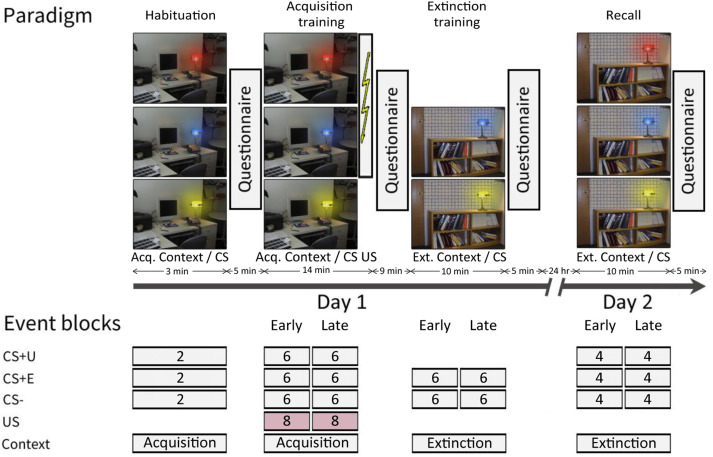
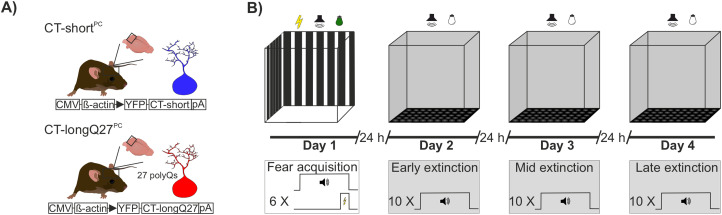
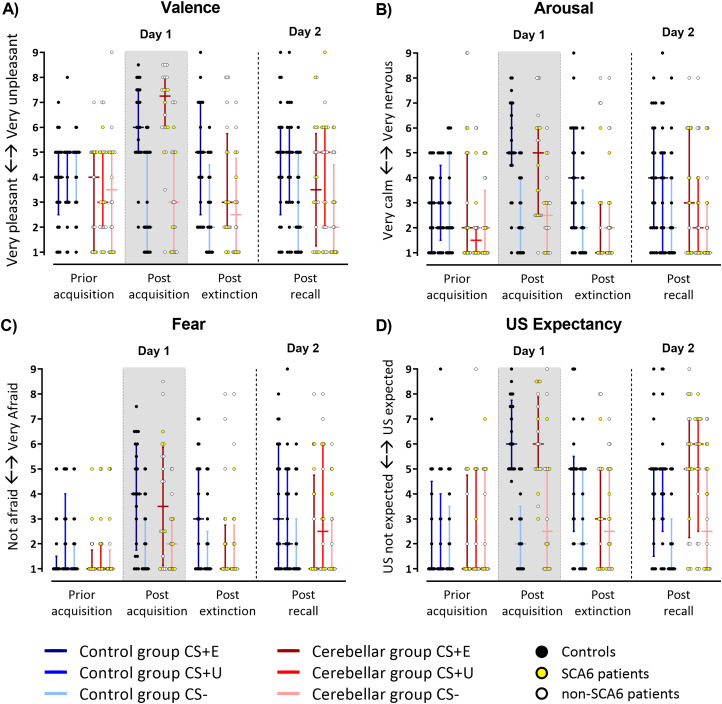
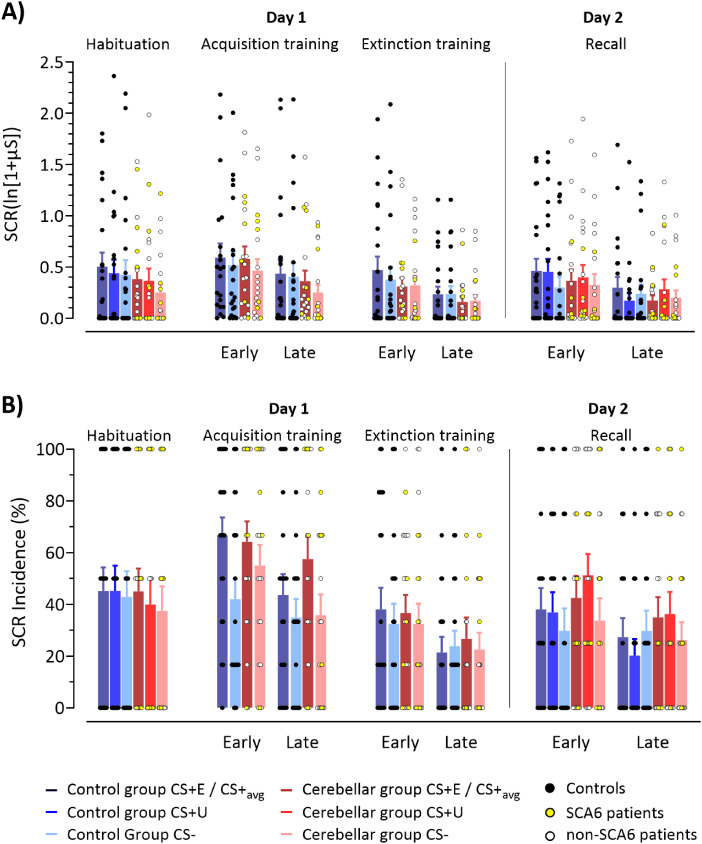
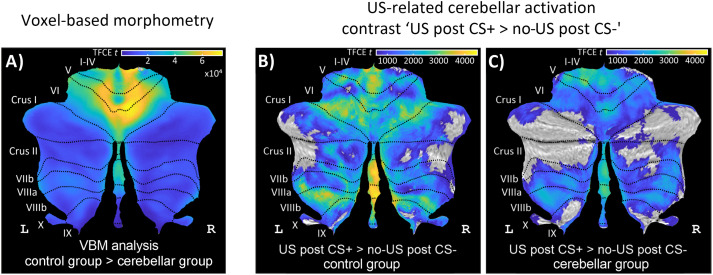
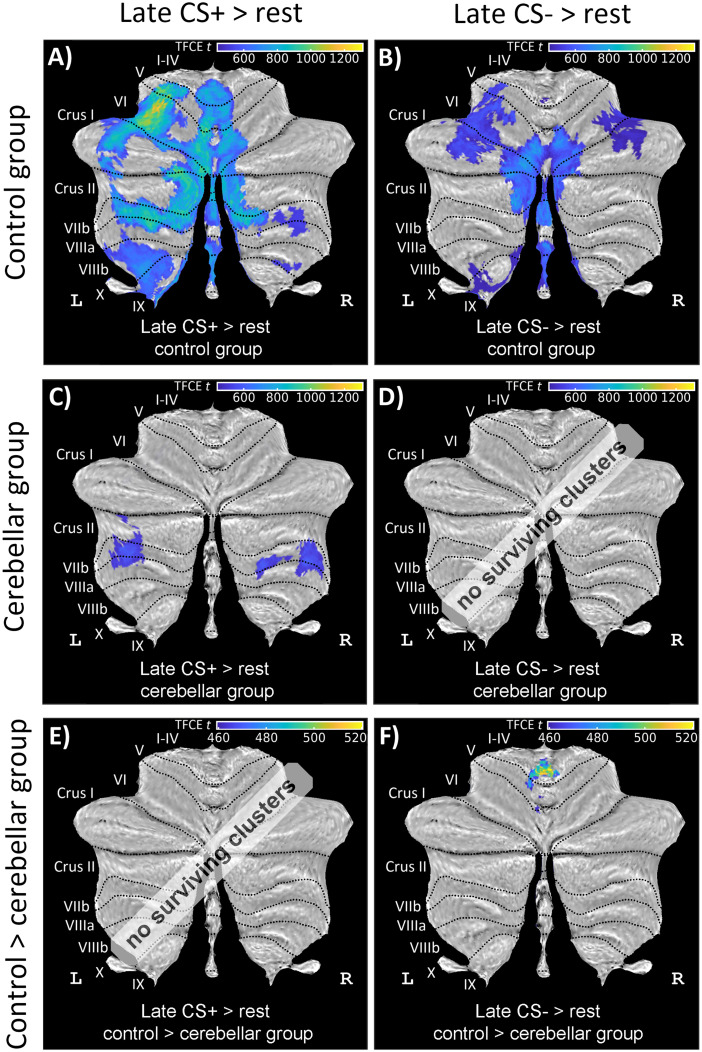
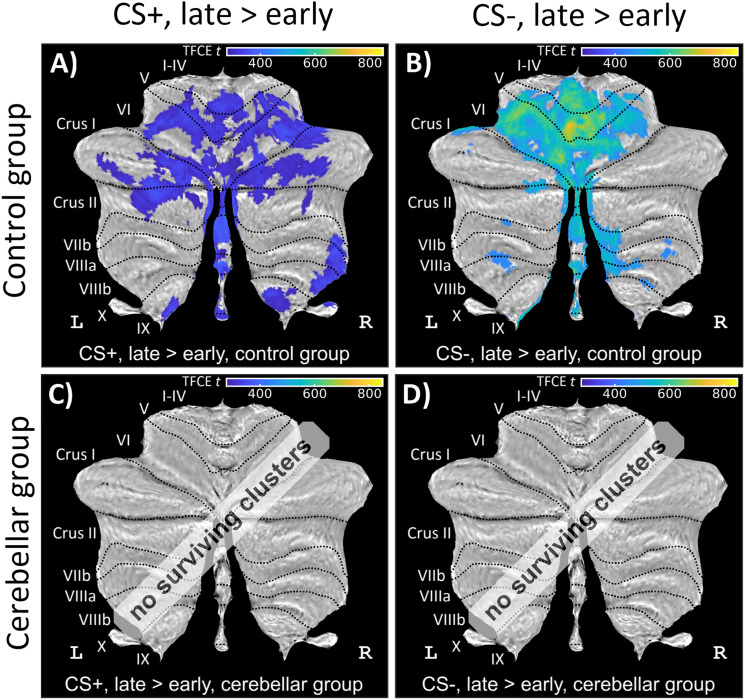
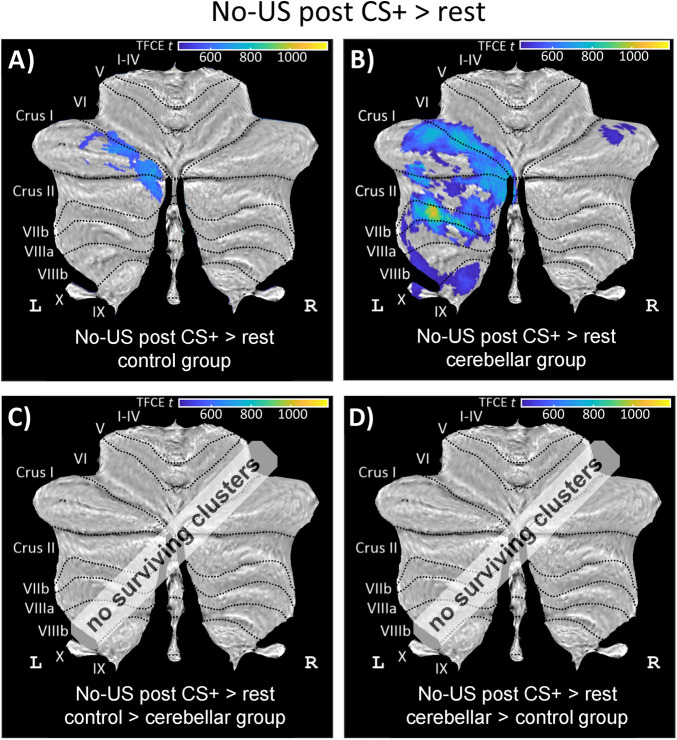
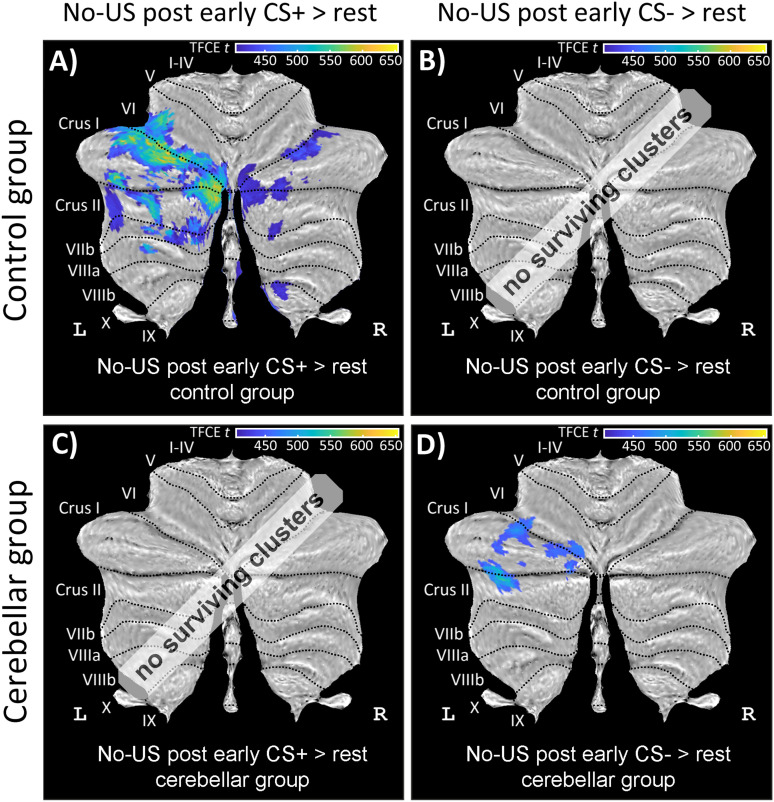
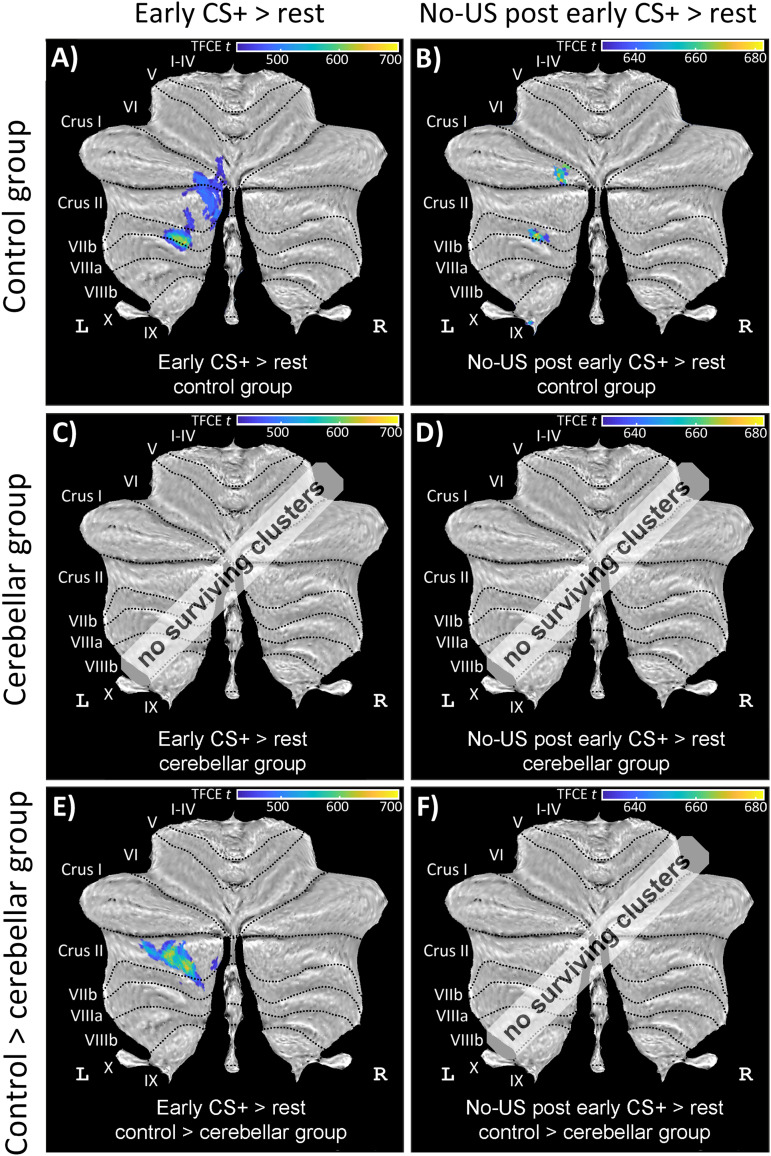
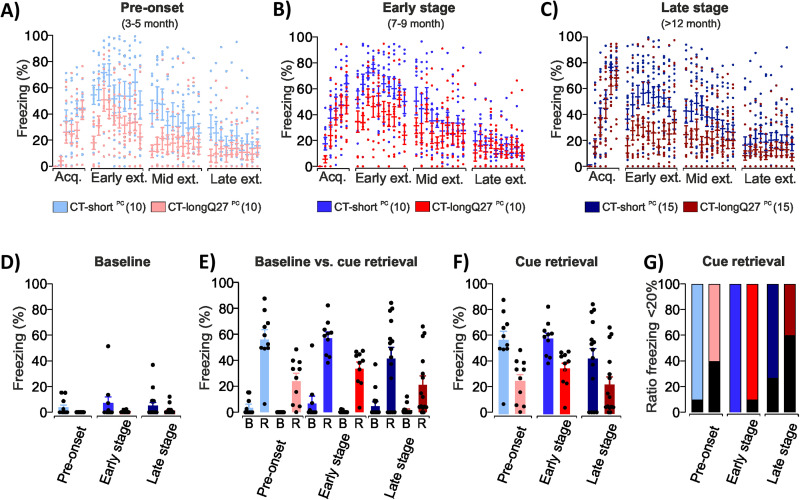
Functional brain imaging studies in humans suggest involvement of the cerebellum in fear conditioning but do not allow conclusions about the functional significance. The main aim of the present study was to examine whether patients with cerebellar degeneration show impaired fear conditioning and whether this is accompanied by alterations in cerebellar cortical activations. To this end, a 2 d differential fear conditioning study was conducted in 20 cerebellar patients and 21 control subjects using a 7 tesla (7 T) MRI system. Fear acquisition and extinction training were performed on day 1, followed by recall on day 2. Cerebellar patients learned to differentiate between the CS+ and CS-. Acquisition and consolidation of learned fear, however, was slowed. Additionally, extinction learning appeared to be delayed. The fMRI signal was reduced in relation to the prediction of the aversive stimulus and altered in relation to its unexpected omission. Similarly, mice with cerebellar cortical degeneration (spinocerebellar ataxia type 6, SCA6) were able to learn the fear association, but retrieval of fear memory was reduced. In sum, cerebellar cortical degeneration led to mild abnormalities in the acquisition of learned fear responses in both humans and mice, particularly manifesting postacquisition training. Future research is warranted to investigate the basis of altered fMRI signals related to fear learning.

Keywords: associative learning; cerebellar atrophy; cerebellum; fear conditioning; human; mouse model.


Conflict of interest statement

The authors declare no competing financial interests.

Figures

Figure 1.
Figure 1.
Experimental paradigm and event blocking scheme in the human study. Habituation and fear acquisition training were performed in the acquisition (Acq.) context. Extinction training and recall were performed in the extinction (Ext.) context. Contexts were represented by a photo of different office rooms either showing a desk (“office”) or a bookshelf (“library”). The conditioning stimuli (CSs) were represented by the same desk lamp, which emitted light in either blue, red, or yellow colors. The experimental paradigm closely followed the one described in Albayrak et al. (2023), which was based on the earlier study conducted by Milad et al. (2007).
Figure 2.
Figure 2.
Experimental paradigm for animal study. A, The mouse models expressed the human C terminus with 27 polyQ repeats in Purkinje cells (CT-longQ27PC), displayed in red and their corresponding CT-shortPC controls in blue which lack polyQ repeats. B, Schematic representation of the auditory fear conditioning protocol consisting of fear acquisition training, during which six tone and foot shock pairings were given, followed by three extinction training days, during which 10 tones each were presented.
Figure 3.
Figure 3.
Results of DASS-21 questionnaire. Median scores and interquartile range (IQR) in the patient and control groups. The DASS-21 questionnaire scores did not reveal any significant group differences (Mann–Whitney U test). Horizontal lines denote median values; whiskers range from the first to the third quartile. Normal range: depression score, 0–9; anxiety score, 0–7; stress score, 0–14; maximum possible score, 42 (Lovibond et al., 1995). Circles represent individual scores: yellow circles represent SCA6 patients; white circles, non-SCA6 patients; black circles—controls. For color-coding of individual patients based on SARA score see Extended Data Figure 3-1. *The questionnaire results were reanalyzed excluding the trembling-related item.
Figure 4.
Figure 4.
Results of questionnaires in cerebellar patients and controls prior acquisition, postacquisition, postextinction, and postrecall. Median ratings regarding (A) valence, (B) arousal, (C) fear, and (D) US expectancy on a Likert scale of 1 (“very pleasant”/“very calm”/“not afraid,” “US not expected,” respectively) to 9 “very unpleasant”/“very nervous”/“very afraid,” “US expected,” respectively). Horizontal lines denote median values. Whiskers range from the first to the third quartile. Blue colors, controls; red colors, cerebellar patients. Dark colors, CS+E and CS+U; light colors, CS–. Circles represent individual responses: yellow circles represent SCA6 patients; white circles, non-SCA6 patients; black circles, controls. For color-coding of individual patients based on SARA score, see Extended Data Figure 4-2. Gray background, fear acquisition training. Postacquisition training responses to CS+E and CS+U were averaged (CS+avg). Both controls and patients showed differential responses toward the CS+ and CS− postacquisition and postrecall. This difference was also present postextinction in controls, but not in patients. RTE estimates are shown in Extended Data Figure 4-1; statistical findings are summarized in Extended Data Table 4-1.
Figure 5.
Figure 5.
Results of SCRs in cerebellar patients and controls prior acquisition (habituation), during acquisition, extinction, and recall. A, SCR amplitudes and (B) SCR incidences. Colored bars represent group mean values for habituation, early and late blocks of fear acquisition training, extinction training, and recall. Postacquisition training responses to CS+E and CS+U were averaged (CS+avg). Error bars indicate SEM. Blue colors, controls; red colors, cerebellar patients. Dark colors, CS+E/CS+avg and CS+U; light colors, CS−. Circles represent individual responses: yellow circles represent SCA6 patients; white circles, non-SCA6 patients; black circles—controls. For color-coding of individual patients based on SARA score, see Extended Data Figure 5-3. SCR amplitudes were higher toward the CS+ compared with those toward the CS− in acquisition training and early recall in both patients and controls. In controls, SCR incidences were significantly higher toward the CS+ compared with those toward the CS, already during the early block, but in patients only during the late acquisition block. In recall, SCR incidences were higher for both CS+ trials compared with those for CS− in both groups. Notably, in patients, SCR incidences for CS+U remained significantly higher compared with those for the CS− throughout the entire phase. RTE estimates are shown in Extended Data Figure 5-1; SCR amplitudes related to the aversive US are shown in Extended Data Figures 5-2 and 5-4. Statistical findings are summarized in Extended Data Tables 5-1 (SCR amplitudes) and 5-2 (SCR incidences).
Figure 6.
Figure 6.
Results of voxel-based morphometry and cerebellar activation related to the presentation of the aversive US. A, gray matter voxel-based morphometry (contrast “control group > cerebellar group”). US-related cerebellar activation (contrast “US post CS+ > no-US post CS−” during fear acquisition training) in (B) healthy controls and (C) cerebellar patients collapsed over early and late fear acquisition blocks. VBM group results and cerebellar activations are calculated using TFCE and FWE correction (p < 0.05) and in SUIT space projected on a cerebellar flatmap (Diedrichsen and Zotow, 2015). VBM, voxel-based morphometry; CS, conditioned stimulus; L, left; R, right; SUIT, spatially unbiased atlas template of the cerebellum; TFCE, threshold-free cluster enhancement; FWE, family-wise error rate; US, unconditioned stimulus. Additional details for VBM analysis are provided in Extended Data Table 6-1. Results of fMRI analysis are provided in Extended Data Table 6-2. For VBM analysis of patient subgroups, see Extended Data Figure 6-1.
Figure 7.
Figure 7.
Cerebellar activation related to the CS+ and CS− during late fear acquisition training in healthy controls (top row), patients (middle row), and a comparison between controls and patients (bottom row). Cerebellar activations during the presentation of (A, C) CS+ (contrast “CS+ > rest”), (B, D) CS− (contrast “CS− > rest”) during late fear acquisition. E, F, In late acquisition CS− shows increased activation in comparison with early acquisition (contrast “CS−, late > early”). All contrasts are calculated using TFCE and FWE correction (p < 0.05) and presented in SUIT space projected on a cerebellar flatmap (Diedrichsen and Zotow, 2015). CS, conditioned stimulus; L, left; R, right; SUIT,  spatially unbiased atlas template of the cerebellum; TFCE, threshold-free cluster enhancement; FWE, family-wise error rate. No surviving clusters = no significant clusters ≥10 voxel (isotropic voxel size, 1.7 mm) after application of TFCE at p < 0.05 FWE corrected level. Results of fMRI analysis are provided in Extended Data Table 6-2. Group comparisons revealed significantly more cerebellar activations related to the CS− in controls compared with those in patients, while no significant group differences were found for the CS+. Note that TFCE correction takes values of neighboring voxels into account which is different to voxel-based correction. Despite the widespread activations in the control group, activations remain relatively weak and likely explain the absence of a significant group difference, despite clear differences based on (A) and (C).
Figure 8.
Figure 8.
Cerebellar activation related to the CS during fear acquisition training (contrast “CS+ late > early”; left column and contrast “CS− late > early”; right column) in (A, B) healthy controls and (C, D) cerebellar patients in SUIT space projected on a cerebellar flatmap (Diedrichsen and Zotow, 2015). All contrasts are calculated using TFCE and FWE correction (p < 0.05). CS, conditioned stimulus; L, left; R, right; SUIT, spatially unbiased atlas template of the cerebellum; TFCE, threshold-free cluster enhancement; FWE, family-wise error rate. No surviving clusters = no significant clusters ≥10 voxel (isotropic voxel size, 1.7 mm) after application of TFCE at p < 0.05 FWE corrected level. Results of fMRI analysis are provided in Extended Data Table 6-2. Controls exhibited significantly higher cerebellar activations related to the presentation of both CS+ and CS− during late fear acquisition training compared with early training. Patients did not show any cerebellar activations.
Figure 9.
Figure 9.
Cerebellar activation related to the omission of the aversive US during acquisition training (contrast “no-US post CS+ > rest”) in (A) healthy controls, (B) cerebellar patients, and (C, D) comparison between controls and patients in SUIT space projected on a cerebellar flatmap (Diedrichsen and Zotow, 2015). All contrasts are calculated using TFCE and FWE correction (p < 0.05). CS, conditioned stimulus; L, left; R, right; SUIT, spatially unbiased atlas template of the cerebellum; TFCE, threshold-free cluster enhancement; FWE, family-wise error rate; US, unconditioned stimulus. No surviving clusters = no significant clusters ≥10 voxel (isotropic voxel size, 1.7 mm) after application of TFCE at p < 0.05 FWE corrected level. Results of fMRI analysis are provided in Extended Data Table 6-2. Cerebellar activations were more prominent in patients compared with those in controls with no significant difference between groups.
Figure 10.
Figure 10.
Cerebellar activation related to the omission of the aversive US during early extinction training (contrasts “no-US post CS+ > rest” and “no-US post CS− > rest”) in healthy controls (top row) and cerebellar patients (bottom row) in SUIT space projected on a cerebellar flatmap (Diedrichsen and Zotow, 2015). All contrasts are calculated using TFCE and FWE correction (p < 0.05). CS, conditioned stimulus; L, left; R, right; SUIT, spatially unbiased atlas template of the cerebellum; TFCE, threshold-free cluster enhancement; FWE, family-wise error rate; US, unconditioned stimulus. No surviving clusters = no significant clusters ≥10 voxel (isotropic voxel size, 1.7 mm) after application of TFCE at p < 0.05 FWE corrected level. Results of fMRI analysis are provided in Extended Data Table 6-2. During early extinction training, controls exhibited significant no-US–related cerebellar activations in CS+ trials, whereas cerebellar patients showed significant no-US–related activations toward CS− trials.
Figure 11.
Figure 11.
Cerebellar activation related to the CS and omission of the aversive US during early recall (contrasts “CS+ > rest” and “no-US post early CS+ > rest”) in healthy controls (top row), cerebellar patients (middle row), and a comparison between controls and patients (bottom row) in SUIT space projected on a cerebellar flatmap (Diedrichsen and Zotow, 2015). All contrasts are calculated using TFCE and FWE correction (p < 0.05). CS, conditioned stimulus; L, left; R, right; SUIT, spatially unbiased atlas template of the cerebellum; TFCE, threshold-free cluster enhancement; FWE, family-wise error rate; US, unconditioned stimulus. No surviving clusters = no significant clusters ≥10 voxel (isotropic voxel size, 1.7 mm) after application of TFCE at p < 0.05 FWE corrected level. Results of fMRI analysis are provided in Extended Data Table 6-2. Controls exhibited significant cerebellar activations related to the CS+ presentation and significant cerebellar activations related to the omission of the US in CS+ trials. Group comparisons revealed significantly stronger activations related to the CS+ presentation in controls compared with those in patients.
Figure 12.
Figure 12.
Results in SCA6 mouse model (CT-longQ27PC). Deficits are demonstrated in early fear extinction training (i.e., during retrieval) in all stages of the disease. A, Pre-onset CT-shortPC (light blue) and CT-longQ27PC (light red) mice were analyzed for freezing behavior during the 30 s conditioning stimulus (CS) in fear acquisition (acq.) and extinction training (ext.). Pre-onset CT-longQ27PC mice displayed lower freezing levels during early extinction. B, Early stage CT-longQ27PC (red) mice displayed reduced freezing levels during early extinction in comparison with CT-shortPC (blue) mice. C, Freezing behavior for late stage CT-shortPC (dark blue) and CT-longQ27PC (dark red) mice during the CSs of fear acquisition and extinction training revealed no differences in freezing behavior between mouse lines. D, Baseline freezing as a sign of generalized fear revealed that CT-longQ27PC mice did not display significantly different freezing levels in comparison with CT-shortPC mice. E, Comparison of baseline (B) and retrieval (R) freezing of each group revealed that all groups display significantly higher freezing during the CS presentation concerning their previous baseline freezing. F, Freezing behavior during cue retrieval, which is defined as the percentage of freezing to the first two CS presentations during early extinction, was analyzed to show fear-related learning to the cue and revealed that CT-longQ27PC mice display lower freezing levels in comparison with CT-shortPC mice during the pre-onset and early stage of the disease. G, Percentage of mice per group displaying freezing responses below 20% (black) and above 20% (corresponding group color) during cue retrieval. A–F, Mean ± SEM with individual animals as single points. The number of animals is indicated in parentheses behind the group. Statistical findings are summarized in Extended Data Tables 12-1, 12-2, and 12-3.

Similar articles

Cited by

References

    1. Adamaszek M, Manto M, Schutter DJL (2022) The emotional cerebellum, Ed 1. Switzerland: Springer.
    1. Albayrak B, Jablonski L, Felderhoff-Mueser U, Huening BM, Ernst TM, Timmann D, Batsikadze G (2023) Fear conditioning is preserved in very preterm-born young adults despite increased anxiety levels. Sci Rep 13:11319. 10.1038/s41598-023-38391-4 - DOI - PMC - PubMed
    1. Apps R, Strata P (2015) Neuronal circuits for fear and anxiety - the missing link. Nat Rev Neurosci 16:642. 10.1038/nrn4028 - DOI - PubMed
    1. Asher M, Rosa JG, Rainwater O, Duvick L, Bennyworth M, Lai RY, Kuo SH, Cvetanovic M (2020) Cerebellar contribution to the cognitive alterations in SCA1: evidence from mouse models. Hum Mol Genet 29:117–131. 10.1093/hmg/ddz265 - DOI - PMC - PubMed
    1. Badura A, Verpeut JL, Metzger JW, Pereira TD, Pisano TJ, Deverett B, Bakshinskaya DE, Wang SS (2018) Normal cognitive and social development require posterior cerebellar activity. Elife 7:e36401. 10.7554/eLife.36401 - DOI - PMC - PubMed

LinkOut - more resources