. 2024 Jan 4;15(1):288.
doi: 10.1038/s41467-023-43505-7.

Spin relaxation of electron and hole polarons in ambipolar conjugated polymers

Affiliations

Spin relaxation of electron and hole polarons in ambipolar conjugated polymers

Remington L Carey et al. Nat Commun. .

Abstract

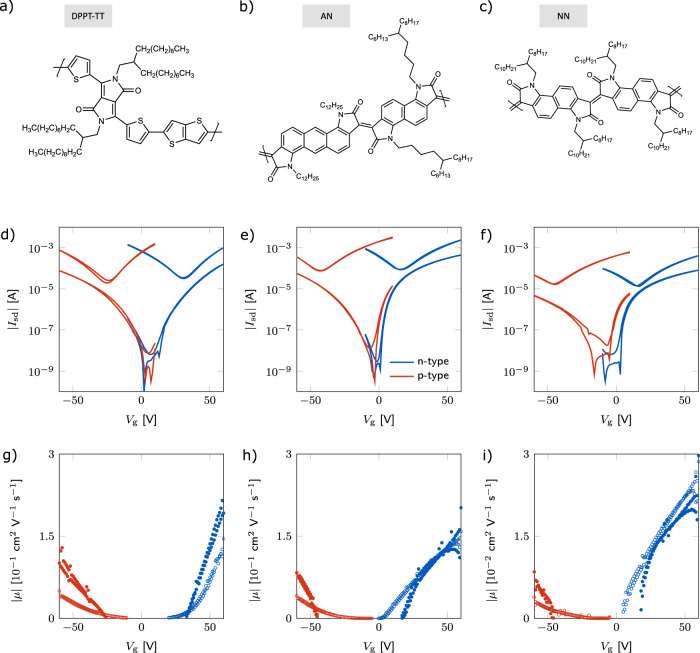
The charge-transport properties of conjugated polymers have been studied extensively for opto-electronic device applications. Some polymer semiconductors not only support the ambipolar transport of electrons and holes, but do so with comparable carrier mobilities. This opens the possibility of gaining deeper insight into the charge-transport physics of these complex materials via comparison between electron and hole dynamics while keeping other factors, such as polymer microstructure, equal. Here, we use field-induced electron spin resonance spectroscopy to compare the spin relaxation behavior of electron and hole polarons in three ambipolar conjugated polymers. Our experiments show unique relaxation regimes as a function of temperature for electrons and holes, whereby at lower temperatures electrons relax slower than holes, but at higher temperatures, in the so-called spin-shuttling regime, the trend is reversed. On the basis of theoretical simulations, we attribute this to differences in the delocalization of electron and hole wavefunctions and show that spin relaxation in the spin shuttling regimes provides a sensitive probe of the intimate coupling between charge and structural dynamics.


Conflict of interest statement

The authors declare no competing interests.

Figures

Fig. 1
Fig. 1. Ambipolar FET characteristics for DPPT-TT, AN, and NN at room temperature.
ac The chemical structures of the three molecules used for this study: DPPT-TT, AN, and NN, respectively. df Device transfer curves in both the linear and saturation regimes. Red corresponds to holes and blue to electrons. In all plots, the upper, v-shaped trace corresponds to the saturation regime (as expected for ambipolar performance). gi Corresponding mobilities (where, for clarity, mobilities before the turn-on voltage are not shown). The open (filled) symbols in correspond to the linear (saturation) mobilities.
Fig. 2
Fig. 2. Representative ambipolar FI-ESR spectra.
ac Fixed-power spectra for holes and electrons in DPPT-TT, AN, and NN, respectively, at 200 K. The solid blue trace corresponds to electrons and the dashed red trace to holes. (1c inset): A schematic of a field-induced ESR sample, showing the source, drain, and interdigitated gate electrodes. d Stacked plots of the n-type spectra in AN at 200 K as a function of microwave power. The block dots are data points while the red traces are fits to the data. e The same spectra as in (d) presented as a surface plot with the full 2D fit. ESR spectra at 10 and 100 K are shown in Supplementary Note 3 for comparison.
Fig. 3
Fig. 3. Extracted transverse relaxation times (T2) and saturation mobilities from 5 to 290 K.
ac Dependence on temperature of the n- and p-type polaronic transverse relaxation times in DPPT-TT, AN, and NN, respectively. The red and blue arrows mark a transition in relaxation regime for holes and electrons, respectively. The first (per color per plot) marks the transition from inhomogenous broadening to motional narrowing, and the second from motional narrowing to high-temperature relaxation. The n-type T2 data for AN and NN has previously been published, but is shown here for comparison. df Dependence of polaron mobilities on temperature across the three different materials. At low temperatures, polaronic mobilities differ by over an order of magnitude in DPPT-TT, while they are within an order of magnitude in AN (Low-temperature data is not available for NN for reasons mentioned in the main text). Above 200 K, polaronic mobilities are nearly equal in DPPT-TT, while in AN and NN there remains a significant difference.
Fig. 4
Fig. 4. Temperature-dependent experimental and theoretical hole and electron mobilities for DPPT-TT and related inverse participation ratio (IPR) distributions.
a, b Experimental polaron mobilities reproduced from Fig. 3d and corresponding theoretical mobilities calculated as described in the text for two different values of λext (i.e., 100 and 150 meV). The blue and orange shaded regions indicate the interval spanned by these two values. Theoretical intra-chain mobilities are given as an average over 10,000 surface-hopping trajectories. c, d Violin plots representing IPR distributions (obtained from the same surface-hopping trajectories) at 150 K and 300 K for electron and hole wavefunctions, respectively. In this case, λext = 150 meV is shown. Black bars in the center represent interquartile ranges, while the thinner black lines stretching from the center represent Tukey’s fences. White and magenta dots represent medians and means of the distributions, respectively. The mode of the distributions can be inferred by their maximum width. Note that electron IPR distributions have longer tails at all temperatures.
Fig. 5
Fig. 5. State-resolved inverse participation ratio, density of states (DOS) and potential energy surfaces as a function of time.
a, b 2D histograms correlating the delocalization of the valence band and conduction band states, respectively, quantified by binning the inverse participation ratio IPRi of the adiabatic states (eq. (10)) versus their energies. The states become denser moving from dark blue, to green, to yellow regions. The color bar indicates the states count in a given bin. Vertical dashed red lines indicate the (average) active state energy (see Methods), while the dotted orange and yellow lines indicate the energies of the HOMOs and LUMOs of DPPT (ϵDPPT) and TT (ϵTT) units found from periodic DFT calculations at 0 K. c, d The DOS of conduction and valence band states of the system, respectively. DOS and state-resolved IPRs (IPRi) are computed from Hamiltonians extracted from 10 surface hopping trajectories carried out at 300 K (including the effect of thermal disorder). Vertical lines continue from the upper panels (e) and (f) The time-evolution of the active state (red) and the corresponding full eigenspectrum along a representative trajectory for the polymer system in the case of electrons and holes.

References

    1. Chua L-L, et al. General observation of n-type field-effect behaviour in organic semiconductors. Nature. 2004;434:194–199. doi: 10.1038/nature03376. - DOI - PubMed
    1. Meijer EJ, et al. Solution-processed ambipolar organic field-effect transistors and inverters. Nat. Mater. 2003;2:678–682. doi: 10.1038/nmat978. - DOI - PubMed
    1. Schmechel, R. et al. Light-emitting field-effect transistor: Simple model and underlying functional mechanisms. In Organic Field Effect Transistors II, 5217, 101–111 (SPIE, 2003).
    1. Chesterfield R, et al. High electron mobility and ambipolar transport in organic thin-film transistors based on a pi-stacking quinoidal terthiophene. Adv. Mater. 2003;15:1278–1282. doi: 10.1002/adma.200305200. - DOI
    1. Zaumseil J, Sirringhaus H. Electron and ambipolar transport in organic field-effect transistors. Chem. Rev. 2007;107:1296–1323. doi: 10.1021/cr0501543. - DOI - PubMed