. 2024 Jan 4;15(1):205.
doi: 10.1038/s41467-023-44233-8.

VAP spatially stabilizes dendritic mitochondria to locally support synaptic plasticity

Affiliations

VAP spatially stabilizes dendritic mitochondria to locally support synaptic plasticity

Ojasee Bapat et al. Nat Commun. .

Abstract

Synapses are pivotal sites of plasticity and memory formation. Consequently, synapses are energy consumption hotspots susceptible to dysfunction when their energy supplies are perturbed. Mitochondria are stabilized near synapses via the cytoskeleton and provide the local energy required for synaptic plasticity. However, the mechanisms that tether and stabilize mitochondria to support synaptic plasticity are unknown. We identified proteins exclusively tethering mitochondria to actin near postsynaptic spines. We find that VAP, the vesicle-associated membrane protein-associated protein implicated in amyotrophic lateral sclerosis, stabilizes mitochondria via actin near the spines. To test if the VAP-dependent stable mitochondrial compartments can locally support synaptic plasticity, we used two-photon glutamate uncaging for spine plasticity induction and investigated the induced and adjacent uninduced spines. We find VAP functions as a spatial stabilizer of mitochondrial compartments for up to ~60 min and as a spatial ruler determining the ~30 μm dendritic segment supported during synaptic plasticity.


Conflict of interest statement

The authors declare no competing interests.

Figures

Fig. 1
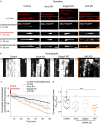
Fig. 1. APEX strategy to label proteins interacting with neuronal mitochondria.
a Experimental workflow for APEX-based proteome labeling of the mitochondrial outer membrane (OMM) and mitochondrial matrix. b Representative images showing APEX expression on the OMM (magenta) and the biotinylated proteome (green). Total n: 9 neurons, 2 animals. Scale bar, 20 μm. c Line profiles of the respective dendrites pointed in (b) (white arrows) show diffused biotin labeling with APEX-OMM. Scale bar 10 μm. d Representative images showing APEX expression within the matrix (magenta) and the biotinylated proteome (green). Scale bar, 20 μm. Total n: 60 neurons, 5 animals. e Line profiles of the respective dendrites pointed in (d) (white arrows) show spatially confined biotin labeling compared to APEX-OMM in (c). Scale bar 10 μm. Source Data files are provided.
Fig. 2
Fig. 2. Identifying actin-interacting proteins on the outer mitochondrial membrane.
a Experimental workflow for APEX-OMM proteome labeling in primary hippocampal neuronal cultures for mass spectrometry analysis. b Representative biological replicate (of c, d) showing the OMM proteome yield (green) after subtracting the proteins measured in Controls—in the absence of APEX-OMM (black) and the absence of hydrogen peroxide (gray). The proteins detected in Controls are endogenous biotinylated proteins (pyruvate carboxylase, 3-methylcrotonyl CoA carboxylase, propionyl CoA carboxylase, and acetyl CoA carboxylase) and non-specific proteins binding to streptavidin beads during enrichment. As we followed a stringent criterion of excluding the proteins found in Controls from experimental samples, irrespective of their intensities (see Methods), there might be an overestimation of proteins in the two Control samples. c Flowchart of the mass spectrometry proteome analysis of three biological replicates, following filtering for Controls as in (b), yielding 129 proteins from two out of three biological replicates and identifying actin (Actb) and tubulin (Tuba1a) interactors on the OMM using BioGRID. d 129 proteins of the OMM proteome analyzed for gene ontology (GO) annotation for the term “Mitochondria” (“Mitochondria GO Annotated, green), and proteins not GO annotated as “Mitochondria” (Non-GO Annotated, gray). 18 proteins identified in BioGRID as actin interactors (Actin Interactors, black line), 6 proteins identified in BioGRID as tubulin interactors (Tubulin Interactors, dotted black line), and the 8 actin-interacting OMM proteins selected for the next round of screening (black arrows). n: 3 biological replicates, 3 animals.
Fig. 3
Fig. 3. Identifying proteins required for mitochondria-actin tethering in dendrites.
a Cartoon illustrating the labeling strategy for visualizing mitochondria and mitochondria-actin interaction regions. Representative Airyscan confocal image (of d) of a neuronal dendrite transfected with Fis1-mCherry (red), Fis1-Lifeact-GFP (white), and Control shRNA (b, Control) or VAP shRNA (c, VAP KD) showing fewer mitochondrial regions interacting with actin (white) in VAP KD (c) compared to Control (b). The gray dashed box depicts the straightened dendritic segment magnified for better visualization (inset). Scale bar, 5 μm. d Significant reduction in the average mitochondria-actin interaction percentage in all 8 protein knockdown conditions compared to Control shRNA-expressing dendrites. The mitochondrial uniporter (Mcu) was used as a negative Control, given its localization in the mitochondrial inner membrane and the absence of any known actin association. n in dendrites, animals: 33, 18 (Control), 7, 2 (Neg. control), 8, 3 (Cap1), 10, 4 (Immt), 10, 6 (Snca), 9, 1 (Cyfip1), 8, 2 (Nckap1), 7, 2 (Pfn2), 9, 6 (Srgap2), 8, 5 (VAP). One-way ANOVA, Tukey test, p-values: 0.31 (Neg. control), 8.75 ×10⁻⁵ (Cap1), 0.01 (Immt), 0.02 (Snca), 4.71 × 10−6 (Cyfip1), 1.36 × 10−4 (Nckap1), 2.97 × 10−8 (Pfn2), 1.65 × 10−5 (Srgap2), and 0.01 (VAP). Source Data files are provided.
Fig. 4
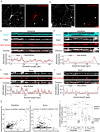
Fig. 4. VAP spatially stabilizes mitochondria in dendrites.
a Representative images (of c, d) of straightened dendrites expressing Mito-DsRed (red), Mito-PAGFP (white) and Control shRNA (Control), Snca shRNA (Snca KD), Srgap2 shRNA (Srgap2 KD) or VAP shRNA (VAP KD, orange box) before (prephotoactivation, t = 0 min), at (photoactivation, t = 3.5 min), and after photoactivation (postphotoactivation t = 10 min, 55 min). The Mito-DsRed signal was used to locate mitochondria for photoactivation at t = 0 min. In Srgap2 KD dendrites, the Mito-DsRed signal is contaminated by the cytosolic tdTomato signal coexpressed by the Srgap2 shRNA plasmid. Scale bar, 5 μm. b Representative kymographs (of c, d) of the photoactivated mitochondrial compartments in (a) show stable mitochondrial compartments in Control; shortened and modest destabilization of mitochondrial compartments in Snca and Srgap2 KD; and shortened and destabilized mitochondrial compartments in VAP KD (orange box). The black arrow denotes the prephotoactivation, the red arrow denotes the photoactivation, and the dark and light gray arrows denote the postphotoactivation time points. Horizontal scale bar, 5 μm. Vertical scale bar, 10 min. c The average time course of photoactivated mitochondrial compartment fluorescence shows a modest decrease in Control (black), a moderate decrease that was not statistically significant in Snca (gray) and Srgap2 KD (light gray), and a dramatic and statistically significant decrease in VAP KD (orange). n in dendrites, animals: 14, 3 (Control), 11, 2 (Snca KD), 11, 2 (Srgap2 KD), 17, 4 (VAP KD). While reduction in photoactivated compartment fluorescence could be due to continuity between mitochondria due to fusion, this is minimal in Control; and in VAP KD, the mitochondria are shorter, perhaps due to decreased fusion (see Discussion). Control for photobleaching (light gray without symbol, n: 4 regions, 3 animals) was measured from static, photoactivated mitochondrial regions, showed a negligible decrease, suggesting minimal photobleaching during imaging. The red arrow denotes the photoactivation time point. d The mitochondrial compartment stability index showed a statistically significant decrease in VAP KD dendrites compared to Control, Snca KD, and Srgap2 KD. n: same as in (c). One-way ANOVA, Tukey test, p-value: 2.3 × 10−4. Source Data files are provided.
Fig. 5
Fig. 5. Vapb is enriched near mitochondria in dendrites but not in axons.
Representative images (of i) of neurons immunostained for Vapa (white) and mitochondria (Mito-DsRed, red) (a); and Vapb (white) and mitochondria (Mito-DsRed, red) (d). Arrows depicting dendrites and arrowheads depicting axons, straightened and magnified for better visualization in (bf). Representative line profiles (of i) showing local enrichment of Vapa near dendritic (b, arrow in a) and axonal mitochondria (c, arrowhead in a) and Vapb near dendritic (e, arrow in d) but not near axonal mitochondria (f, arrowhead in d). Map2 (cyan) was used to trace the dendrite, and the Vapa and Vapb signal was used to trace the axon (white lines). Vapa and Vapb antibodies were validated in Vapa and Vapb knockdown neurons, respectively. Scale bar, 5 μm. Representative correlation (of i) between individual fluorescent pixel intensities of mitochondria (Mito-DsRed) and Vapb show a strong correlation in the dendrite (g) but not in the axon (h). i The average correlation coefficient measured shows a strong correlation between mitochondria and Vapa (A), Vapb (B) in fixed dendrites, and Vapb in live dendrites (Blive, Vapb-emerald), compared to shuffled control (Shf, see Methods). In axons, a strong correlation between mitochondria and A was observed, but not between mitochondria and B and Blive compared to Shf. Furthermore, the correlation coefficient between Vapb (B and Blive) and mitochondria in dendrites is statistically significant compared to that in axons. n in dendrites, animals: 11, 2 (A), 7, 3 (B), 12, 4 (Blive), 14, 4 (Shf). n in axons, animals: 9, 2 (A), 8, 2 (B), 5, 1 (Blive), 11, 3 (Shf). One-way ANOVA, Tukey test, p-values: 0.00261 (B den versus ax), 0.01644 (Blive den versus ax), <0.0001 (A, B, Blive den versus Shf den), <0.0001 (A ax vs Shf ax), 0.00338 (A ax vs B and Blive ax). As a positive control, the correlation between two different fluorescent tags targeted to the mitochondrial matrix (Mito-DsRed and Mito-PAGFP) was used, which provided the upper limit of the correlation coefficient. As a negative control, the correlation between a mitochondrial (Mito-DsRed) and a non-mitochondrial tag was used for the lower limit of the correlation coefficient. Source Data files are provided.
Fig. 6
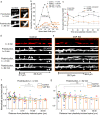
Fig. 6. VAP’s absence affects synaptic and clustered synaptic plasticity.
a Representative plasticity-induced spine (white asterisk) (of c, f, g) measured at 0 and 62 min showed an increase in spine-head width in Control but not in VAP KO. Scale bar, 2 μm. b GCaMP fluorescence along the line crossing the spine-head center (gray dashed line in a) to measure spine-head width in Control (black) and VAP KO spines (orange), before (empty circles, t = 0 min) and after plasticity induction (full circles, t = 62 min). c The average time course showed an increase in spine-head width in Control (black) but not in VAP KO (orange) at 62 min post-spine plasticity induction and in Control, uninduced spines (gray). n in spines, animals: 27, 11 (Control), 33, 7 (VAP KO), 19, 5 (Control, uninduced). One-way ANOVA, Tukey test, p-values: 8.77 × 10−4 (22-42 min) and 3.36 × 10−4 (42–62 min). Paired sample t-test between t = 2 and 62 min in VAP KO, p values: 0.06 (normalized data), 0.04 (unnormalized). d, e Representative plasticity-induced spines (white asterisk) (of f, g) measured at 0, 2, and 62 min showed an increase in spine-head width in plasticity-induced and adjacent, PSD95- or Homer2-positive, uninduced spines (white arrowhead) within 30 μm in Control neurons. VAP KO neurons exhibited structural plasticity in the plasticity-induced spine (white asterisk) 2 min postinduction but not in adjacent, uninduced spines (white arrowhead) and 62 min postinduction. Scale bar, 5 μm. f, g Histograms showing an increase in spine-head width 2 and 62 min post-plasticity induction, within 30 μm from plasticity-induced spines, in Control (gray) and 2 min post-plasticity induction in VAP KO (orange) (f), but not in adjacent spines and 62 min post-plasticity induction in VAP KO (orange) (g). Individual points represent spines and are color-coded by neurons. For Control, n in spines, animals: 27, 11 (0 μm), 14, 8 (0–15 μm); 9, 5 (15–30 μm); 4, 2 (30–45 μm). For VAP KO, n in spines, animals: 32, 7 (0 μm); 17, 4 (0–15 μm); 9, 5 (15–30 μm); 7, 4 (30–45 μm). One-way ANOVA, Tukey test, p-values: 0.031 (f), 0.003 (g). Source Data files are provided.
Fig. 7
Fig. 7. VAP spatially stabilizes mitochondria to locally support synaptic plasticity.
Illustration showing the significance of VAP (orange rounded rectangle) as a spatial organizer in stabilizing mitochondrial compartments (light orange) to support plasticity-induced spines (lightning bolt) and adjacent spines (light gray). The WT dendritic segment with normal VAP expression and mitochondrial stabilization exhibits spine structural plasticity in plasticity-induced and adjacent spines within 30 μm. VAP deletion shortens and destabilizes mitochondria (short light orange mitochondria that are mobile with light orange dashed arrows) in the dendrites and abolishes spine structural plasticity sustenance in both plasticity-induced and adjacent spines within 30 μm. VAP is a spatial organizer in stabilizing mitochondrial compartments via ER-actin-tethering (cyan ER and black actin filaments) for sustained synaptic plasticity formation. VAP also functions as the spatial ruler, determining the 30 μm dendritic segment supported by a mitochondrial compartment. These data emphasize the importance of VAP as a molecular tether in locally stabilizing a mitochondrial compartment to support the synaptic and clustered synaptic plasticity required for learning and development.

Similar articles

Cited by

References

    1. Rangaraju V, Tom Dieck S, Schuman EM. Local translation in neuronal compartments: how local is local? EMBO Rep. 2017;18:693–711. doi: 10.15252/embr.201744045. - DOI - PMC - PubMed
    1. Jang S, et al. Glycolytic enzymes localize to synapses under energy stress to support synaptic function. Neuron. 2016;90:278–291. doi: 10.1016/j.neuron.2016.03.011. - DOI - PMC - PubMed
    1. Li Z, Okamoto K, Hayashi Y, Sheng M. The importance of dendritic mitochondria in the morphogenesis and plasticity of spines and synapses. Cell. 2004;119:873–887. doi: 10.1016/j.cell.2004.11.003. - DOI - PubMed
    1. Pathak D, et al. The role of mitochondrially derived ATP in synaptic vesicle recycling. J. Biol. Chem. 2015;290:22325–22336. doi: 10.1074/jbc.M115.656405. - DOI - PMC - PubMed
    1. Rangaraju V, Calloway N, Ryan TA. Activity-driven local ATP synthesis is required for synaptic function. Cell. 2014;156:825–835. doi: 10.1016/j.cell.2013.12.042. - DOI - PMC - PubMed

Publication types